
Characteristics of Images
Before we go on to the next chapter, which looks in more detail at sensors and their characteristics, we need to define and understand a few fundamental terms and concepts associated with remote sensing images.
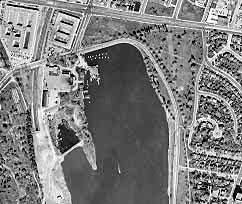
Electromagnetic energy may be detected either photographically or electronically. The photographic process uses chemical reactions on the surface of light-sensitive film to detect and record energy variations. It is important to distinguish between the terms images and photographs in remote sensing. An image refers to any pictorial representation, regardless of what wavelengths or remote sensing device has been used to detect and record the electromagnetic energy. A photograph refers specifically to images that have been detected as well as recorded on photographic film. The black and white photo to the left, of part of the city of Ottawa, Canada was taken in the visible part of the spectrum. Photos are normally recorded over the wavelength range from 0.3 µm to 0.9 µm - the visible and reflected infrared. Based on these definitions, we can say that all photographs are images, but not all images are photographs. Therefore, unless we are talking specifically about an image recorded photographically, we use the term image.
![]()
A photograph could also be represented and displayed in a digital format by subdividing the image into small equal-sized and shaped areas, called picture elements or pixels, and representing the brightness of each area with a numeric value or digital number. Indeed, that is exactly what has been done to the photo to the left. In fact, using the definitions we have just discussed, this is actually a digital image of the original photograph! The photograph was scanned and subdivided into pixels with each pixel assigned a digital number representing its relative brightness. The computer displays each digital value as different brightness levels. Sensors that record electromagnetic energy, electronically record the energy as an array of numbers in digital format right from the start. These two different ways of representing and displaying remote sensing data, either pictorially or digitally, are interchangeable as they convey the same information (although some detail may be lost when converting back and forth).
In previous sections we described the visible portion of the spectrum and the concept of colours. We see colour because our eyes detect the entire visible range of wavelengths and our brains process the information into separate colours. Can you imagine what the world would look like if we could only see very narrow ranges of wavelengths or colours? That is how many sensors work. The information from a narrow wavelength range is gathered and stored in a channel, also sometimes referred to as a band. We can combine and display channels of information digitally using the three primary colours (blue, green, and red). The data from each channel is represented as one of the primary colours and, depending on the relative brightness (i.e. the digital value) of each pixel in each channel, the primary colours combine in different proportions to represent different colours.
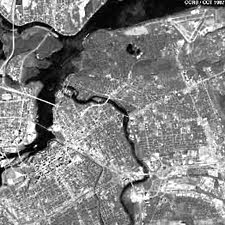
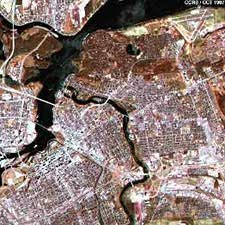
When we use this method to display a single channel or range of wavelengths, we are actually displaying that channel through all three primary colours. Because the brightness level of each pixel is the same for each primary colour, they combine to form a black and white image, showing various shades of gray from black to white. When we display more than one channel each as a different primary colour, then the brightness levels may be different for each channel/primary colour combination and they will combine to form a colour image.
Did you know?
Photographic film has the clear advantage of recording extremely fine spatial detail, since individual silver halide molecules can record light sensitivity differently than their neighbouring molecules. But when it comes to spectral and radiometric qualities, digital sensors outperform film, by being able to use extremely fine spectral bands (for spectral 'fingerprinting' of targets), and recording up to many thousands of levels of brightness.
Whiz quiz
1. If you wanted to map the deciduous (e.g. maple, birch) and the coniferous (e.g. pine, fir, spruce) trees in a forest in summer using remote sensing data, what would be the best way to go about this and why? Use the reflectance curves illustrating the spectral response patterns of these two categories to help explain your answer.
The answer is ...
2. What would be the advantage of displaying various wavelength ranges, or channels, in combination as colour images as opposed to examining each of the images individually?
The answer is ...
Whiz quiz - Answer
1. Because both types of trees will appear as similar shades of green to the naked eye, imagery (or photography) using the visible portion of the spectrum may not be useful. Trying to distinguish the different types from aerial photographs based on tree crown shape or size might also be difficult, particularly when the tree types are intermixed. Looking at the reflectance curves for the two types, it is clear that they would be difficult to distinguish using any of the visible wavelengths. However, in the near-infrared, although both types reflect a significant portion of the incident radiation, they are clearly separable. Thus, a remote sensing system, such as black and white infrared film, which detects the infrared reflectance around 0.8 µm wavelength would be ideal for this purpose.
2. By combining different channels of imagery representing different wavelengths, we may be able to identify combinations of reflectance between the different channels which highlight features that we would not otherwise be able to see, if we examine only one channel at a time. Additionally, these combinations may manifest themselves as subtle variations in colour (which our eyes are more sensitive to), rather than variations in gray tone, as would be seen when examining only one image at a time.
Page details
- Date modified: