
Question 7
Match the band combinations with their respective images.
Landsat TM Band Combinations
- 3, 2, 1
- 3, 4, 5
- 4, 3, 2
- 5, 4, 3
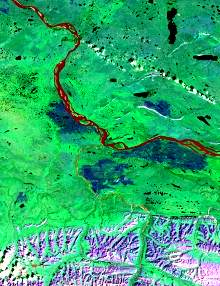
Satellite image: Mackenzie River, N.W.T., LANDSAT TM
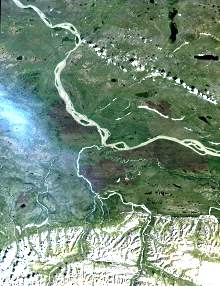
Satellite image: Mackenzie River, N.W.T., LANDSAT TM
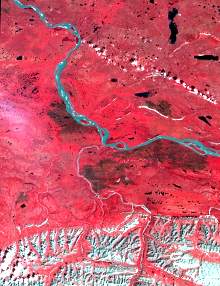
Satellite image: Mackenzie River, N.W.T., LANDSAT TM
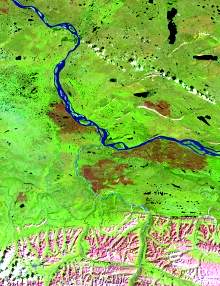
Satellite image: Mackenzie River, N.W.T., LANDSAT TM
When looking at image "C": the dark brown areas in the middle of the image are forest fire scars, the white areas at the bottom of the image are snow-covered mountain tops, the light blue line across the middle of the image is a river. There is a diagonal line of small clouds (and cloud shadows) across the top right of the image. The small black areas are lakes.
Image Information
Mackenzie River, N.W.T.
LANDSAT TM
Hints
3, 2, 1
This combination is the only one that includes band 1 with its blue sensitivity. Therefore, this combination of bands and colour assignments is the closest that we can come to making a real-colour simulation.
TM band 1 is the band most affected by atmospheric scattering, so it shows clouds, haze and smoke the best.
3,4,5
The red-sensitive band (#3) that has a little water penetration ability is coded as red in this band combination. The other two bands have no significant water penetration ability, so any sediment-laden water body should appear as red.
4,3,2
This is the simulation of the traditional of false-colour infrared film which shows healthy vegetation in shades of red./
5,4,3
The red-sensitive band (#3) which has a little water penetration ability is coded as blue in this band combination. The other two bands have no significant water penetration ability, so any sediment-laden water body should appear as blue.
Landsat 5 Thematic Mapper spectral band definitions:
Band 1: 0.45-0.52 micrometres (blue-green)
Band 2: 0.52-0.60 micrometres (green)
Band 3: 0.63-0.69 micrometres (red)
Band 4: 0.76-0.90 micrometres (near infrared)
Band 5: 1.55-1.75 micrometres (near infrared)
Band 6: 10.4-12.5 micrometres (thermal infrared)
Band 7: 2.08-2.35 micrometres (shortwave infrared)
Page details
- Date modified: