
Crop Productivity/Within Field Variation
Crop productivity depends on numerous factors including soil characteristics, climatic variables and crop management practices. Crop biomass, green leaf area and green leaf duration are indicators of crop condition and potential yield.. The extent to which biomass and Leaf Area Index (LAI), can be effectively monitored using microwave imagery is an ongoing area of research. The sensitivity of SAR data to crop condition is a function of imaging parameters such as wavelength, incidence angles and polarization, as well as parameters such as crop type and phenological stage (e.g. size, distribution, orientation and dielectric properties of component parts of the canopy).
In the following, two examples of the use of polarimetric data for crop condition monitoring are presented (from the work of McNairn et al.  ):
):
- the use of imagery in multiple polarizations to separate regions in a field with variations in crop condition.
- the ability to discern scattering mechanisms associated with zones of crop condition variability using the H/A/
 algorithm developed by Cloude and Pottier .
9.1.3.1 Within Field Variation as related to Polarization
The ability to determine variations within a field is illustrated using polarimetric C-SAR data acquired over Southen Ontario on June 30, 1999 as described by McNairn et al. . Imaging polarization combinations examined included the four linear transmit-receive polarizations (HH, VV, HV, and VH), as well as two circular transmit-receive polarizations (RR and LR).
A winter wheat field is used to illustrate the mapping of in-field variations(Figure 9-6a). A simple RGB image (R=VV, G=HV, B=HH) shows regions of low backscatter. Yield monitor data obtained two weeks following the SAR acquisition showed that these low backscatter areas corresponded to yields less than 70 bushels per acre (BPA).
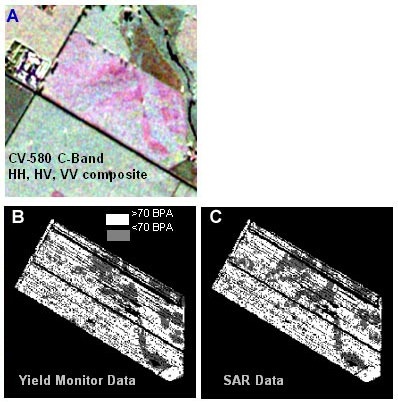
Figure 9-6. a) C-band image of winter wheat image (R=VV, G=HV, B=HH ); b) classified yield monitor data, bushels per acre (BPA), c) classified SAR data differentiating low and high yield zones (Noetix Research Inc., 2001)
It is noted that imagery at C-Band in HH alone could not have been used to separate the zones of different productivity. (Figure 9-7). Imagery in the linear cross-polarization (HV) was found to show the greatest contrast between the higher and lower productivity zones (4.1 dB), and this was followed by imagery in VV, RR, and LR polarizations showing differences of approximately 2 dB.
Figure 9-7. Backscatter at linear and circular polarizations for lower and higher producing zones of white winter wheat (from ).
The areas of low yield within the wheat field identified using the three linear polarizations agreed reasonably (77%) with the low yield areas identified by the yield monitor data.
A) Area of Agreement (Higher Yield) 77%
B) Area of Agreement (Lower Yield) 77%
C) "Error" (omission/comission) 23%
Figure 9-8. Percent agreement between SAR classification and yield monitor data .
Page details
- Date modified: