
Barriers to Individual Participation in Greenhouse Gas Reduction Activities - An Evaluation
Submitted to
Public Education and Outreach Issue Table
Submitted by
McKenzie-Mohr Associates
LURA Consulting Group
Cullbridge Marketing and Communications
McKenzie-Mohr Associates 2
EXECUTIVE SUMMARY
PURPOSE
This project involved evaluating barriers to participation by individuals in greenhouse gas (GHG) reduction activities and developing strategies to overcome these barriers. It was conducted for the Public Education and Outreach Issue Table.
METHODOLOGY
This project began with a review of Chapter 3, "Fostering Behaviour Change: An Introduction to Community-based Social Marketing," of the Public Outreach on Climate Change Foundation Paper and other research on behaviour change. Simultaneously, our project team worked with certain issue tables, federal departments, the project advisory committee and program delivery agents to select activities with substantial potential for reducing GHG emissions.
The group drew the activities from the residential (weatherstripping and caulking, installing programmable thermostats) and transportation sectors (maintaining tire pressure, reducing car engine idling, purchasing "best-of-class" vehicles). After selecting the activities, the group found that barriers for two of them were already well identified. Hence installing programmable thermostats and purchasing best-of-class vehicles didn't need more barrier research.
Of the remaining activities, the barriers to tire inflation and weatherstripping and caulking were investigated through focus groups. These two activities, plus car idling, were then examined via a telephone survey. Following this research, strategies and pilots were developed to increase participation in all five activities.
HIGHLIGHTS OF FOCUS GROUPS
On February 16–17, 1999, a series of nine focus groups were held across Canada as part of the Public Education and Outreach (PEO) Issue Table's project to evaluate barriers to participation by individuals in GHG reduction activities. Four of the sessions were held in urban areas: Halifax, Nova Scotia; Sainte-Foy, Quebec; Toronto, Ontario; and Calgary (Alberta). Five of the sessions were held in rural areas: Windsor, Nova Scotia; Saint-Antoine-de-Tilly, Quebec; Stayner, Ontario; Nanton, Alberta; and Nelson, British Columbia.
The purpose of the sessions was to investigate participants' knowledge, awareness and attitudes about two specific activities – weatherstripping and caulking, and tire inflation – that individuals can undertake to reduce GHG emissions. The sessions were also designed to gauge their awareness and understanding of climate change.
Weatherstripping and Caulking: All of the urban and rural participants reported having used weatherstripping, caulking or other materials to prevent drafts in their homes. The main motivations for engaging in these activities are to save money on heating bills and improve the comfort of their homes. The main barriers to engaging in these activities include the perception that they aren't necessary (for various reasons) and lack of time. Both rural and urban participants were split on the value of producing a video on how to use weatherstripping and caulking.
Tire Pressure: Most participants in both urban and rural areas reported checking their tire pressure. However, women in both areas tend to check their tire pressure less frequently and often rely on their husbands to do so. The main motivations for checking tire pressure are safety, reducing tire wear and improving mileage. Participants noted that the main reasons they didn't check their tire pressure regularly – or check it at all – included that it isn't something they think about, and they are concerned about the accuracy of pumps and gauges. Both urban and rural participants felt it would be useful for a gas station employee to prompt people to check their tire pressure. However, while most urban participants felt it would be useful for a gas station employee to show people how to use a tire gauge, most rural participants didn't.
Awareness and Understanding of Climate Change: Most participants in both urban and rural areas have heard of climate change. However, in Quebec, participants refer to climate change as global warming (réchauffement de la planète). Participants described climate change many ways, with the most commonly cited causes being ozone depletion and the greenhouse effect. Except for those in Quebec, most participants in both urban and rural areas felt that they would be affected by climate change. Again, with the exception of Quebec, most participants in both urban and rural areas felt that individuals could take action on the issue of climate change.
HIGHLIGHTS OF SURVEY
The firm Research House conducted the survey in English and French. The firm used two criteria to screen participants: they had to live in a house and drive a vehicle. The incidence of respondents who met both criteria was 72 percent. In total, 1031 Canadian adults were surveyed. The sample was stratified by region (British Columbia, the Prairies, Ontario, Quebec and the Maritimes) and by rural versus urban setting. Results from this survey can be considered accurate within plus or minus four percent, 19 times out of 20.
Respondents who checked their tires often were more likely than infrequent checkers to
- remember to check their tire pressure;
- have a tire gauge (86 versus 64 percent);
- report knowing their correct tire pressure;
- report knowing how to check their tires' pressure;
- report knowing how to use an air pump;
- report greater motivation to avoid unnecessary tire wear; and
- be male.
Idlers were found to be more likely than non-idlers to
- report that in cold weather they idle the engine to keep themselves warm;
- be younger;
- believe that turning a vehicle engine off when parked isn't "right thing to do";
- believe it is easier on a vehicle's starter to let an engine idle.
- believe that for stops of a few minutes, it uses more gas to restart a vehicle than it does to keep it idling; and
- believe that it is good to warm a vehicle engine before driving.
Respondents who weatherized their homes more were also more likely to
- live in an older house that needed to be weatherized;
- have spoken with friends or family about the benefits of weatherization;
- have friends or family who weatherstrip or caulk;
- believe that weatherstripping or caulking is the "right thing to do";
- believe that weatherstripping is easy;
- believe that weatherstripping is good for the environment;
- weatherstrip and caulk to keep cold and drafts out and prevent heat loss;
- report having the time to weather strip and caulk;
- believe that caulking is easy to do; and
- believe that weatherstripping and caulking are inexpensive.
STRATEGIES
Based upon the barriers identified above, community-based social marketing strategies, pilot projects and evaluation mechanisms are presented for the five activities. Estimates on the efficiency of the proposed strategies in helping behaviour change and on the cost to deliver the pilots are provided. Community-based social marketing strategies are emphasized, since the behaviour-change tools used in them have a high likelihood of fostering behaviour change.
Introduction
In Kyoto, Japan, the Government of Canada committed to a substantial reduction in greenhouse gas (GHG) emissions. While fulfilling this commitment involves many changes, shifts in public knowledge, attitudes and behaviour are central to its realization.
The Public Education and Outreach (PEO) Issue Table, as part of the National Climate Change Process, is responsible for identifying how to enhance awareness and foster action among Canadians about climate change. As part of this responsibility, the PEO Issue Table has the mandate to identify barriers to individuals' participation in GHG reduction activities. With this information, social marketing strategies that will motivate voluntary action and lead to behaviour change can be recommended.
In light of the above, the PEO Issue Table issued a Request for Proposals for qualified practitioners to
- review Chapter 3, "Fostering Behaviour Change: An Introduction to Communitybased Social Marketing," of the Public Outreach on Climate Change Foundation Paper and related research, and provide a summary of this information;
- select up to 10 activities for further analysis, in conjunction with Natural Resources Canada, Environment Canada, issue tables (Enhanced Voluntary, Transportation, Buildings and Municipalities), program delivery agents and the steering committee. Give priority to activities with significant emissions reduction potential;
- estimate the energy use and GHG emissions associated with the selected activities;
- use focus groups and telephone surveys to identify barriers to participation in these activities;
- clarify where common barriers exist and explain the need for separate strategies for each activity;
- develop a social marketing strategy for each of the selected activities or set of activities;
- recommend pilot projects with their associated costs to put into practice the proposed strategies; and
- estimate the potential increase in participation for the selected activities and propose how to evaluate the pilots.
Dr. Doug McKenzie-Mohr prepared this report in partnership with LURA Consulting Group and Jay Kassirer (Cullbridge Marketing and Communications).
Methodology
This project began with a review of Chapter 3, "Fostering Behaviour Change: An Introduction to Community-based Social Marketing," of the Public Outreach on Climate Change Foundation Paper and other research on behaviour change. Simultaneously, our project team worked with issue tables (Enhanced Voluntary, Transportation, Buildings, and Municipalities), federal departments, the project advisory committee and program delivery agents to select activities with substantial potential for reducing greenhouse gas (GHG) emissions.
They drew the selected activities from the residential (weatherstripping and caulking, installation of programmable thermostats) and transportation sectors (maintaining tire pressure, reducing car engine idling, purchasing "best-of-class" vehicles). Once they selected the activities, the group found that barriers for two of these activities were already well identified. Hence installing programmable thermostats and purchasing best-of-class vehicles didn't need more barrier research.
Of the remaining activities, the barriers to tire inflation and weatherstripping and caulking were investigated through focus groups. These two activities, plus car idling, were then examined via a telephone survey.
After they identified the barriers to these activities, the project team developed social marketing strategies to overcome them. They also suggested how to pilot and evaluate these strategies. Similarly, the team developed social marketing strategies, pilots and evaluation mechanisms for programmable thermostats and best-of-class vehicle purchases. Finally, for each of the activities, the team estimated the potential increase in participation based upon the proposed strategies and the projected costs to deliver the pilot projects.
Changing Behaviour
Most public sector programs to reduce greenhouse gas (GHG) emissions are information-intensive. These programs, while they promote awareness and attitude change, have less success in changing people's behaviour. An implicit assumption that underlying these programs is that by enhancing knowledge and fostering changes in attitudes, behaviour will also change. But improving knowledge and altering attitudes often have little or no impact upon people's behaviour.
These findings may seem contrary to intuition, as it appears that there ought to be a close relationship between one's knowledge and attitudes, and behaviour. Lack of knowledge and non-supportive attitudes, however, are only two of the barriers that prevent people from engaging in actions that will reduce GHG emissions. The information campaigns frequently fail to foster behaviour change, because people underestimate the difficulty of changing behaviour.1 To build an effective program, it is critical to identify all of the barriers that inhibit the public from engaging in a desired activity and to then design a program that systematically removes them. Community-based social marketing is a promising alternative to information-intensive campaigns. This alternative is based on the following steps:
- Identify barriers to an activity.
- Develop a strategy to surmount the barriers, based on proven behaviour change tools from social science research.
- Pilot the strategy to determine its effectiveness.
- Implement it on a larger scale (if shown effective ) and put mechanisms in place for ongoing evaluation.
Community-based social marketing methods are being used to develop many behaviour change programs for one simple reason – they work. Each of the four steps will be briefly introduced now.
Identifying Barriers
Barriers to an activity can either be internal or external to an individual. For example, lack of knowledge about installing programmable thermostats constitutes an internal barrier, while having few retailers carry them is an external barrier. Research in the social sciences also shows that barriers are activity specific. Identifying these barriers is a critical first step toward creating a useful program, as it is impossible to design an effective program without first knowing what inhibits the public from engaging in the desired activity. While many strategies are used to identify barriers, following are three of the most common:
Literature Review: In order to identify barriers for a specific activity, the process begins with a literature review.2 Because barriers are activity specific, the review must be undertaken at the level of the specific activity being promoted.
Focus Groups: Information gleaned from the literature needs to be augmented with information from the specific community where the program will be conducted. The importance of a perceived barrier may differ markedly from one community to another. Focus groups should be structured around a set of prepared questions that are based upon the results of the literature review.
The strength of conducting focus groups is the in-depth information they offer about the barriers to an emissions reduction activity. However, they have several limitations. Participation rates tend to be low (generally less than 30 percent), which makes it hard to generalize. People who attend a focus group tend to be more interested in the topic than those who don't attend. Hence the focus group doesn't represent the larger community. As well, ideas shared at a focus group can affect one another's opinions, which again limits your ability to generalize the findings. Finally, focus groups obtain qualitative data that, while rich in detail, limit the types of analysis that can be performed on it. Telephone surveys – when conducted in combination with focus groups – offset these limitations.
Telephone Surveys: A variety of methods exist for surveying the public, including mailed surveys, person-to-person interviews and telephone surveys. Telephone surveys, however, are more cost-effective and take less time to complete than person-to-person interviews. Further, telephone surveys have significantly higher participation rates than mailed surveys. Therefore findings are more apt to represent the community. And telephone surveys can obtain quantitative data. This makes the information indispensable in determining perceived barriers to an activity – and their relative importance. Knowing the relative importance of barriers is useful for effectively developing a strategy to target the most important impediments to the desired activity.
Behaviour Change Tools
Social science research identifies many methods (or tools) that are effective in promoting behaviour change. The tools described below are usually put into practice at the community level. They often involve direct interaction, since research shows that behaviour change is most apt to occur in response to personal appeals. Together, the following techniques provide a powerful set of methods to foster behaviour change:
Commitment
When people agree to an initial small request, the probability that they will then participate in a more substantial activity increases dramatically. Obtaining a commitment is found to be effective for two reasons. There is strong pressure in our society for individuals to be consistent, and agreeing to the initial request likely changes the way individuals see themselves. Obtaining a commitment is most effective when public commitments are sought over private commitments (e.g. agreeing to have one's name published in the newspaper for having a home audit). Further, seeking a commitment is useful only for activities in which a person has expressed interest. (Attempts to pressure a person don't work.)
Prompts
A person is unlikely to complete various repetitive activities that promote emissions reductions, such as closing blinds on warm days or turning off an idling engine – for the simple reason that a person forgets. When individuals desire to participate in an activity but don't remember, prompts can be used to promote that behaviour. A prompt is a "visual or auditory aid, which reminds us to carry out an activity that we might otherwise forget." 3 Prompts aren't designed to increase motivation or change attitudes, but rather to remind someone to engage in an action. For example, in one program when cleaning staff left a reminder note on the desks of employees who left their blinds open, the percentage of offices in which people closed blinds jumped from one-tenth to nearly two-thirds.
Prompts are most effectively put in place by using the following guidelines. A prompt is noticeable, clearly indicates what a person has to do (e.g. turn off the lights when leaving a room) and encourages positive actions (e.g. buying energy efficient products, rather than discouraging the purchase of items that are energy inefficient).
Norms
Unlike some areas of sustainable behaviour, such as blue-box recycling, most activities that promote emissions reductions don't carry with them a strong public perception that they are the "right thing to do." Therefore, a new set of norms about the public reducing GHG emissions needs to be developed. Norms are effective when they are noticeable and presented close to when the desired behaviour is to occur (e.g. a sign in a parking lot indicates the number of people who turn off their car engines while waiting).
Incentives
Incentives have a strong impact on individuals' actions. They encourage people to more effectively carry out a behaviour in which they already engaged. Or they encourage people to do an activity that they wouldn't otherwise do.
Communications
Research identifies many elements of effective communications. First, messages communicated take into account the attitudes and beliefs of the audience, in order to be productive. As well, communications are vivid, easily capturing the audience's attention. This is critical since without attention, persuasion is impossible. Communications are more persuasive when delivered by a person or organization seen as credible and when delivered through personal contact. Further, instructions on how to carry out a desired activity are clear and specific, and modelled (e.g. how to install weatherstripping). Remembering what needs to be done and how to do it is easy for the audience. Finally, in order to reinforce and maintain behaviour change, a communications strategy provides feedback about the effectiveness of actions that have been taken.
External Barriers
The above-mentioned tools address possible barriers that are internal to a person. As effective as these tools are, a program succeeds only if significant external barriers are addressed. For example, commitment strategies alone won't convince people to ride the bus if a convenient mass transit system doesn't exist in their community. Because external barriers vary dramatically, program planners must find out the barriers that exist for a particular community and put a program into practice to remove them.
Pilots
Once barriers are identified, consider whether there are enough resources to surmount them. If so, the pilot is put into practice on a small scale to determine its ability to change behaviour and its cost-effectiveness.
Evaluation
Evaluating a strategy once it is broadly carried out is the final step in community-based social marketing. Evaluation provides essential information for refining a program. Further, it can document success and therefore provide the foundation for receiving more funding.
Selected Activities
Overview
While reviewing the behaviour change literature, the project team also worked with Natural Resources Canada, Environment Canada, Issue Tables (Enhanced Voluntary Action, Transportation, Buildings and Municipalities), the project advisory committee and successful program delivery agents. They selected up to 10 activities for further analysis.
As expected, these activities were drawn from the transportation and residential sectors. Once selected, their potential for reducing greenhouse gas (GHG) emissions, where possible, was identified. The project team consulted with Natural Resources Canada and Environment Canada to determine the emissions reduction potential of these activities.
At the same time, the project team identified which activities had already been researched for barriers to their adoption. Our project team reviewed this research and assessed whether, in our opinion, there was enough research to develop sound social marketing strategies without more study. Next, in consultation with the project advisors, three activities were selected for further study.
In selecting the activities, the project team suggested that, in addition to their emissions reduction potential, they be screened for the anticipated ease in overcoming their barriers. For example, modal transportation shifts have substantial opportunity for reducing emissions. But the lack of opportunities in many communities to such shifts (e.g. lack of access to convenient and reliable mass transit) makes it too expensive to deliver viable social marketing programs. In contrast, barriers to activities such as reducing idling or installing more programmable thermostats are likely more easily surmounted.
In summary, the project team suggested that each activity to be studied meet two criteria: (1) the activity has substantial emissions reduction potential and (2) potential barriers to the activity might be easily surmounted, allowing broad adoption of the activity.
Selected Activities
Based upon the above criteria, five activities were selected. In the transportation sector, car engine idling, tire inflation and the purchase of best-of-class vehicles were selected. Enough research existed on best-of-class purchases to develop social marketing strategies As well, previous focus group research on idling didn't need to be replicated. Consequently, tire inflation was studied through focus groups, while tire inflation and car engine idling were investigated in the telephone survey.
In the residential sector, two activities were selected: installation of programmable thermostats and weatherization (weatherstripping and caulking). Programmable thermostats had already been researched enough. Weatherization was explored further through focus groups and the telephone survey. To review the other activities that were considered, see "Activities Table" in the Appendix.
Focus Groups
Overview
Focus groups are an essential element of identifying barriers to behaviour change. Focus groups allow the collection of detailed information about the barriers to an activity. They also allow the development of a more effective telephone survey, as barriers that are identified via focus groups can be incorporated into the survey. On February 16–17, 1999, a series of nine focus groups were held across Canada to evaluate barriers to participation by individuals in greenhouse gas (GHG) reduction activities. Four of the sessions were held in urban areas: Halifax, Nova Scotia; Sainte-Foy, Quebec; Toronto, Ontario; and Calgary (Alberta). Five of the sessions were held in rural areas: Windsor, Nova Scotia; Saint-Antoine-de-Tilly, Quebec; Stayner, Ontario; Nanton, Alberta; and Nelson, British Columbia.
The purpose of the sessions was to investigate participants' knowledge, awareness and attitudes about two specific activities – weatherstripping and caulking, and tire inflation – that individuals can undertake to reduce GHG emissions. The sessions were also designed to gauge participants' awareness and understanding of climate change. Participants for the focus group sessions were selected randomly from local telephone listings. During the recruiting process, two main screening criteria were applied to ensure that participants were well positioned to discuss the activities to be considered. Specifically, participants who drive a vehicle and reside in a "house" (which they own, preferably) were recruited for the meetings. Effort was also made to ensure an equal gender mix, as well as a mix of ages over 19.
Highlights
Weatherstripping and Caulking
All of the urban and rural participants have used weatherstripping, caulking or other materials to prevent drafts in their homes. The main motivations for engaging in these activities are to save money on heating bills and improve the comfort of their homes. The main barriers to engaging in these activities include the perception that they aren't necessary (for various reasons) and lack of time. Both rural and urban participants were split on the value of producing a video on how to use weatherstripping and caulking.
Tire Pressure
Most participants in both urban and rural areas check their tire pressure. However, women in both urban and rural areas tend to check their tire pressure less frequently and often rely on their husbands to do so. The main motivations for checking tire pressure are safety, to reduce tire wear and to improve mileage. Participants noted that the main reasons they didn't check their tire pressure regularly, or check it at all, included that they don't think about it and they are concerned about the accuracy of pumps and gauges. Both urban and rural participants felt it would be useful for a gas station employee to prompt them to check their tire pressure. However, while most urban participants felt it would be useful for the employee to show them how to use a tire gauge, most rural participants didn't.
Awareness and Understanding of Climate Change
The majority of participants in both urban and rural areas have heard of climate change. However, in Quebec, participants refer to climate change as "global warming" (réchauffement de la planète). Participants described climate change in various ways, with the most common causes being ozone depletion and the greenhouse effect. With the exception of those in Quebec, most participants in both urban and rural areas felt that they would be affected by climate change. Again, with the exception of those in Quebec, most participants in both urban and rural areas felt that individuals could take action on the issue of climate change.
More detailed results from the focus group sessions are provided in the following tables.
| URBAN SESSIONS | ||||
| Location | Participation | Motivations | Barriers |
Social Marketing Considerations |
|---|---|---|---|---|
| Halifax, Nova Scotia (n = 9) Note: One participant was late and was introduced into the focus group at the social marketing questions | All participants had taken some preventative measures to combat drafts and air leakage (8) |
To prevent or eliminate drafts and keep heating costs low (8) To keep moisture out (3) |
Require either help or more information (4) |
Most participants had family or friends who had engaged in weatherstripping and/or aulking, and had discussed these activities with them (5) Most participants wouldn’t find it useful to view a video on how to use weatherstripping, caulking or other materials to reduce drafts and wouldn’t watch such a video if it was shown on cable television (5) If a video was produced, the delivery would be very important – should be step-by-step (6) Some participants would appreciate receiving a pamphlet on weatherstripping and/or caulking (2) |
| Sainte-Foy, Quebec (n =10) |
All but one participant had taken some preventative measures to combat drafts and air leakage Most respondents seal their windows with temporary plastic sheets every fall (9) They weatherstrip and caulk on a less regular basis (4) |
For comfort To reduce drafts and prevent cold air from coming in the house (3) To keep the house warm and comfortable (2) To prevent humidity, water, ice and mildew on the windows (3) To reduce heating bills and save energy (3) In old houses, windows aren't efficient, and it is less expensive to use plastic than change windows (1) |
Don't see a need to do it - already have good quality windows (2) Lack of time (1) Too complicated (1) Need information about the kinds of materials available, the quality of specific brands of products and the easiest ways to save energy |
All of the participants knew family members or friends who had used weatherstripping and caulking (10) Sealing windows to reduce drafts is a fall tradition in Quebec. Most people do it, and it is considered normal. However, it isn't something people usually talk about with their neighbours Participants wouldn't find it useful to view a video on how to use weatherstripping, caulking or other materials to reduce drafts (10) Hydro-Québec has been providing clients with "how to" information for many years and has used television as key communications vehicle - now the need is for information on "What to do" and "Why to do it" |
| Toronto, Ontario (n = 6) |
All participants had used weatherstripping, caulking or other materials on the inside of their homes to reduce drafts and stop air leakage (6) Half of the participants engaged in these activities on a regular basis (3) |
To save money on heating bill (4) For comfort - To keep the cold and drafts out (4) To save energy (2) |
Lack of time (1) |
All of the participants had family or friends who had engaged in weatherstripping and/or caulking, and had discussed the activities with them (6) All of the participants would find it useful to view a video on weatherstripping and caulking (6), although only a minority would watch such a video if it was shown on the local cable station (2) |
| Calgary, Alberta (n = 9) |
All but one participant had used weatherstripping, caulking or other materials on the inside of their homes to reduce drafts and stop air leakage (8) The majority engaged in these activities on a regular basis (5) |
To save money (8) Family member has asthma so there is a need to keep the furnace low (1) |
Lack of time (8) |
discussed weatherstripping and/or caulking with family or friends (1) A majority of participants would find it useful to view a video on weatherstripping and caulking, and would watch such a video if it was shown on the local cable station (8) One participant also mentioned books and the Internet as very useful resources (1) |
| Rural Sessions | ||||
| Windsor, Nova Scotia (n = 7) |
All but one participant had used weatherstripping, caulking or other materials on the inside of their homes to reduce drafts and stop air leakage (6) The majority engaged in these activities on a regular basis (5) |
To reduce or prevent drafts (6) To lower heating bills (6) |
Don't see a need to do it - live in a new home (1) |
A minority of participants had discussed the activity with their family or friends (2) A small majority of participants would find it useful to view a video on weatherstripping and caulking (4), but a minority would watch such a video if it was shown on the local cable station (3) Participants felt the video would be more useful if shown at a hardware store while people were picking out supplies (4) or shown on the day someone was weatherproofing his/her house (1) |
| Saint-Antoinede-Tilly, Quebec (n = 10) |
The majority of participants had used weatherstripping, caulking or other materials on the inside of their homes to reduce drafts and stop air leakage (8) The majority engaged in these activities on a regular basis (5) |
For comfort To reduce drafts and prevent cold air from coming in the house (5) To keep the house warm and comfortable (2) To reduce heating bills and save energy (6) To prevent humidity, water, ice and mildew on the windows (2) The age of the house, doors and windows is an important |
Don't see a need to do it (2) - Live in a new home - Have good quality windows - Have a de-humidifier, so humidity in windows isn't a problem Lack of time (1) |
A minority of the participants (4) had family or friends who had engaged in weatherstripping and/or caulking, and it isn't something they usually talk about with their neighbours None of the participants would find it useful to view a video on weatherstripping and caulking, nor would they make an effort to watch such a video if it was shown on the local cable station Half of the participants considered the video a waste of money (5) |
| Stayner, Ontario (n = 10) |
All participants had used weatherstripping, caulking or other materials on the inside of their homes to reduce drafts and stop air leakage (10) The majority of participants engaged in these activities on a regular basis (8) |
To save money on heating bills (7) Comfort - To keep the cold and drafts out (7) For maintenance purposes (3) Appearance (2) |
None stated |
While all of the participants had family or friends who had engaged in weatherstripping and/or caulking, just over half of them had discussed these activities with their family and friends (6) The majority of participants wouldn't find it useful to view a video on weatherstripping and caulking (8), and wouldn't watch such a video if it was shown on the local cable station (6) because they already know how to do these activities |
| Nanton, Alberta (n = 9) |
All of the participants had used weatherstripping, caulking or other materials on the inside of their homes to reduce drafts and stop air leakage (10) The majority of the participants engaged in these activities on a regular basis (8) |
To save money on heating bills (8) Comfort - To keep cold and drafts out (4) To cut down on gas emissions (1) |
None stated |
All of the participants had family or friends who had engaged in weatherstripping and/or caulking, and had discussed these activities with them (10) Half of the participants would find it useful to view a video on weatherstripping and caulking (5), but other resources - such as books, the Internet, the radio and word-ofmouth - would be useful |
| Nelson, British Columbia (n = 10) |
The majority of participants had used weatherstripping, caulking or other materials on the inside of their homes to reduce drafts and stop air leakage (8) The majority of participants engaged in these activities on a regular basis (5) |
To save money on heating bills (6) Comfort - To stop drafts (2) To stop heat from leaking out of the house (1) Helps to waterproof the house and reduce wood rot(1) Caulking is easy and efficient (1) |
Don't see a need to do it - house is new (1) |
A majority of participants had family or friends who had engaged in weatherstripping and/or caulking (6), and had discussed these activities with them (4) A majority of participants would find it useful to view a video on weatherstripping and caulking (8) However, a majority of participants said they wouldn't watch such a video if it was shown on cable TV (7) for two main reasons - no cable subscription and concerns that the video would be too generic and wouldn't answer project-specific questions Participants identified the distribution of a free video at local hardware stores,, as preferable to airing a video on cable TV |
| Location | Participation | Motivations | Barriers |
Social Marketing Considerations |
|---|---|---|---|---|
| Urban Sessions | ||||
| Halifax, Nova Scotia (n = 9) |
Half of the participants have their tire pressure checked regularly (4) Half of the participants check their tire pressure infrequently (5) |
Car doesn't feel right when participants are driving (4) When carrying heavy loads (1) When going on a long trip (1) |
Don't think of checking the tire pressure (2) Don't trust the settings on the pump (2) Doubt the accuracy of the old pump gauges (1) Confuse kilopascal (kPa) and pounds per square inch (psi)(2) Bad experience - used a pump that had no gauge and the tire blew (1) |
Most participants felt hat they knew how to check tire pressure and what the proper tire pressure should be (6) Most participants owned a tire gauge (6) Most participants are in contact with attendants while visiting a service station (8) All participants thought it would be useful if service station attendants prompted drivers to check their tire pressure (9) Most participants thought it would be useful for gas station employees to show drivers how to check their tire pressure (6) A free tire gauge would be a good incentive to learn how to check tires (3) |
| Sainte-Foy, Quebec (n = 10) | The women in this focus group rarely check the tire pressure of their vehicles themselves - their husbands usually do it. Most of the men check their tire pressure once in a while |
For better driving conditions (5) - For better adherence to the road (2) For driving safety (5) To prevent tires from wearing quickly (5) To save gas (3) To prevent flat tires (1) |
Husbands do it for participants (3) Participant does visual checks only, which is enough (1) Has no idea why tire pressure needs top be checked (1) |
The women in the group were less informed about how to check tire pressure (2) and how much pressure is needed (4), although they could check tire pressure if they were shown how Most participants owned a tire gauge (9) Participants go to self-service stations for gas and don't feel they really interact with employees (10) However, participants would find it useful if gas stations had tire gauges that drivers could use to check their tire pressure (10) Participants would find it useful if a gas station employee prompted drivers to check their tire pressure (7) |
| Toronto, Ontario (n = 6) |
All participants check their tire pressure (6) The majority of participants don't check tire pressure on a regular basis (4) |
Safety (6) Comfort of ride (1) |
Tire pressure gauges don't always work properly (2) Air pumps don't always work at the gas stations (1) New air pumps don't work as well as the old ones where you used the dial to set the pressure (1) Trucks sometimes park in front of the air pumps so others can't access them (1) Lack of uniformity among air pumps at different gas stations (1) Having to pay a quarter to use the air pump at some gas stations (1) Sometimes it is hard to determine the correct pressure to inflate the tires because the number wears off the side of it or you lose your car manual (1) Air pumps and tire gauges are in metric units, but the tire and car manuals specify the amount of pressure in imperial units (1) Concern that the tire gauge may release air when participant is trying to check the tire pressure (1) |
All participants felt that they knew how to check tire pressure and what the proper tire pressure should be (6) Half of the participants own a tire gauge (3) Participants who don't own a tire gauge know where to purchase one (3) Most participants are in contact with attendants while visiting a service station (5), although only one participant thought it would be useful if the attendant prompted drivers to check tire pressure (1) Snappy graphics or a sign would be more useful prompts (1) A majority of participants would find it useful for gas stations to provide tire gauges for drivers to use (5), but only half felt it would be useful for a gas station employee to show you drivers how to check their tire pressure (3) |
| Calgary, Alberta (n = 9) | Most participants don't check their tire pressure on a regular basis |
Handling and the look of the tires (4) To ensure upkeep on tires (2) Part of a regular oil check (2) Habit (4) Safety - participants check tires before long trips and in the winter (3) |
Don't think of doing it unless something is noticeably wrong (5) Don't know how to use a tire gauge (1) Some tire pressure gauges at gas stations are inaccurate (2) |
All participants felt that they knew how to check tire pressure (9) The majority knew, or would know how to find out, what the proper tire pressure should be (7) Most participants owned a tire gauge (7) Participants who didn't own a tire gauge would know where to get one (2) A minority of participants are in contact with attendants while visiting a service station (4) However, all participants would find it useful if the attendant prompted drivers to check their tire pressure (9) A majority of participants would also find it helpful if gas station employees would show drivers how to check their tire pressure (8) |
| Rural Sessions | ||||
| Windsor, Nova Scotia (n = 9) |
Most participants check their tire pressure (6) Half of the participants who check their tire pressure do so infrequently (3) |
To be proactive (1) Better gas mileage (4) Less wear on tires (4) Better handling and steering (4) Safety (1) |
Don't think of it (4) Twice a year is enough (1) |
The majority of participants felt that they knew how to check tire pressure (5), but only a minority knew, or would know how to find out, what the proper tire pressure should be (3) Most participants owned a tire gauge (4), while those who didn't would know where to get one (3) All participants have contact with attendants while visiting a service station (7) All participants would find it useful if the attendant prompted drivers to check their tire pressure (7) The majority of participants wouldn't find it useful for the gas station employee to show drivers how to check their tire pressure (6), nor would it be helpful for the gas station to have tire gauges available for use (5) |
| Saint-Antoinede-Tilly, Quebec (n = 10) | The majority of participants check their tire pressure (7) The women in this group rarely check the tire pressure of their vehicles themselves - their husbands usually take care of it or the women have their tires checked at a service station | Safety (5) Less wear on tires (5) Better handling and steering (3) Better gas mileage (1) | Belief that tire quality is better today, so you don't have to check tire pressure as much as you used to (3) | The majority of participants felt they knew how to check tire pressure and what the proper tire pressure should be (7), although the women were less informed than the men Most participants owned a tire gauge (6), and those who didn't would know where to get one (4) All participants have contact with attendants while visiting a service station (10) A majority of participants thought it would be useful if the attendant prompted drivers to check their tire pressure (8) Only a minority of participants thought it useful for the gas station employee to show drivers how to check their tire pressure (2) |
| Stayner, Ontario (n = 10) | The majority of participants regularly check the tire pressure on their vehicles (8) The participants who never or only sometimes check their tire pressure were both female | To prevent unnecessary tire wear (6) Safety (4) To improve fuel economy (1) | Don't drive very often (1) | The majority of participants felt they knew how to check tire pressure (8) and what the proper tire pressure should be (7) Most participants owned a tire gauge (7), and those who didn't would know where to get one (3) Most participants have contact with attendants while visiting a service station (8) A majority of participants would find it useful if the attendant prompted drivers to check their tire pressure (7) Only a minority of participants felt that it would be useful for the gas station employee to show drivers how to check their tire pressure (1) However, most participants thought it would be helpful for the gas station to have tire gauges available for use (6) |
| Nanton, Alberta (n = 9) | Participants are quite familiar with checking tire pressure, due to the businesses they are in In rural Alberta, 18-wheel vehicles are common and longevity of tire life and safety are a big issue in their lines of work | Safety (4) Better mileage (4) To prevent unnecessary tire wear (4) | Don't think of it (1) | All participants felt they knew how to check tire pressure and what the proper tire pressure should be (8). All participants owned a tire gauge (8). Most participants have contact with attendants while visiting a service station (7) A majority thought it would be useful if the attendants prompted drivers to check their tire pressure (8) All participants felt that it would be useful for the gas station employee to show drivers how to check their tire pressure (8) However, only a minority of participants thought it would be helpful for the gas station to have tire gauges available for use (2) |
| Nelson, British Columbia (n = 10) | All participants check the tire pressure regularly (8) or sometimes (2) In all but one case (where the participant's husband takes responsibility for tire pressure), the participants, regardless of gender, check the tire pressure themselves | Better mileage (7) Prevent unnecessary tire wear and avoid buying new tires (4) Vehicle handling (5) Extend the life of the vehicle (3) Safety (2) Avoid blowing a tire (2) Improve traction for off-roading (i.e. driving over rough terrain) (1) | None stated | The majority of participants felt that they knew how check tire pressure (9) and what the proper tire pressure should be (8) Most participants owned a tire gauge (9) and those who don't would know where to get one (1) Most participants have contact with service station attendants while visiting a service station (9) Most participants thought it would be useful if the attendant prompted drivers to check their tire pressure (6) Half of the participants felt that it would be useful for the gas station employee to show drivers how to check their tire pressure (5) However, a majority of participants thought it would be helpful for the gas station to have tire gauges available for use (9) |
| Location | Participation | Motivations | Barriers |
Social Marketing Considerations |
|---|---|---|---|---|
| URBAN SESSIONS | ||||
| Halifax, Nova Scotia (n = 9) | All of the participants had heard about the topic of climate change (8) | Participants described climate change in various ways, most commonly as a problem caused by humanity (2) relating to greenhouse gases, ozone depletion and ultraviolet rays (2) Most participant expressed concern about climate change | Participants felt there will be impacts to - Children (1) - Outdoor workers (1) - Hardware stores (1) - Farms and agriculture (5) | Most participants felt that individuals can take action on this issue (8). They identified various actions, most commonly - Use public transportation - more buses, fewer highways (2) - Use less fossil fuels by walking, hanging clothes to dry, riding bikes instead of driving (2) - Lobby politicians (2) - Recycle and reuse (3) |
| Sainte-Foy, Quebec (n = 10) | None of the participants had heard about the topic of climate change. All had heard of global warming (réchauffement de la planète) (10) | Participants described climate change in various ways, most commonly as - Ozone layer (5) - Skin protection (3) Most participants expressed concern about climate change | Most participants felt there will be impacts in the community - Skin cancer (4) - Winter will be shorter, seasons will change (3) - All nature will change, people will experience greater impacts than they think (2) Some participants felt that the local community will not be affected - Minimal effects, nothing terrible (2) - It will take many generations before there are any real impacts in Quebec (1) | Many participants thought that they can't, as individuals, do much about climate change (7), and the responsibility of big business is their major concern Participants who felt that individuals can take action on this issue (3) most commonly cited - Recycle (3) - Teach children to respect the planet (2) - Reduce the use of polluting materials (2) |
| Toronto, Ontario (n = 6) | All of the participants had heard about the topic of climate change (6) | Participants described climate change in various ways, most commonly as - Greenhouse effect (4) - Ozone depletion (4) - Global warming (3) Most participants expressed concern about climate change | The majority of participants felt that they would be affected by climate change (5) Affects everyone, global impacts (3) Will affect a large number of communities, not just one defined area (1) | All of the participants felt that individuals could do something about climate change (6), most commonly - Make smarter consumer choices (3) - Plant trees (2) - Reduce the dependence on automobiles (2) |
| Calgary, Alberta (n = 9) | All of the participants had heard about the topic of climate change (9) | Participants described climate change as - Global warming (5) - Loss of the ozone layer (2) - Pollution (2) Most participants expressed concern about climate change | Participants felt there would be impacts to - Health (2) - Water levels (1) - Our food and lifestyle (2) - Wildlife migration patterns (2) - Seasonal weather patterns (2) Some participants were very concerned about impacts on future generations (3) | All of the participants felt that individuals could do something about climate change (6), most commonly - Recycle (5) - Take the bus instead of the car (2) - Check vehicle emissions and use higher-octane gas (2) All participants would like to see big business and factories look at options on cutting down their impact on climate change and on the environment (9) |
| RURAL SESSIONS | ||||
| Windsor, Nova Scotia (n = 7) | All of the participants had heard about the topic of "climate change" (7). | Participants described climate change in various ways, most commonly as - Changes in seasonal temperatures (6) - Loss of the ozone layer (3) - Milder winters (3) Most participants expressed concern about climate change | The majority of participants felt that they will be affected by climate change (6) Participants felt there would be impacts to - The ski hill (2) - Farmers and apple orchards (2) - Snowplough drivers and the hardware stores (1) One participant noted that there will be global Impacts as well (1) | All of the participants felt that individuals could do something about climate change (7), most commonly - Control pollution (4) - Burn less fossil fuels by car pooling and taking buses (3) - Replant trees and greenery (2) |
| Saint-Antoinede-Tilly, Quebec (n = 10) | None of the participants had heard about the topic of climate change. All had heard of global warming (réchauffement de la planète) (10) | Participants described climate change in various ways, most commonly as - Changes in seasons and temperatures (4) - Warmer winters and temperatures (2) | All participants felt that they will be affected by climate change (10) Half of the participants could identify some potential impacts (5) Participants felt there will be - Changes in the seasons (3) - Abnormal temperature changes (2) - An increase in storm occurrences (2) | Only a minority of participants felt that individuals could do something about climate change (3), most commonly - Check the air pressure in automobile tires (6) - Teach children about the issue (3) - Recycle (3) Many respondents felt that big business and governments (including municipalities) have a larger role to play in preventing climate change |
| Stayner, Ontario (n = 10) | All of the participants had heard about the topic of climate change (10) | Participants described climate change in various ways, most commonly as - Strange and/or different weather patterns (3) - Global warming (2) - Greenhouse effect (2) - Unpredictable weather (2) - Warmer weather (2) Most participants expressedconcern about climate change | Most participants felt that they would be affected by climate change (8) Participants felt there would be - Affects on all areas of life - the mind, body and soul (1) - Impacts on farmers (1) - Economic implications (1) Some participant also noted that there will be global impacts(3) | A majority of participants felt that individuals could do something about climate change (9), most commonly - Recycle (6) - Use car pools (5) - Use economic incentives for behaviour change (2) Participants noted that it is important for everyone to take action, including the government and industry (3) Participants also noted that it is important to develop new technologies (2) |
| Nanton, Alberta (n = 9) | All of the participants had heardabout the topic of climate change (8) | Participants noted that, between the TV and radio, they have heard numerous and sometimes conflicting theories on climatechange Participants noted that agriculture, deforestation, soils, farming and global carbon cycles are all a part of climate change (3) | Most participants felt that they will be affected by climate change (7) | A majority of participants felt that individuals could do something about climate change (8) and cited a variety of actions Participants noted that it is important that everyone needs to take action, including the government and industry (2) Participants felt that there were no incentives in place to encourage individuals to take action on climate change (8) |
| Nelson, British Columbia (n = 10) | All of the participants had heard about the topic of climate change (10) | Participants described climate change in various ways, most commonly as changing weather patterns (5) Most participants expressed concern about climate change | All participants felt that they will be affected by climate change (10) | The majority of participants indicated that climate change can be affected by individual action (8), but few participants could identify specific actions that people could take within the home or locally Participants identified education on the issue as a priority (4). Participants noted that it is important that everyone needs to take action, including the government and industry (4) |
Telephone Survey
Overview
Focus groups allow you to collect detailed information about the barriers to activities. However, they have two significant limitations. First, focus groups are limited to the extent to which you can generalize their results to the community at large. Your ability to generalize is restricted by the small number of participants and the difficulty of obtaining high participation rates (i.e. few individuals are willing to give up two hours of their time to participate in a focus group, even though they are paid to participate). As a result, participants tend to be more interested in the topic than the general population. Second, the qualitative nature of the data you obtain from focus groups doesn't allow for the use of statistics that can identify and prioritize barriers to an activity. Due to these limitations, this project used focus groups in tandem with a telephone survey. With the information obtained from a telephone survey, you can generalize to the wider population and conduct quantitative analyses to identify barriers. The strengths of each approach compensate for the weaknesses of the other. Research House conducted the survey in English and French. The firm used two criteria to screen respondents: they had to live in a house and drive a vehicle. The incidence of respondents who met both criteria was 72 percent. In total, the firm surveyed 1031 Canadian adults. It stratified the sample by region (British Columbia, the Prairies, Ontario, Quebec and the Maritimes) and by rural versus urban setting. Results from this survey can be considered accurate within plus or minus four percent, 19 times out of 20. The stratification of the survey is provided in the following table.
| Maritimes | Quebec | Ontario | Prairies | British Columbia |
Total number of participants |
Percent | |
|---|---|---|---|---|---|---|---|
| Urban | 40 | 185 | 295 | 117 | 92 | 729 | 71% |
| Rural | 50 | 80 | 83 | 60 | 29 | 302 | 29% |
| Total | 90 | 265 | 378 | 177 | 121 | 1031 | 100% |
Tire Pressure
The telephone survey addressed three activities: tire pressure, idling car engines and weatherizing homes. In addition, respondents were asked about their perceptions of the impact climate change will have upon their communities and their levels of knowledge on this issue. The survey began with tire pressure.
Frequency of Checking Tire Pressure
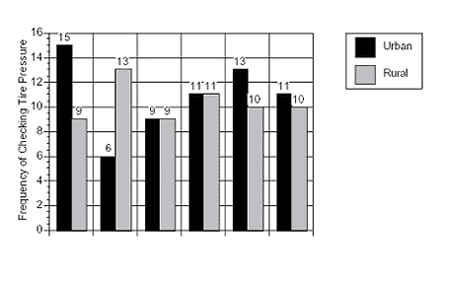
Fully 94 percent of respondents reported checking their tire pressure in the past year. On average, they checked their tires 10 times a year. Men reported checking their tire pressure 11 times a year, compared with 8 times for women. On average, urban and rural participants reported similar frequencies of checking (as you can seen in the following chart). However, regional differences exist.4 In the Maritimes and British Columbia, urban respondents reported a higher frequency of checking. This trend was reversed in Quebec. Meanwhile, in Ontario and the Prairies, urban and rural respondents didn't differ.
Who Checks Tire Pressure?
As you can see below, 55 percent of respondents reported checking their own tire pressure. However, this average obscures significant gender differences. Threequarters of the men indicated that they checked their tires, while only 30 percent of the women did. Not surprisingly, given this marked difference, women were far more likely to report that others checked their tires for them. Fully 40 percent of the women reported that a spouse or partner checked their tires, compared with 2 percent for the men. Similarly, women reported that a gas station attendant (14 percent) or family member (6 percent) checked their tires for them, compared with 7 percent and 1 percent, respectively, for men.
These gender differences have important implications for developing social marketing strategies to promote checking tire pressure. (These and other implications of the survey will be discussed later in this report when the social marketing strategies and pilots are introduced). Finally, men and women were equally likely to report that a mechanic checked their tire pressure (19 percent), probably because this is often a regular part of having a car serviced.
Barriers to Checking Tire Pressure
In order to develop an effective social marketing strategy to promote checking tire pressure, it is critical to first identify barriers to this activity. To do this, respondents were divided into three groups based on who had checked their tires at low, moderate or high levels of frequency over the past year:
- Low Frequency (three or fewer times): 333 respondents
- Moderate Frequency (four to six times): 325 respondents
- High Frequency (seven or more times): 373 respondents
To identify barriers to checking tire pressure, select respondents who differ as much as possible about the frequency with which they check their tires. Accordingly, respondents who checked their tires with moderate frequency were removed from the following analysis (they are included, however, in other analyses reported in this section). In order of importance, the following factors were found to distinguish low- and high-frequency checking. Frequent checkers were found to be more likely than infrequent checkers to
- remember to check their tire pressure;
- have a tire gauge (86 percent versus 64 percent);
- report knowing their correct tire pressure;
- report knowing how to check their tires' pressure;
- report knowing how to use an air pump;
- report greater motivation to avoid unnecessary tire wear; and
- be men.
These seven factors form the basis of the social marketing strategy set out in the next section of this report. Note that these factors emerged from a larger set of potential distinguishing items. For example, except for gender, none of the demographic factors were found to be important – i.e. age, income, education, language or urban versus rural setting. Further, none of the following factors emerged as important in distinguishing high- and low-frequency checking:
- Motivated by driving safety;
- Motivated by comfort of ride;
- Motivated by increased fuel efficiency and/or saving money;
- Belief that tire checking is good for the environment;
- Concerns about the accuracy of air pumps;
- Having access to a gas station with a working air pump;
- Worries about releasing air from tires;
- Having friends or family who check their tires; and
- Having to pay to use an air pump (see discussion below on regional differences about the likelihood of this).
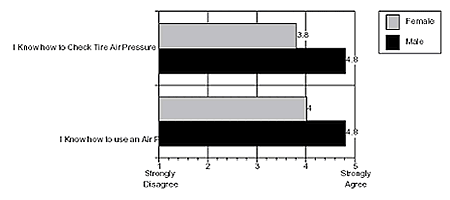
The above analyses underscore that knowledge (knowing correct tire pressure and how to use a tire gauge and air pump) is one of the critical determinants of frequent tire checking. Significant differences exist between men and women about this knowledge. As you can see below, women were less likely than men to agree that they knew how to check tire pressure and use an air pump. Further, women were substantially less likely to report knowing the air pressure of their tires (53 percent) than were men (91 percent). Additional analyses revealed that these findings were especially true for women who checked their tires infrequently.
Motivations for Maintaining Proper Tire Pressure
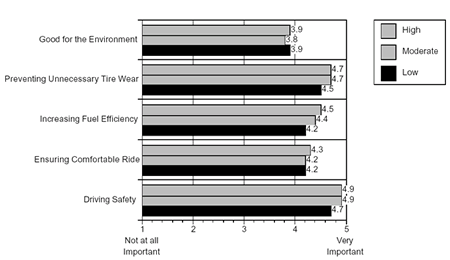
Identifying the barriers that inhibit people from checking their tires frequently is a critical aspect of developing an effective community-based social marketing strategy. However, you also need to identify motivations for checking tire pressure. Individuals who differ in how often they check their tires may, nonetheless, share similar motivations for checking tire pressure (motivations also shared by high- and low-frequency respondents who didn't emerge in the analyses reported above). Accordingly, respondents were asked to rate the importance of five motivations for maintaining tire pressure. As you can see in the following chart, they rated driving safety as the most important reason for maintaining proper tire pressure. In descending order of importance, this was followed by preventing unnecessary tire wear, increasing fuel efficiency, ensuring a comfortable ride and being good for the environment.
Social Marketing Strategies
The survey provides further information on possible social marketing strategies. Respondents were asked to indicate their support for having gas stations provide tire gauges and having an attendant check tire pressure or remind motorists to check their tires.
PROVIDING TIRE GAUGES
Not surprisingly, respondents who didn't have a tire gauge were more likely to agree that it would be helpful if gas stations provided one.
ATTENDANT CHECKS TIRE PRESSURE
Women were less likely than men to check their tire pressure and, when they do, were more likely to have someone else check for them. This finding suggests that it will be particularly attractive to women if gas stations provided the service of periodically checking tire pressure. To test this possibility, respondents were asked the extent to which they agreed with the statement, "I would find it helpful if gas station employees occasionally checked my air pressure when I was getting gas." As demonstrated in the following chart, more women across all three levels of frequency of checking preferred this service than their male counterparts. Further, women who checked their tires least frequently viewed this service as especially desirable. Additional analyses revealed that, independent of gender, respondents who checked their tires less frequently supported this potential service more.
ATTENDANT REMINDS DRIVERS TO CHECK TIRE PRESSURE
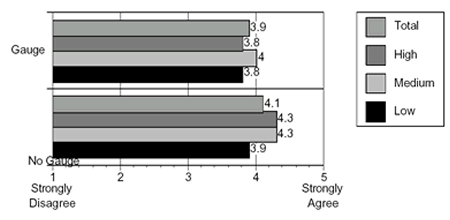
It is likely that many people simply forget to check their tire pressure. Having gas station employees remind them to check it is one easy way to overcome this forgetting. Respondents were asked the extent to which they agreed with the following statement, "I would find it helpful if gas station employees reminded me to check the air pressure of my tires." As you can see in the following chart, women reported stronger agreement with this statement (3.8) overall than did men (3.3). Further, women who checked their tires the least were most likely to support this service. Similar support was found for posting signs at gas stations, reminding motorists to check their tires.
CHARGE FOR USING AN AIR PUMP
Finally, significant regional differences existed in whether Canadians likely had to pay to inflate their tires. As you can see in the table below, respondents from Quebec and Ontario were far more likely to be charged to use an air pump than residents who lived elsewhere.
| Maritimes | Quebec | Ontario | Prairies | British Columbia | Percent | |
|---|---|---|---|---|---|---|
| Urban | 0% | 14% | 26% | 1% | 0% | 14% |
| Rural | 4 | 8 | 14 | 2 | 0 | 7% |
| Total | 2 | 12 | 24 | 1 | 0 | 12% |
Vehicle Engine Idling
Following the inquiries about tire pressure, respondents were asked various questions to determine perceived barriers and motivations to turning off idling vehicle engines. As with tire pressure, frequency of idling is presented first, followed by information on who engaged in the activity and finally, barriers and motivators for reducing idling.
Frequency of Idling Vehicle Engines
Fully 60 percent of respondents reported warming their car engine in the last week before driving it. On average, respondents idled their vehicle engines 4.2 times during the previous week. (When you exclude respondents who didn't idle their vehicle, this average rises to 7 times in the previous week).6 Overall, rural participants reported idling their engines more frequently (5.1) than urban respondents (3.8) over the last week. Except for the Maritimes, all other regions of the country had rural respondents idling their engines more often than their urban counterparts. In Quebec, rural respondents reported idling their engines significantly more than did urban respondents.
Respondents were also asked, "Thinking of those occasions, on average how long do you think you idled the engine for?" These time estimates were multiplied by the number of times the respondents had reported idling their cars in the previous week, to produce the following chart. On average, respondents idled their engines for 26 minutes the previous week. However, significant variability exists across Canada. Overall, rural respondents reported idling their engines for longer (35 minutes) than did urban respondents (22 minutes). In Quebec and the Prairies, rural residents reported idling their engines more than twice as long as did their urban counterparts.
6 Respondents who did not idle their engines are included in this and the other averages that are reported in this section. Removing these respondents would have decreased the sample size significantly enough that regional data couldn't have been presented.
Moreover, respondents were asked how many times during the last week did they think they had left their engines running while waiting in their vehicles. In total, 39 percent of respondents reported idling their engines in this situation. On average, respondents left their engines running 2.5 times in the previous week. (When you exclude respondents who didn't idle while waiting, the number of times per week rises to 6.5). As you can see in the following chart, substantial variations exist in these reports.
In producing the following chart, the number of times that respondents reported idling while waiting in their vehicles was multiplied by their estimate of how long, on average, they idled.
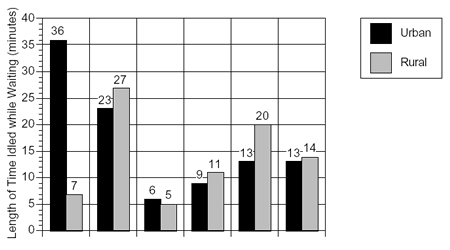
On average, respondents reported idling their cars for 13 minutes during the previous week. Overall, urban respondents reported that they idled their vehicles an average of 13 minutes while waiting, and rural respondents reported idling for 14 minutes. As with tire pressure, you should place more confidence in overall urban versus rural comparisons, than in regional comparisons.
Who Idles?
Frequency of idling an engine, both before driving and while waiting in a vehicle, wasn't related to gender, income or year of car model. Younger respondents were more likely to idle. And education level was linked to idling before driving – respondents with lower levels of education were more likely to idle. But no relationship was found between education level and idling while waiting in the vehicle.
Barriers to Reducing Idling Before Driving
As with checking tire pressure, respondents who idled their vehicles' engines to warm them up were divided into three groups. These groups were based upon the length of time the respondents had idled their vehicle over the previous week:7
- Low Duration (0 minutes): 11 respondents
- Moderate Duration (between 0 and 9.4 minutes): 160 respondents
- High Duration (9.5 or more minutes): 452 respondents
Respondents who idled their cars at a moderate level were removed from the following analysis (they are included in other analyses reported in this section). In descending order of importance, the following factors were found to distinguish low- and highduration idling. High-duration idlers were more likely than low-duration idlers to
- believe that it is good to warm a vehicle engine before driving;
- be younger;
- report that they idled the engine to keep themselves warm;
- believe that idling an engine doesn't use as much fuel as restarting;
- have a lower level of education;
- believe that idling doesn't produce unnecessary pollution; and
- believe it is easier on a vehicle's starter to let an engine idle.
These seven factors form the basis of the social marketing strategy for idling that is set out in the next section of this report. As with tire pressure, these factors emerged from a large set of potential barriers. For example, except for age and education, none of the other demographic factors were found to be important (i.e. gender, income, language or urban versus rural setting). Further, the following factors didn't distinguish high- and low-duration idling:
- a belief that turning off a vehicle engine saves significantly on gasoline costs;
- a belief that turning a vehicle engine off when parked is the "right thing to do"; and
- having friends or family who turn their vehicle engines off while parked.
7 Since 40 percent of the respondents reported that they hadn't idled their car to warm it, it was impossible to create three equal groups (e.g. 33 percent in each group). Accordingly, the low- and high idling groups were made as equivalent as possible for this analysis.
Barriers to Reducing Idling While Waiting in Vehicles
Respondents who idled their engines while waiting in vehicles were divided into two groups – idlers and non-idlers. Only two meaningful groups could be formed because 60 percent of respondents hadn't idled their vehicle while waiting during the previous week. These groups were based on the length of time the respondent had idled the engine over the previous week while waiting in the vehicle.8
- Non-idlers (0 minute): 627 respondents
- Idlers (between 0 and 9.4 minutes): 392 respondents
Idlers were more likely than non-idlers to
8Since 60 percent of respondents reported that they hadn't idled their vehicle while waiting, only two
- report that in cold weather, they idled the engine to keep themselves warm;
- be younger;
- believe that turning a vehicle engine off when parked isn't the "right thing to do";
- believe it is easier on a vehicle's starter to let an engine idle.
- believe that for stops of a few minutes, it takes more gas to restart a vehicle than to keep it idling; and
- believe that it is good to warm a vehicle engine before driving.
These six factors form the basis of the social marketing strategy for reducing "idling while waiting," which is set out in the next section of this report. As with idling an engine before driving, these factors emerged from a large number of potential barriers.
Motivations for Reducing Idling
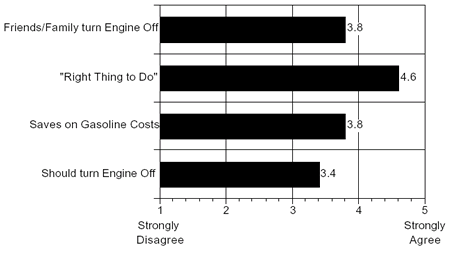
Identifying the barriers that inhibit people from turning off their vehicles' engines is critical in developing an effective community-based social marketing strategy. Likewise, it is also important to identify motivations for turning engines off. Accordingly, respondents were asked to rate the importance of several motivations for turning off their engines. As you can see in the following chart, believing that turning your vehicle's engine off while parked is the "right thing to do" received strong agreement. In descending order of importance, this was followed by
- Friends and family turn their vehicle engines off while parked;
- Turning off the vehicle engine whenever possible saves a lot on gasoline costs; and
- You should turn your engine off, even for very short stops.
The implications of these motivations for encouraging motorists to turn off their engines are discussed later in this report.
Weatherization
In the telephone survey, the final activity that respondents were asked about was weatherizing their houses (weatherstripping and caulking). Frequency of weatherization is presented first, followed by information on who engaged in the activity and finally, barriers and motivators for weatherization.
Frequency of Weatherizing Dwellings
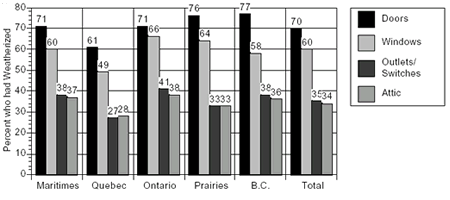
As you can see below, respondents reported that they had weatherized their doors (70 percent), windows (60 percent), outlets and switches (35 percent) and the opening to their attic (34 percent). Urban and rural differences didn't emerge for these four activities; however, regional differences existed. Quebec respondents were less likely to have engaged in all four activities.
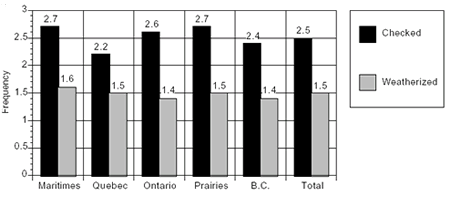
Respondents were also asked "Thinking of the last three years, how many times would you say that you or someone else checked if weatherstripping or caulking was necessary?" In addition, they were asked "Thinking of the last three years, how many times would you say that your house has been weatherstripped or caulked?" As demonstrated in the following chart, on average, respondents reported checking their houses 2.5 times in the last three years. While no differences emerged between urban and rural respondents, Quebec respondents were less likely to check their house.
In terms of actual weatherization, on average, respondents reported weatherizing their homes 1.5 times in the last three years. Weatherizing didn't differ regionally. But, on average, rural respondents weatherized their houses 1.7 times in the last three years, compared with 1.3 times for their urban counterparts.
Who Weatherizes?
Neither age, income nor education was related to the likelihood that a house had been weatherized (doors, windows, outlets and switches, and attic hatch). One demographic factor was related to who weatherizes – the age of the house. Respondents with older houses were, not surprisingly, more likely to have weatherized them.
Barriers to Weatherizing
Respondents were divided into three groups, based on the number of areas that respondents reported weatherizing (i.e. doors, windows, outlets/lights, attic hatch).
- Low Frequency (0 to 1 area): 63 respondents
- Moderate Frequency (between 1.001 and 2.75 areas): 207 respondents
- High Frequency (2.76 areas or more): 377 respondents
Respondents who had weatherized their house at moderate frequency were removed from the following analysis (they are included in other analyses in this section). In order of importance, the following factors were found to distinguish low- and highfrequency weatherization. In descending order of importance, high-frequency weatherization respondents were more likely than low-frequency respondents to
- live in an older home that needed weatherization;
- have spoken with friends or family about the benefits of weatherization;
- have friends or family who weatherstrip or caulk;
- believe that weatherstripping or caulking is the "right thing to do";
- believe that weatherstripping is easy;
- believe that weatherstripping is good for the environment;
- weatherstrip and caulk to keep cold and drafts out and prevent heat loss;
- report having the time to weatherstrip and caulk;
- believe that caulking is easy to do; and
- believe that weatherstripping and caulking are inexpensive.
These factors form the basis of the social marketing strategy for weatherization that is set out in the next section of this report. As with the previous activities, these factors emerged from a large set of potential barriers. For example, none of the demographic factors were found to be important.
Motivations for Weatherizing
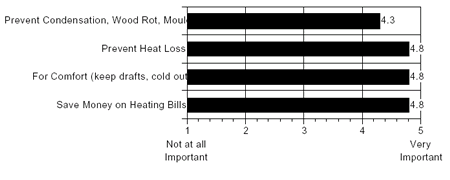
Respondents were asked to rate the importance of several motivations for weatherizing their houses. As you can see in the following chart, preventing heat loss, having a comfortable home and saving money on heating bills were rated as equally important. Preventing condensation, wood rot and mould were less important.
Climate Change Concern and Effectiveness
The telephone survey contained two statements about climate change. First, respondents were asked about the extent to which they agreed with the statement "I am concerned about the problems climate change might cause for my community." As you can see below, respondents agreed moderately, with very little variation across Canada (labelled "concern" in chart). Second, they were queried about the amount of efficiency they felt: "By using energy more efficiently, I can play a role in reducing the possibility of climate change." Again, they agreed moderately, a response that varied little across regions or between urban and rural respondents (labelled "role" in chart).
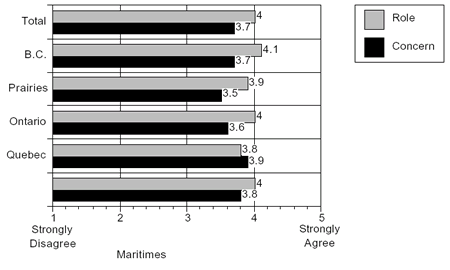
The findings showed that neither statement was related to how often the respondents checked their tire pressure, idled their vehicle or weatherized their house.
Strategies, Pilots and Evaluation Overview
This section presents community-based social marketing strategies, pilots and evaluation mechanisms. It estimates the effectiveness of the proposed strategies in helping people change their behaviour. It also provides estimates of the cost to deliver the pilots. Community-based social marketing strategies are emphasized, since the behaviour change tools used in this type of marketing show a high likelihood of fostering behaviour change. The following table sets out the steps in developing a community based social marketing strategy and conducting a pilot.
9 These steps form the foundation of the proposed strategies – and their respective pilots – set out in this section.
| Step | Explanation |
|---|---|
| Identify Barriers and Motivations | To develop an effective strategy, you must know what prevents the behaviour you desire and what motivates individuals to engage in the activity. |
| Rank Barriers and Motivations in Order of Priority | For an effective community-based social marketing strategy, target the most important barriers and motivators. |
| Match Tools to Barriers and Motivators | Develop a strategy that matches behaviour change tools to the barriers that you have identified. Emphasize the most important motivators through communications tools. |
| Scrutinize Design with Focus Groups | Set up focus groups to review the proposed strategy. Participants should be individuals whom the strategy would target (e.g. individuals who don't presently inflate their tires, weatherize their homes, turn their vehicle engines off, etc.). |
| Include a Control Group in Pilot | To ensure that it is the strategy - and not other factors - that causes changes in behaviour, you need at least two groups in the pilot. The first group receives the strategy, and the second group receives nothing (control group). Then you compare the two groups to find out if your strategy was effective. |
| Use Random Assignment | In conducting a pilot, make sure that the two groups (one that receives the strategy and one that serves as the control group) are as similar as possible. The best way to do this is by random assignment. This gives all participants in a project (e.g. home energy audits) an equal chance of being assigned to either the intervention or control group. |
| Measure Behaviour Change | When evaluating the impact of a pilot, measure behaviour directly (e.g. fuel use, number of windows weatherstripped, etc.). Where possible, avoid self-reports of behaviour because they are often unreliable. Further, don't use changes in attitudes or levels of knowledge as a replacement for direct behaviour measures, since they often correlate poorly with behaviour. |
| Revise Pilot Until Effective | When a pilot doesn't work, it is tempting to conclude that you know the reasons for its failure, and go directly to putting it into practice on a broad scale. Instead, take time to run another pilot to ensure that the strategy works successfully, before you put it into practice on a broader scale. Pilots can often be run quite quickly and can lead to large savings on ineffective programs. |
| Evaluate Community Implementation | Before you put into practice a community-based social marketing strategy across a community, take baseline measures of behaviour (e.g. how many people are presently checking their air pressure in their tires). Compare the impact of the intervention with this baseline. Further, take multiple measurements, so that you can assess the impact of the strategy over time and provide feedback to the community. |
9Originally presented in Chapter 3, "Fostering Behaviour Change: An Introduction to Community-based Social Marketing," in the Public Outreach on Climate Change Foundation Paper. It has been modified slightly.
Developing an effective community-based social marketing strategy involves mapping behaviour change tools over identified barriers. The following table identifies when to use specific behaviour change tools.10
| Barrier | Behaviour Change Tool (s) | Explanation |
|---|---|---|
| Lack of Motivation | Commitment, Norms or Incentives | When individuals are interested in an activity but haven't yet engaged in it, using commitment and/or normative approaches may be enough. When motivation is low, you may need to use incentives to bring about behaviour change. |
| Forget to Engage | in Activity Prompts | When individuals are interested in engaging in an activity but forget to do so, prompts can be effective. Prompts alone work only when other barriers to the behaviour are low, and motivation to engage in the activity is high. |
| Activity Seen as Inconvenient | Structural Changes | When an activity is inconvenient, you can make structural changes so that it is more convenient and/or its competing activity less convenient. |
| Activity Not Seen as the "Right Thing to Do" | Norms | When an activity isn't considered the "right thing to do," little pressure exists to engage in the action. Making the action normative can increase participation rates. |
| Unsupportive Attitudes, Lack of Knowledge | Communications | You can make communications more persuasive by following the methods outlined in the Behaviour Change chapter 3 of the Public Outreach on Climate Change Foundation Paper. For a more detailed review of communications methods, visit the Web site at www.cbsm.com. |
10This table was originally presented in Chapter 3, "Fostering Behaviour Change: An Introduction to Community-based Social Marketing," of the Public Outreach on Climate Change Foundation Paper.
Tire Inflation: Pilot 1
Summary of Barriers and Motivations
As indicated by the focus groups and telephone survey, significant barriers exist to motorists regularly checking whether their tires are properly inflated. In descending order of importance, motorists who checked their tire pressure infrequently were more likely to report that
- they simply forget;
- they don't have a tire gauge;
- they don't have the requisite knowledge (don't know their correct tire pressure, or how to check their pressure or use an air pump); and
- they were female.
In addition, the three most important motivations for checking tire pressure were driving safety, preventing unnecessary tire wear and increasing fuel efficiency.
Social Marketing Strategy
11
The following community-based social marketing strategy is to be delivered at gas stations. This location is highlighted, because such marketing strategies are effective when they are put into practice where the activity is most likely to occur. You could supplement the following strategy with media advertising. If you do plan media advertising, use television advertisements. The barrier research identified knowledge as a key impediment to checking tire pressure and inflation. Since checking tire pressure and inflation are simple activities, they lend themselves well to being modelled via a television advertisement. Given the low frequency with which women check their tires, use a female model and target the ads at shows that have a primarily female audience. Further, the advertisements could underscore that maintaining tire pressure enhances driving safety, a motivation that will likely appeal to mothers. While television advertisements can supplement the following strategy, you can put the proposed strategy into practice by itself. This strategy has three main components: using prompts, providing requisite knowledge and making tire gauges available. Further, the strategy, while directed to all motorists, particularly targets women. Each of these components is set out below.
11To be accurate, tire pressure needs to be checked before driving, when tires are cold. If a tire is underinflated, the motorist needs to drive to a gas station, recheck the tire's pressure, calculate the difference in pressure between the "cold" and "hot" check and then fill the tire accordingly. Unfortunately, it is unlikely that many motorists can be encouraged to double-check their tires. And social marketing resources would likely be misspent encouraging it. Instead, we suggest that motorists need to be taught that driving a car will increase tire pressure.
Prompts and Knowledge: Since forgetting to check tire pressure is the primary barrier, the proposed strategy relies upon prompts (signs). Place prompts in clear sight at gas pumps, in the store and by the air pump. These signs
- remind motorists to check their air pressure;
- provide information on how to find the correct pressure for tires, check tire pressure and use an air pump; and
- indicate that checking tires will improve driving safety, prevent unnecessary tire wear, improve fuel efficiency and decrease greenhouse gas emissions.12
Tire Gauge: The survey revealed that many motorists don't have a tire gauge (nearly 40 percent of respondents who seldom checked their tires reported not having a tire gauge). Accordingly, an important component of this strategy involves providing tire gauges that motorists can borrow. To decrease theft or prevent a motorist from simply forgetting to return the gauge, attach it to a bar (as many washroom keys in gas stations are) or tether the gauge by the air pump.
Women: To increase the perception that checking tire pressure is a "female activity," the prompts use female and male models to demonstrate how to check tire pressure and inflate a tire. Further, in the commitment conditions (see following table), ask gas station attendants not only to remind motorists to check their tires, but also to ask female motorists if they would like to be shown how to check their tire pressure and inflate a tire. The attendants can do this without having to directly model the activities, because you first supply them with a graphic that visually shows how to check tire pressure and inflate a tire.
Pilots
Follow the guidelines set at the beginning of this section. Before carrying out the pilot, conduct focus groups with motorists who seldom check their tire pressure, to gain their reactions to the proposed strategy. Further, conduct several focus groups with women only. Perhaps women haven't learned how to check and inflate their tires because they don't want to (e.g. they may see checking tire pressure as messy, a masculine activity, etc.). Conducting focus groups before running the pilot lets you check for additional barriers for women.
Conduct the pilot for one month, with follow-ups carried out at two and four months. Further, conduct the pilot during warmer months, since winter will likely decrease checking tire pressure in many parts of Canada.
As you can see below, the proposed pilot allows you to determine the most costeffective strategy. As shown in the following table, a total of 60 gas stations are randomly assigned to one of five conditions. You need to have at least 12 stations in each condition to control for characteristics that are specific to a particular station (e.g. unsupportive management).
12Likely, most motorists don't realize that under-inflated tires can make them use significantly more fuel. For example, Environment Canada reports that if just one tire on a vehicle is under-inflated by six pounds per square inch, fuel consumption can increase by five percent.
| Prompts |
Prompts and Commitment |
Control | |
|---|---|---|---|
| Tire Gauge |
|
|
|
| No Tire Gauge |
|
|
Evaluation
To determine the effectiveness of the above strategies, use random time sampling. This involves selecting random time intervals (e.g. 75 minutes) during which you observe the behaviour of motorists at a gas station. By observing their behaviour this way, you can accurately determine the frequency with which motorists check their tire pressure – during both the intervention and follow-up periods. In addition to comparing the intervention conditions to the control condition, compare the four intervention conditions to determine the relative effectiveness of the four strategies.
Participation Levels
It is difficult (and likely unwise) to speculate on the percentage of motorists who will check and inflate their tires in response to this strategy. The pilot will find out the participation levels.
Pilot Costs
$150,000
13Attendants receive scripts to help them talk to motorists about tire inflation. Then the attendants give motorists a card that they can use as a future reference for tire inflation. Finally, to increase the likelihood that they remind motorists, a raffle will be held in which the likelihood of winning is directly related to the number of motorists that attendants have prompted.
Tire Inflation: Pilot 2
Today it is technically possible for a vehicle to alert its driver if a tire is under-inflated. At least one new vehicle, the Toyota Sienna, has a tire pressure monitoring system that automatically tells the driver when a tire's pressure decreases below a specified level. This system is apparently sensitive, alerting the driver when tire pressure falls as little as two pounds per square inch. (Independently verify the effectiveness of this system before proceeding with this pilot). This system makes use of the sensors in the anti-lock braking system. It detects a change in the rotation of the tire caused by a decrease in pressure.
When a tire is under-inflated by a specified amount, a warning light goes off, prompting the driver to inflate the tire. If many car manufacturers across Canada adopted this technology, the percentage of vehicles with properly inflated tires could substantially increase. The following strategy and pilot will allow you to test the potential impact of this innovation.
Social Marketing Strategy
This technical innovation removes the most important barrier to checking whether a vehicle's tires are properly inflated – forgetting. However, research suggests that knowledge and the presence of a tire gauge are also important. The following strategy addresses these three barriers.
In this strategy, divide new car dealerships into four equivalent groups (40 motorists per condition).14 Two of the four groups include motorists who are purchasing a vehicle that automatically prompts the driver when a tire is under-inflated, while the other two groups are buying vehicles without this feature.15 Further, the four groups differ in whether the salesperson gives them a tire gauge and briefly instructs them in checking and inflating tires.
As always, review this social marketing strategy via focus groups with vehicle salespeople, before you put it into practice.
Pilot
As the following table demonstrates, randomly divide 48 dealerships into four groups. Seek commitments from vehicle salespeople to participate in the pilot. To ensure that the salespeople comply, make their commitments public (e.g. publish the names of those agreeing to participate). Further, the project manager should periodically check in with participating salespeople.
14Forty motorists is the minimum number of new car purchases per condition. You could increase this number, because the number of dealerships allow you to monitor more purchases.
15To make the groups as equivalent as possible, select similar vehicles (e.g. two makes of minivans in the same price range).
| Vehicle Prompts Driver | Vehicle Doesn't Prompt Driver | |
|---|---|---|
| Tire Gauge and Instruction |
|
|
| No Tire Gauge or Instruction |
|
|
At six and twelve months following the purchase of the vehicle, visit owners in all four conditions. Seek their permission to check the tire pressure of their vehicle. In addition, ask all owners how often they have tested tire pressure and inflated their tires since they bought their vehicle.
Participation Levels
If this technology is widely put into practice, it has the potential to significantly increase the number of vehicles that have correctly inflated tires.
Pilot Costs
$120,000
16Purchasers receive a card that provides brief instructions on how to check and inflate tires. As in the first pilot, it tells motorists why they should keep their tires properly inflated.
Idling: Pilot 1
Summary of Barriers and Motivations
The focus groups and telephone survey reveal that significant barriers exist to motorists turning off their idling vehicle engines. In descending order of importance, motorists who idled their vehicles more frequently were more likely to
- believe it is good to warm a vehicle before driving;
- be younger;
- idle to keep themselves warm;
- believe that idling doesn't take as much fuel as restarting;
- have a lower level of education;
- believe that idling doesn't produce unnecessary pollution; and
- believe that it is easier on a vehicle's starter to let an engine idle.
In addition, the most important motivation for engaging in this action was believing that turning off a vehicle's engine is the "right thing to do."
Social Marketing Strategy
The following community-based social marketing strategy targets settings in which motorists likely idle their vehicles (e.g. pick-up points). Previous research by Natural Resources Canada identified a variety of these settings.
As with tire pressure, you can supplement the following strategy with media advertising. For media advertising, use radio advertisements. They cost less than television and are more likely to reach motorists while they are in their cars. (And turning off a vehicle engine doesn't need to be modelled the way that checking and inflating a tire does).17 The radio advertisements should directly address beliefs that are associated with idling (e.g. it is good to warm a vehicle before driving, idling doesn't take as much fuel as restarting, idling produces little pollution, and restarting a vehicle is hard on the starter). While these radio advertisements should be broadly aired, target younger drivers as a group that is particularly likely to idle. Further, these ads should emphasize that turning off your engine is the "right thing to do."
While you can use radio advertisements to supplement the following strategy, you can also put into practice by itself. The proposed strategy has two main components: prompts and/or knowledge, and commitments.
Prompts and Knowledge: Use prompts to
- remind motorists to turn off their car engines; and
- inform motorists that
- it takes only 10 seconds of idling before you use less gas by turning off the engine and restarting
- some later model cars don't have to be warmed before driving
- idling produces pollution and carbon dioxide (CO2) emissions
- it is hard on your starter to turn off your vehicle engine.
17 In large Canadian centres, you could air these advertisements on radio stations that are often listened to in order to obtain traffic reports.
Commitments: Gaining a commitment to turn off a vehicle engine can be a powerful factor in reducing idling, especially when these commitments are made public. You can make commitments public by posting them in areas where drivers are likely to idle (e.g. school parking lots)18 or by taking out advertisements in the newspaper or on the radio. These commitments, when made public, can help develop community norms that favour turning off idling engines.
Pilots
As with tire inflation, before conducting the pilot, conduct focus groups with motorists who seldom turn off their engines. This way, you gain their reactions to the proposed strategy. Also, conduct several focus groups younger motorists to further explore their higher frequency of idling.
Conduct the pilot for one month, then follow up at two and four months. Moreover, conduct the pilot during warmer months, since (as with tire inflation) winter will likely decrease compliance a lot.
As you can see below, the proposed pilot will determine the most cost-effective strategy. In the following table, a total of 36 locations are randomly assigned to one of three conditions.
| Prompts | Prompts and Commitment | Control |
|---|---|---|
|
|
|
Evaluation
To determine the effectiveness of the above strategies, use random time sampling. As with tire inflation, it involves selecting random time intervals (e.g. 75 minutes) during which you observe the engine idling of motorists. By observing the behaviour of motorists this way, you can accurately determine the frequency and duration of idling. Use the same monitoring method for the follow-up periods.
18Note that commitments that you post close to where drivers idle their vehicles also serve as prompts and a way to develop new norms about idling.
Participation Levels
You can anticipate that the above strategy will be highly successful, but it is unwise to speculate on the extent to which behaviour will change. The pilots will, however, provide this information.
Pilot Costs
$125,000
Idling: Pilot 2
It is technically possible for a vehicle to alert its driver if three conditions are met: the outside temperature is above a specified degree, the car is in park and the engine is idling.
This pilot involves outfitting vehicles with such monitoring equipment and then testing its impact upon idling. The attraction of this prompting system is that its widespread adoption could greatly decrease the percentage of vehicles that are idled. The following strategy and pilot allow you to test the potential impact of this innovation.
Social Marketing Strategy
This technical innovation removes a potentially important barrier to turning off an idling engine – forgetting. In this strategy, you divide a fleet of cars randomly into four groups (12 vehicles per condition). All vehicles are equipped to monitor idling. Half of the drivers receive information about warming the vehicle before driving and the amount of fuel used in restarting, as well as the impact that turning off the engine has on pollution and the vehicle's starter. Before putting this social marketing strategy into practice, review it with focus groups of motorists and fleet managers.
Pilot
As the following table demonstrates, 48 vehicles are randomly divided into four groups.
| Prompts | Prompts and Commitment | Control |
|---|---|---|
| Information |
|
|
| No Information |
|
|
19Pre-testing and focus groups would determine how "annoying" to make this prompt.
Evaluation
The monitoring equipment records the frequency and duration of idling under all four conditions. Fuel use could also be recorded.
Participation Levels
If this strategy significantly affects idling, and the costs to put it into practice are low enough, it has the potential to substantially reduce idling.
Pilot Costs
$50,000 (cost of equipment and installation not included)
Weatherization and Programmable Thermostats
Fall is the best time to encourage people to weatherize their houses and install thermostats that they can program. And the proposed strategies to encourage both are very similar. Therefore, these two activities are combined in one pilot. Combining these two activities also reduces the cost to pilot the strategies.
Summary of Barriers and Motivations for Weatherization
The telephone survey revealed that 70 percent of households had weatherized their doors, 60 percent their windows, 35 percent their outlets and switches, and 34 percent the opening to their attic. This variation indicates that substantial opportunity exists to increase the percentage of homes that weatherize outlets and/or switches, and attic openings. Further, with 30 percent of respondents indicating that they hadn't weatherized their doors and 40 percent their windows, significant opportunity exists for these activities as well. In descending order of importance, householders more likely to have weatherized their dwelling reported that they
- live in an older home that needed weatherization;
- spoke with friends or family about the benefits of weatherization;
- have friends or family who weather strip or caulk;
- believe that weatherstripping or caulking is the "right thing to do";
- believe that weatherstripping is easy;
- believing that weatherstripping is good for the environment;
- weatherstrip and caulk to keep cold and drafts out, and to prevent heat loss;
- have the time to weatherstrip and caulk;
- believe that caulking is easy to do; and
- believe that weatherstripping and caulking are inexpensive.
Summary of Barriers and Motivations for Installing Programmable Thermostats
A study conducted for BC Hydro found that the following factors showed the difference between people who had installed a programmable thermostat and those who hadn't. These factors are presented in descending order of importance. People who had installed a programmable thermostat were more likely to report that they
- were motivated to install the thermostat to save money;
- were motivated to install the thermostat to enhance home comfort;
- had environmental motivations for installing the thermostat;
- evaluated programmable thermostats positively; and
- saw themselves as skilled at installing programmable thermostats.
Social Marketing Strategy
This strategy has three components: modelling the activity, simplifying access to materials, and gaining commitments to weatherize and/or install programmable thermostats. Using methods that are similar to the Green Community Initiative,20 trained staff go door-to-door in the fall to discuss weatherization and installing programmable thermostats. All contacted householders receive information about how easy it is to weatherstrip and caulk. They are told that they improve home comfort, prevent heat loss, are inexpensive and contribute to reducing greenhouse gas (GHG) emissions. Further, they learn that programmable thermostats are easy to install, and save money, enhance comfort and similarly reduce GHG emissions.
Modelling: In addition, half of the participants are randomly assigned to have each of the activities modelled for them. These brief instructions underscore that caulking and weatherstripping, and installing programmable thermostats are easy to do. Thus the staff members carry a demonstration kit that allows them to quickly show householders how to weatherize a house and install a programmable thermostat.
Easier Access: Findings repeatedly show that convenience is one of the strongest determinants of individuals engaging in environmentally friendly activities. In the proposed strategy, half of the participants are given the opportunity to buy weatherization materials and programmable thermostats directly from the staff member. Commitments: Half of the households who express interest in weatherizing their house and/or installing a programmable thermostat are asked to make a public commitment to do so. The commitment involves publishing their names in an advertisement in the local newspaper. (Findings show that this technique substantially increases the likelihood that individuals will follow through on their commitments).
Pilots
Before conducting the pilot, set up focus groups with householders who seldom weatherize and don't have a programmable thermostat, to gain their reactions to the proposed strategy. Further, conduct the pilot during September, October and early November, since promoting these activities is most successful when the motivation to engage in them is highest.
As you can see below, the proposed pilot allows you to determine the most cost effective strategy. As shown in the following table, a total of 320 households are randomly assigned to one of eight conditions.
| Commitment | No Commitment | ||
|---|---|---|---|
| Materials Provided | Modelled |
|
|
| Not Modelled |
|
|
|
| Materials Not Provided | Modelled |
|
|
| Not Modelled |
|
|
Evaluation
To evaluate the effectiveness of these strategies, take two measurements. First, obtain the measurements of energy use from the local utility at 2, 4, 6 and 12 months following the interventions. Compare the conditions to find out what impact the various strategies have upon energy use (and consequently, CO2 emissions) and to determine the most cost-effective strategy.
Second, conduct follow-up telephone surveys to obtain self-reports of whether the household weatherized and/or installed the programmable thermostat, and to further explore the perceptions of both of these activities.
Participation Levels
You can anticipate that the above strategy will be highly successful, but it is unwise to speculate on the extent to which behaviour will change. The pilots will, however, provide this information.
Pilot Costs
$150,000
Best-of-Class Purchases
The fuel-efficiency of vehicles varies significantly. Even with vehicles of similar size, best-of-class vehicles often use markedly less fuel and produce a great deal less greenhouse gas (GHG) emissions than their less efficient counterparts. Buying a best-of-class vehicle can reduce both ownership costs and emissions.
However, NRCan research suggests that fuel efficiency is often not an important determinant of new car purchases. When purchasers do consider fuel economy, focus group research conducted for NRCan suggests that they do so before going to a showroom. That is, a new car purchaser may decide what size of car to buy based upon fuel economy, but then often doesn't consider the fuel economy of the various models found in that class size. The following quotes underscore this thinking: "In a similar category, it's all about the same consumption" and "You know what to expect in terms of consumption – if you take a small four-cylinder vehicle, you know fuel consumption won't be that much." The strategy below will find out if it is possible to increase the purchase of best-of-class vehicles.
Social Marketing Strategy
While fuel efficiency hasn't been found to be an important determinant of vehicle purchases in Canada in the 1990s, it was important in the past. With low gasoline costs, new car purchasers likely pay attention to the week-to-week gasoline costs and pay a lot less attention to the long-term cost of gasoline. This strategy, then, focuses on bringing attention to the long-term "second price tag" that is linked with buying cars of different levels of fuel efficiency. It uses information contained in NRCan's Fuel Consumption Guide to determine the "second price tag." Further, it uses a well documented finding in the social sciences: We are more motivated to avoid losing money than we are to save the same amount of money. As before, review this social marketing strategy via focus groups with vehicle salespeople and car purchasers before you put it into practice.
Pilot
As the following table demonstrates, 24 dealerships selling vehicles from the same manufacturer are randomly divided into two groups. Seek commitments from vehicle salespeople to participate in the pilot. As before, to ensure compliance by the salespeople, make their commitments public (e.g. publish the names of those agreeing to participate). Further, the project manager should periodically check in with participating salespeople. Give salespeople information on how their vehicles compare – in terms of gasoline use and costs – with other vehicles in the same class (e.g. the second price tag). Further, teach them how, and why, to present this information in terms of money lost through buying less efficient vehicles. Ask one car manufacturer to participate in this project (e.g. a manufacturer that already produces several best-ofclass vehicles across its line-up).
| Size of Vehicle | Prompt (12 dealerships) | No Prompt (12 dealerships) |
|---|---|---|
| Sub-Compact | · Salesperson reviews with potential purchaser the "second price tag" of similar-sized vehicles and presents this cost as a "loss" | · Salesperson neither reviews with potential purchaser the second price tag of similarsized vehicles nor presents this cost as a loss |
| Compact | · Salesperson reviews with potential purchaser the second price tag of similar-sized vehicles and presents this cost as a loss | · Salesperson neither reviews with potential purchaser the second price tag of similarsized vehicles nor presents this cost as a loss |
| Mid-Size | · Salesperson reviews with potential purchaser the second price tag of similar-sized vehicles and presents this cost as a loss | · Salesperson neither reviews with potential purchaser the second price tag of similarsized vehicles nor presents this cost as a loss |
| Large | · Salesperson reviews with potential purchaser the second price tag of similar-sized vehicles and presents this cost as a loss | · Salesperson neither reviews with potential purchaser the second price tag of similarsized vehicles nor presents this cost as a loss |
Evaluation
Compare the relative rates of buying best-of-class vehicles between "prompt" and "no prompt" dealerships.
Participation Levels
Given the low impact that gasoline costs have on new car purchases today, it is unlikely that this intervention will substantially raise the percentage of best-of-class purchases. However, as gasoline costs rise in the future, this strategy could significantly influence purchases.
Pilot Costs
$125,000
Conclusion
The strategies and pilots set out in this report have a high likelihood of changing behaviour. Each is based on a clear understanding of what impedes and motivates individuals to engage in a specific activity. Further, each strategy uses communitybased social marketing tools that have a proven track record of changing behaviour. Finally, the pilots allow you to draw firm conclusions about the efficiency and costeffectiveness of the strategies.
As such, the pilots proposed in this report, if conducted, will provide a firm basis for deciding whether you should put them into practice on a broader level.
Appendix
| Activity | Emissions Potential | Contacts | Notes |
|---|---|---|---|
| Reducing Idling | One minute of idling produces 0.0001 metric tonnes of CO2. | Catherine Ray, Auto$mart Program, Office of Energy Efficiency, Natural Resources Canada, (613) 995-5264 | A study conducted for NRCan identified various factors linked with car idling, including comfort, not stopping long enough to warrant turning off the engine, safety (clearing windows), inconvenience, not remembering to, believing that it is good for the engine to let the car warm up, believing that it is easier on the starter to let the engine idle and concern about draining the battery. Further, motorists are likely to idle their cars in specific situations - warming their cars, waiting to pick up someone and doing errands. Knowing where people are most likely to idle their cars is helpful in developing strategies |
| Purchasing Best of Class Cars | Light trucks and cars Combined released 56 percent of GHG emissions related to transportation, in 1995 | Charles Villeneuve, EnerGuide for Vehicles, Office of Energy Efficiency, Natural Resources Canada, (613) 947-7788 | Research shows that many Canadians don't consider fuel consumption when they purchase new vehicles. When they do, concern about fuel consumption is usually motivated by finances - not the environment. This research suggests that it will be difficult to motivate Canadians to purchase cars based upon environmental motivations. Further, social marketing campaigns are unlikely to be very effective until higher gasoline costs alter motivations. Alternatively, greater awareness of the second price tag could possibly increase motivation to consider fuel-efficient cars. |
| "Walking School Bus" | Not yet known | Jacky Kennedy | Greenest City has conducted informal brainstorming sessions to identify barriers to "walking school buses." These sessions, have identified such barriers as inconvenience, physical infrastructure, deteriorating communities and safety. Greenest City has applied to Canada's Climate Change Action Fund to determine the barriers to walking school buses" and to develop and test social marketing strategies. |
| Inflating Tires | Not yet known | Catherine Ray, Auto$mart Program, Office of Energy Efficiency, Natural Resources Canada, (613) 995-5264 |
A 1984 survey found that 70 percent of Canadian passenger vehicles had at least one under-inflated tire. Every five percent of under-inflation equals a one percent increase in fuel consumption. Further, Transport Canada suggests that at least 40 percent of passenger cars have at least one tire under-inflated by 10 percent, resulting in a twopercent increase in fuel consumption. A study conducted for NRCan suggests that awareness of the importance of tire inflation has little relationship to actual tire inflation. Research conducted for NRCan suggests that regularly checking tire inflation is related to demographic predictors. There are likely more important factors that distinguish motorists who check tire inflation from those who don't - such as social diffusion or perceived skill - but these factors weren't investigated |
| Weatherstripping and/or Caulking | Space heating accounted for 61 percent of residential energy use, in 1996 | Louis Marmen, Director, Housing, Buildings and Regulations, Office of Energy Efficiency, Natural Resources Canada, (613) 996-7512 | The Alberta Department of Energy suggests that weatherstripping and caulking can reduce energy use for space heating from 5 to 25 percent. More conservatively, the Residential Sector Climate Change Foundation Paper by the Buildings Table suggests that the electrical space-heating savings from regular maintenance of weatherstripping is three percent. While the buildings foundation paper suggests some general barriers related to a lack of residential energy efficiency, barriers specific to this activity haven't been identified in the reviewed literature. |
| Purchasing Energy-Efficient Home | Introducing R-2000* as the minimum building code is projected to reduce GHG emissions by 3.7 megatonnes. (relative to projected levels for 2010) | Louis Marmen, Director, Housing, Buildings and Regulations, Office of Energy Efficiency, Natural Resources Canada, (613) 996-7512 |
Building homes to the R-2000 Standard would reduce energy use by 26 percent, relative to the average energy use of homes built in 1994. Purchases of R-2000 homes, however, accounted for only 0.6 percent of new homes built in 1995. And only about 7000 R-2000 homes have been built since the R-2000 Program started in 1982. These figures suggest that social marketing programs are likely to have a limited impact on R-2000 purchases. Changes to building codes that mandated R-2000 or equivalent appear to be more fruitful - especially in the absence of high-energy costs. (The current payback period for an R-2000 home is 15 to 20 years.) |
| Purchasing Energy-Efficient Furnace (new or replacement) | Not yet known | Louis Marmen | Awaiting information from NRCan about energy-efficient furnaces |
| Purchasing Energy-Efficient Appliances | Appliances accounted for 13 percent of Residential energy use, in 1996 | Louis Marmen | Awaiting information from NRCan about energy-efficient appliances |
| Setting Thermostats Back | Not yet known | Doug McKenzie-Mohr |
Research that Doug McKenzie-Mohr conducted for BC Hydro has identified barriers to this activity. You might include this as one of the activities for which you develop a strategy without further research. Barriers and motivations, in descending order of importance, that have been identified include perceived savings, home comfort, environmental reasons, perceived availability, evaluation of programmable thermostats, skill about installation and motivation. |
Page details
- Date modified: