Fuel Focus, June 14, 2013
Table of Contents
- National Overview
- Recent Developments
- Retail Gasoline Overview
- Wholesale Gasoline Prices
- Refining and Marketing Margins
- Crude Oil Overview
- Supplement
- Download the report
National Overview
Canadian Retail Gasoline Prices Increased 2 Cents per Litre from Last Week
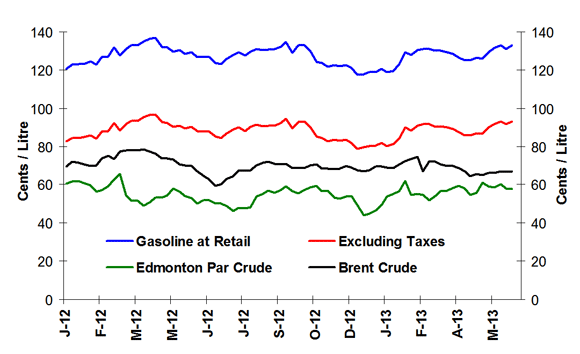
For the week ending June 11, 2013, Canadian average retail gasoline prices increased by 2 cents per litre to $1.33 per litre on higher crude oil and wholesale gasoline prices. Retail pump prices remain unchanged compared to the last report two weeks ago. Prices have reached an eight-month high and are above last year’s level by nearly 6 cents per litre.
Diesel fuel prices declined by less than 1 cent per litre from the previous week to $1.24 per litre, while furnace oil prices increased by 2 cents, ending at $1.18 per litre. Compared to a year ago, prices for diesel and furnace oil are 4 cents per litre higher, respectively.
Figure 1: Crude Oil and Regular Gasoline Price Comparison
(National Average)
Text version - Figure 1
The graph shows prices in cents per litre for gasoline at retail, gasoline excluding taxes, and Edmonton Par and Brent crude oil prices. Gasoline prices ended the period of June 11, 2013 at 132.9 cents per litre, excluding taxes at 93.2 cents per litre, Edmonton Par at 57.8 cents per litre and Brent at 66.8 cents per litre.
| Dates | Gasoline at retail | Excluding Taxes | Edmonton Par crude | Brent crude |
|---|---|---|---|---|
| 03/01/2012 | 120.6 | 82.7 | 60.5 | 69.6 |
| 10/01/2012 | 122.9 | 84.4 | 61.7 | 72.1 |
| 17/01/2012 | 123.0 | 84.4 | 61.8 | 71.8 |
| 24/01/2012 | 123.3 | 84.8 | 61.0 | 70.4 |
| 31/01/2012 | 124.7 | 86.0 | 59.7 | 69.7 |
| 07/02/2012 | 122.7 | 84.2 | 56.1 | 70.2 |
| 14/02/2012 | 126.7 | 87.8 | 57.1 | 73.6 |
| 21/02/2012 | 127.0 | 88.1 | 58.9 | 75.1 |
| 28/02/2012 | 131.7 | 92.4 | 62.6 | 73.4 |
| 06/03/2012 | 127.3 | 88.5 | 65.6 | 77.5 |
| 13/03/2012 | 131.0 | 91.8 | 54.9 | 77.9 |
| 20/03/2012 | 132.8 | 93.4 | 51.6 | 78.2 |
| 27/03/2012 | 132.7 | 93.3 | 51.7 | 78.1 |
| 03/04/2012 | 135.1 | 95.2 | 48.9 | 78.3 |
| 10/04/2012 | 136.4 | 96.4 | 50.8 | 77.5 |
| 17/04/2012 | 136.7 | 96.7 | 52.9 | 76.2 |
| 24/04/2012 | 132.0 | 92.6 | 53.4 | 73.9 |
| 01/05/2012 | 131.9 | 92.4 | 54.4 | 73.9 |
| 08/05/2012 | 129.5 | 90.3 | 58.1 | 73.0 |
| 15/05/2012 | 130.3 | 91.0 | 56.2 | 70.7 |
| 22/05/2012 | 128.5 | 89.4 | 54.2 | 70.2 |
| 29/05/2012 | 129.3 | 90.1 | 53.0 | 69.9 |
| 05/06/2012 | 126.8 | 88.0 | 50.0 | 66.8 |
| 12/06/2012 | 126.7 | 87.9 | 51.9 | 64.7 |
| 19/06/2012 | 126.8 | 87.9 | 52.1 | 62.6 |
| 26/06/2012 | 123.7 | 85.2 | 50.3 | 59.5 |
| 03/07/2012 | 123.1 | 84.5 | 50.3 | 60.0 |
| 10/07/2012 | 126.0 | 87.1 | 48.8 | 63.1 |
| 17/07/2012 | 128.0 | 88.8 | 46.0 | 64.3 |
| 24/07/2012 | 129.2 | 89.9 | 48.0 | 67.7 |
| 31/07/2012 | 127.3 | 88.2 | 47.6 | 67.4 |
| 07/08/2012 | 129.7 | 90.3 | 48.5 | 67.5 |
| 14/08/2012 | 131.0 | 91.2 | 53.6 | 70.3 |
| 21/08/2012 | 130.3 | 90.5 | 55.1 | 71.8 |
| 28/08/2012 | 130.7 | 90.9 | 56.9 | 72.1 |
| 04/09/2012 | 130.9 | 91.1 | 55.9 | 70.8 |
| 11/09/2012 | 132.2 | 92.2 | 57.3 | 70.4 |
| 18/09/2012 | 134.6 | 94.4 | 59.0 | 71.0 |
| 25/09/2012 | 128.9 | 89.4 | 56.7 | 68.6 |
| 02/10/2012 | 132.8 | 92.8 | 55.3 | 69.1 |
| 09/10/2012 | 133.0 | 93.0 | 57.2 | 68.6 |
| 16/10/2012 | 130.1 | 90.4 | 58.7 | 70.3 |
| 23/10/2012 | 124.3 | 85.3 | 59.6 | 70.5 |
| 30/10/2012 | 123.5 | 84.5 | 56.6 | 68.5 |
| 06/11/2012 | 121.6 | 82.7 | 57.0 | 68.3 |
| 13/11/2012 | 122.5 | 83.5 | 53.5 | 68.0 |
| 20/11/2012 | 122.2 | 83.2 | 52.7 | 68.6 |
| 27/11/2012 | 122.6 | 83.5 | 53.8 | 69.7 |
| 04/12/2012 | 120.9 | 81.9 | 54.2 | 69.0 |
| 11/12/2012 | 117.3 | 78.7 | 49.4 | 67.8 |
| 18/12/2012 | 117.7 | 79.5 | 44.1 | 67.1 |
| 25/12/2012 | 119.0 | 80.3 | 44.8 | 67.7 |
| 01/01/2013 | 118.9 | 80.4 | 46.6 | 69.3 |
| 08/01/2013 | 120.6 | 81.9 | 49.4 | 69.5 |
| 15/01/2013 | 118.9 | 80.3 | 53.7 | 69.2 |
| 22/01/2013 | 119.7 | 81.1 | 55.2 | 68.7 |
| 29/01/2013 | 123.3 | 84.3 | 56.6 | 70.7 |
| 05/02/2013 | 129.2 | 89.7 | 61.9 | 72.5 |
| 12/02/2013 | 127.7 | 88.4 | 54.8 | 73.5 |
| 19/02/2013 | 130.5 | 90.9 | 55.3 | 74.6 |
| 26/02/2013 | 131.2 | 91.6 | 54.7 | 67.1 |
| 05/03/2013 | 131.2 | 91.6 | 51.8 | 72.5 |
| 12/03/2013 | 129.9 | 90.4 | 54.2 | 71.8 |
| 19/03/2013 | 130.1 | 90.7 | 56.7 | 70.6 |
| 23/04/2013 | 125.1 | 85.9 | 54.8 | 64.4 |
| 30/04/2013 | 126.3 | 87.0 | 55.8 | 65.5 |
| 07/05/2013 | 126.0 | 86.7 | 61.4 | 65.1 |
| 14/05/2013 | 129.3 | 89.8 | 59.1 | 66.1 |
| 21/05/2013 | 131.4 | 91.8 | 58.8 | 66.1 |
| 28/05/2013 | 132.9 | 93.2 | 60.0 | 66.9 |
| 04/06/2013 | 131.1 | 91.5 | 58.1 | 66.6 |
| 11/06/2013 | 132.9 | 93.2 | 57.8 | 66.8 |
Figure 2: Weekly Regular Gasoline Prices

Text version - Figure 2
This graph shows the gasoline price trends from 2011 to 2013.
| 2011 | 2012 | 2013 | |||
|---|---|---|---|---|---|
| Gasoline at Retail | Gasoline at Retail | Gasoline at Retail | |||
| 11-01-04 | 113.30 | 12-01-03 | 120.60 | 13-01-01 | 118.90 |
| 11-01-11 | 113.10 | 12-01-10 | 122.90 | 13-01-08 | 120.60 |
| 11-01-18 | 115.60 | 12-01-17 | 123.00 | 13-01-15 | 118.90 |
| 11-01-25 | 114.90 | 12-01-24 | 123.30 | 13-01-22 | 119.70 |
| 11-02-01 | 113.70 | 12-01-31 | 124.70 | 13-01-29 | 123.30 |
| 11-02-08 | 112.90 | 12-02-07 | 122.70 | 13-02-05 | 129.20 |
| 11-02-15 | 114.60 | 12-02-14 | 126.70 | 13-02-12 | 127.70 |
| 11-02-22 | 115.10 | 12-02-21 | 127.00 | 13-02-19 | 130.50 |
| 11-03-01 | 120.60 | 12-02-28 | 131.70 | 13-02-26 | 131.20 |
| 11-03-08 | 124.50 | 12-03-06 | 127.30 | 13-03-05 | 131.20 |
| 11-03-15 | 123.50 | 12-03-13 | 131.00 | 13-03-12 | 129.90 |
| 11-03-22 | 121.80 | 12-03-20 | 132.80 | 13-03-19 | 130.10 |
| 11-03-29 | 125.40 | 12-03-27 | 132.70 | 13-03-26 | 129.40 |
| 11-04-05 | 127.70 | 12-04-03 | 135.10 | 13-04-02 | 128.70 |
| 11-04-12 | 129.70 | 12-04-10 | 136.40 | 13-04-09 | 126.50 |
| 11-04-19 | 133.40 | 12-04-17 | 136.70 | 13-04-16 | 125.00 |
| 11-04-26 | 133.90 | 12-04-24 | 132.00 | 13-04-23 | 125.10 |
| 11-05-03 | 135.70 | 12-05-01 | 131.90 | 13-04-30 | 126.30 |
| 11-05-10 | 135.40 | 12-05-08 | 129.50 | 13-05-07 | 126.00 |
| 11-05-17 | 130.90 | 12-05-15 | 130.30 | 13-05-14 | 129.30 |
| 11-05-24 | 127.20 | 12-05-22 | 128.50 | 13-05-21 | 131.40 |
| 11-05-31 | 129.90 | 12-05-29 | 129.30 | 13-05-28 | 132.90 |
| 11-06-07 | 127.60 | 12-06-05 | 126.80 | 13-06-04 | 131.10 |
| 11-06-14 | 127.30 | 12-06-12 | 126.70 | 13-06-11 | 132.90 |
| 11-06-21 | 126.60 | 12-06-19 | 126.80 | 13-06-18 | |
| 11-06-28 | 124.50 | 12-06-26 | 123.70 | 13-06-25 | |
| 11-07-05 | 125.80 | 12-07-03 | 123.10 | 13-07-02 | |
| 11-07-12 | 127.90 | 12-07-10 | 126.00 | 13-07-09 | |
| 11-07-19 | 128.40 | 12-07-17 | 128.00 | 13-07-16 | |
| 11-07-26 | 128.10 | 12-07-24 | 129.20 | 13-07-23 | |
| 11-08-02 | 128.40 | 12-07-31 | 127.30 | 13-07-30 | |
| 11-08-09 | 125.50 | 12-08-07 | 129.70 | 13-08-06 | |
| 11-08-16 | 126.40 | 12-08-14 | 131.00 | 13-08-13 | |
| 11-08-23 | 126.00 | 12-08-21 | 130.30 | 13-08-20 | |
| 11-08-30 | 128.00 | 12-08-28 | 130.60 | 13-08-27 | |
| 11-09-06 | 128.60 | 12-09-04 | 130.90 | 13-09-03 | |
| 11-09-13 | 127.20 | 12-09-11 | 132.20 | 13-09-10 | |
| 11-09-20 | 124.90 | 12-09-18 | 134.60 | 13-09-17 | |
| 11-09-27 | 123.90 | 12-09-25 | 128.90 | 13-09-24 | |
| 11-10-04 | 123.40 | 12-10-02 | 132.80 | 13-10-01 | |
| 11-10-11 | 125.60 | 12-10-09 | 133.00 | 13-10-08 | |
| 11-10-18 | 126.40 | 12-10-16 | 130.10 | 13-10-15 | |
| 11-10-25 | 124.00 | 12-10-23 | 124.30 | 13-10-22 | |
| 11-11-01 | 121.90 | 12-10-30 | 123.50 | 13-10-29 | |
| 11-11-08 | 124.70 | 12-11-06 | 121.60 | 13-11-05 | |
| 11-11-15 | 123.00 | 12-11-13 | 122.50 | 13-11-12 | |
| 11-11-22 | 120.20 | 12-11-20 | 122.20 | 13-11-19 | |
| 11-11-29 | 119.20 | 12-11-27 | 122.60 | 13-11-26 | |
| 11-12-06 | 120.50 | 12-12-04 | 120.90 | 13-12-03 | |
| 11-12-13 | 118.30 | 12-12-11 | 117.30 | 13-12-10 | |
| 11-12-20 | 116.20 | 12-12-18 | 117.70 | 13-12-17 | |
| 11-12-27 | 119.00 | 12-12-25 | 119.00 | 13-12-24 | |
| 13-12-31 |
| ¢/L | Week of: 2013-06-11 | Change from: Previous Week | Change from: Last Year |
|---|---|---|---|
| Gasoline | 132.9 | +1.9 | +6.2 |
| Diesel | 124.0 | -0.4 | +4.4 |
| Furnace Oil | 118.4 | +1.9 | +4.0 |
Source: NRCan
| 2013-06-11 | ¢/kilogram | ¢/L gasoline equivalent |
¢/L diesel equivalent |
|---|---|---|---|
| Vancouver | 119.4 | 78.8 | 81.7 |
| Edmonton | 115.1 | 75.9 | 78.7 |
| Toronto | 110.6 | 73.0 | 75.6 |
Source: ¢/kg Kent Marketing Services Limited
Recent Developments
- 2013 Hurricane Season Forecast: According to Environment Canada's Canadian Hurricane Centre (CHC), the United States' National Oceanic and Atmospheric Administration (NOAA) is predicting that this year will see an active or very active season in terms of hurricane activity in the North Atlantic Ocean. The season officially starts on June 1st. NOAA predicts a 70 percent likelihood of 13 to 20 named storms, of which 7 to 11 could become hurricanes, including 3 to 6 major hurricanes. These ranges are well above the seasonal average of 12 named storms, 6 hurricanes and 3 major hurricanes. (Source: Environment Canada)
- P.E.I. Fuel Tax Move to a Fixed Rate: On April 1, 2013 the taxes levied on gasoline and diesel oil sold in Prince Edward Island have been changed from a blended tax (fixed plus ad valorem rate) to a fixed rate of tax (13.1 and 20.2 per litre on gasoline and diesel fuel, respectively). The new method of calculating provincial tax on gasoline and diesel oil is volume based, and applies a set amount of tax to every litre of product sold. (Source: Government of Prince Edward Island)
- Proposed Kitimat Refinery: The Kitimat Clean bitumen refinery, proposed by B.C. newspaper owner David Black, would provide incremental long-term economic benefits to northwestern British Columbia compared to exporting raw crude oil, and would create sustainable refining margins that would otherwise be lost to Asian purchasers of Canadian oil, according to Navigant Consulting. (Source: Ontario Gasoline Report, National Post)
Retail Gasoline Overview
The four-week average regular gasoline pump price in selected cities across Canada was $1.32 per litre for the period ending June 11, 2013. This is an increase of 2 cents per litre from the last report on May 31, 2013, and it represents an increase of 4 cents per litre compared to the same period in 2012.
The four-week average crude oil price component of gasoline was down by less than 1 cent from two weeks ago and registered at 62 cents per litre—3 cents per litre higher than during the same period in 2012.
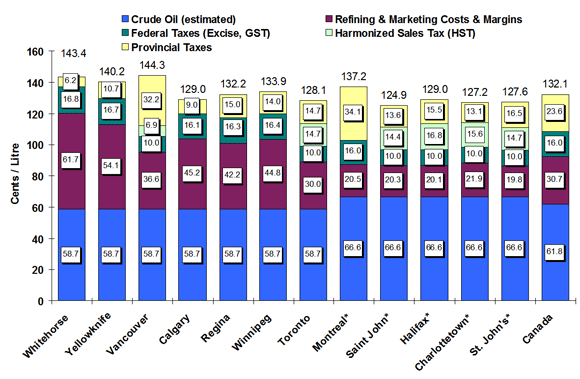
Retail gasoline prices in eastern centres increased on average by 1 cent per litre compared to the last report two weeks ago, and ranged from $1.25 per litre to $1.37 per litre. Prices in western centres increased, on average, by 4 cents per litre and ranged from $1.29 per litre to $1.44 per litre.
At the national level, refining and marketing costs rose by nearly 3 cents per litre from the previous report of two weeks ago to 31 cents per litre. The increase in wholesale gasoline prices was larger than the increase in crude oil prices resulting in higher average refining margins.
Figure 3: Regular Gasoline Pump Prices in Selected Cities
Four-Week Average (May 21 to June 11, 2013)
Text version - Figure 3
This graph shows the gasoline price components for 2 territories and 10 cities plus the national average.
| Whitehorse | Yellowknife | Vancouver | Calgary | Regina | Winnipeg | Toronto | Montreal* | Saint John* | Halifax* | Charlottetown* | St. John's* | Canada | |
|---|---|---|---|---|---|---|---|---|---|---|---|---|---|
| Pump Price | 143.4 | 140.2 | 144.3 | 129.0 | 132.2 | 133.9 | 128.1 | 137.2 | 124.9 | 129.0 | 127.2 | 127.6 | 132.1 |
| Crude (est.) | 58.7 | 58.7 | 58.7 | 58.7 | 58.7 | 58.7 | 58.7 | 66.6 | 66.6 | 66.6 | 66.6 | 66.6 | 61.8 |
| Federal Taxes | 16.8 | 16.7 | 10.0 | 16.1 | 16.3 | 16.4 | 10.0 | 16.0 | 10.0 | 10.0 | 10.0 | 10.0 | 16.0 |
| Provincial Tax | 6.2 | 10.7 | 32.2 | 9.0 | 15.0 | 14.0 | 14.7 | 34.1 | 13.6 | 15.5 | 13.1 | 16.5 | 23.6 |
| HST | 6.9 | 14.7 | 14.4 | 16.8 | 15.6 | 14.7 | |||||||
| Refining & Marketing Costs & Margins | 61.7 | 54.1 | 36.6 | 45.2 | 42.2 | 44.8 | 30.0 | 20.5 | 20.3 | 20.1 | 21.9 | 19.8 | 30.7 |
Source: NRCan
* Regulated Markets
U.S. Gasoline Demand Likely to Fall 50% Because of Generational Changes
A new study by the U.S. Public Interest Research Group (PIRG) shows that the so-called Millennial Generation, the group of 16-to-34-year-olds, is turning away from the car mania of previous North American generations—leading to a plunge in vehicle miles traveled and a decline in demand growth for new cars. Less driving, coupled with far tougher vehicle fuel efficiency standards, will likely cause U.S. gasoline demand to plummet by 50% between now and 2040, according to the study.
As the average number of miles driven by North Americans heads into its eighth year of decline, a new report from the U.S. PIRG Education Fund finds that the slowdown in driving is likely to continue, according to the group. Baby Boomers, born in the decade following World War II, are moving out of the phase in their life when they do the most commuting, while driving-averse Millennials move into that phase. The Millennial Generation is leading the change in transportation trends and, according to the PIRG, drove a whopping 23% fewer miles on average in 2009 than in 2001—the greatest decline in driving of any age group.
Source: Global Refining & Fuels Report, May 28, 2013, Volume 17, Issue 10; PIRG, A New Direction
Wholesale Gasoline Prices
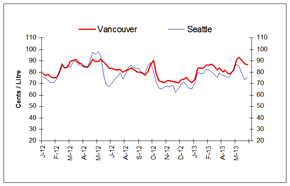
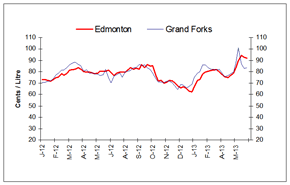
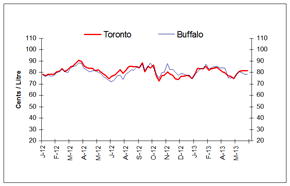
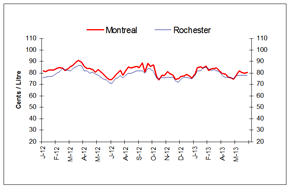
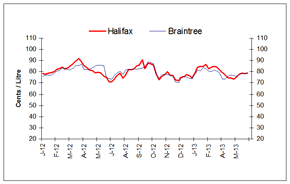
For the week of June 6, 2013, compared to the previous week, wholesale gasoline price changes ranged from a decline of 1 cent per litre to an increase of almost 3 cents per litre.
In the eastern markets of Canada and the United States, wholesale gasoline prices, compared to the previous week, registered decreases ranging from less than 1 cent per litre to increases of 1 cent per litre. Prices for the period ended in the 78-to-82-cent-per-litre range.
Western wholesale gasoline prices ended in the range of 76 to 92 cents per litre with changes ranging from a decline of 1 cent per litre to an increase of nearly 3 cents per litre. Wholesale gasoline prices in U.S. markets dropped significantly in the last three weeks as the supply equilibrium resumes. Canadian centres declined at a slower pace as Suncor completed its three-week scheduled maintenance at the Edmonton refinery and gasoline production ramped up.
Overall, in the last four weeks, prices have fluctuated widely with increases ranging from 9 cents per litre to decreases of 11 cents per litre.
Figure 4: Wholesale Gasoline Prices
Rack Terminal Prices for Selected Canadian and American Cities Ending June 6, 2013
(Can ¢/L)
 |
 |
|
 |
 |
|
 |
Text version - Figure 4
This graph shows the trend in wholesale gasoline prices for selected centres in Canada and the U.S.
| DATE | Halifax | Braintree | Montreal | Rochester | Toronto | Buffalo | Edmonton | Grand Forks | Vancouver | Seattle |
|---|---|---|---|---|---|---|---|---|---|---|
| Thu 05-Jan-12 | 78.30 | 75.98 | 81.60 | 75.96 | 78.50 | 78.12 | 72.80 | 70.73 | 78.90 | 76.05 |
| Thu 12-Jan-12 | 78.00 | 76.93 | 81.40 | 76.17 | 77.20 | 76.78 | 73.00 | 70.78 | 77.30 | 74.34 |
| Thu 19-Jan-12 | 79.00 | 77.11 | 82.60 | 76.67 | 78.40 | 77.87 | 72.70 | 71.87 | 77.90 | 72.89 |
| Thu 26-Jan-12 | 79.40 | 76.87 | 82.30 | 76.65 | 78.20 | 76.77 | 71.50 | 72.13 | 75.70 | 70.92 |
| Thu 02-Feb-12 | 80.10 | 78.57 | 82.50 | 77.46 | 78.50 | 77.55 | 73.20 | 74.13 | 75.00 | 71.02 |
| Thu 09-Feb-12 | 81.80 | 80.57 | 83.80 | 80.07 | 80.40 | 79.83 | 74.80 | 77.38 | 75.20 | 73.88 |
| hu 16-Feb-12 | 82.70 | 81.17 | 84.60 | 80.70 | 81.10 | 80.53 | 75.20 | 78.68 | 79.10 | 80.62 |
| Thu 23-Feb-12 | 84.20 | 83.12 | 84.50 | 83.26 | 83.30 | 82.83 | 78.30 | 81.53 | 86.30 | 87.84 |
| Thu 01-Mar-12 | 83.00 | 82.67 | 82.10 | 83.10 | 81.20 | 80.92 | 77.20 | 81.51 | 83.70 | 83.24 |
| Thu 08-Mar-12 | 83.20 | 81.93 | 83.40 | 82.01 | 82.20 | 79.67 | 79.00 | 84.37 | 84.20 | 86.03 |
| Thu 15-Mar-12 | 85.30 | 81.51 | 85.40 | 81.64 | 84.60 | 83.41 | 81.40 | 85.85 | 89.10 | 84.33 |
| Thu 22-Mar-12 | 87.30 | 83.23 | 86.30 | 83.69 | 86.10 | 85.62 | 82.00 | 87.65 | 90.50 | 88.72 |
| Thu 9-Mar-12 | 89.60 | 85.57 | 89.40 | 85.29 | 88.10 | 86.11 | 82.30 | 88.42 | 91.10 | 89.74 |
| Thu 05-Apr-12 | 91.80 | 85.57 | 91.00 | 86.50 | 90.90 | 88.65 | 83.50 | 86.17 | 88.00 | 86.61 |
| Thu 2-Apr-12 | 88.90 | 86.73 | 89.00 | 86.24 | 89.60 | 87.79 | 82.50 | 85.65 | 87.50 | 85.43 |
| Thu 19-Apr-12 | 85.80 | 82.15 | 85.40 | 81.69 | 86.00 | 83.66 | 80.10 | 80.61 | 85.20 | 84.31 |
| Thu 26-Apr-12 | 83.30 | 82.09 | 83.90 | 81.75 | 84.00 | 82.15 | 79.60 | 81.72 | 84.40 | 84.04 |
| Thu 03-May-12 | 81.50 | 82.57 | 84.00 | 79.72 | 83.80 | 80.81 | 79.90 | 78.77 | 86.00 | 88.50 |
| Thu 10-May-12 | 81.20 | 83.82 | 83.10 | 80.79 | 83.80 | 81.50 | 79.40 | 79.14 | 91.40 | 97.78 |
| Thu 17-May-12 | 79.10 | 85.05 | 80.60 | 78.79 | 81.50 | 81.63 | 78.50 | 77.97 | 89.20 | 95.59 |
| Thu 24-May-12 | 79.90 | 85.98 | 82.80 | 78.04 | 82.20 | 80.07 | 78.60 | 78.09 | 89.10 | 97.99 |
| Thu 31-May-12 | 79.30 | 86.07 | 80.90 | 76.24 | 80.80 | 79.07 | 80.80 | 76.64 | 91.60 | 94.29 |
| Thu 07-Jun-12 | 75.90 | 85.72 | 78.70 | 74.45 | 78.40 | 76.04 | 80.50 | 77.57 | 88.60 | 76.45 |
| Thu 14-Jun-12 | 75.00 | 75.71 | 76.30 | 74.07 | 77.10 | 74.98 | 80.80 | 82.24 | 87.00 | 69.43 |
| Thu 21-Jun-12 | 70.90 | 73.99 | 74.20 | 71.22 | 74.80 | 73.12 | 81.40 | 74.20 | 83.60 | 67.29 |
| Thu 28-Jun-12 | 71.10 | 73.37 | 74.30 | 70.57 | 76.80 | 71.79 | 79.20 | 70.40 | 83.30 | 70.25 |
| Thu 05-Jul-12 | 74.00 | 76.84 | 77.10 | 74.49 | 77.70 | 74.13 | 76.50 | 76.50 | 82.30 | 73.89 |
| Thu 12-Jul-12 | 77.00 | 79.06 | 79.90 | 75.64 | 79.70 | 77.17 | 78.90 | 77.33 | 82.00 | 75.98 |
| Thu 19-Jul-12 | 78.70 | 80.51 | 81.90 | 77.65 | 82.80 | 78.00 | 79.80 | 79.34 | 82.50 | 79.29 |
| Thu 26-Jul-12 | 74.10 | 78.00 | 78.20 | 75.33 | 79.30 | 73.91 | 79.50 | 75.41 | 79.70 | 74.08 |
| Thu 02-Aug-12 | 77.50 | 81.71 | 81.50 | 77.89 | 81.70 | 78.15 | 79.90 | 80.06 | 81.00 | 78.57 |
| Thu 09-Aug-12 | 81.80 | 82.28 | 85.00 | 80.00 | 85.20 | 80.22 | 81.90 | 80.55 | 82.50 | 84.38 |
| Thu 16-Aug-12 | 82.10 | 82.18 | 84.50 | 80.04 | 85.60 | 82.22 | 83.80 | 81.19 | 83.80 | 86.04 |
| Thu 23-Aug-12 | 82.50 | 82.70 | 85.10 | 80.56 | 84.90 | 82.09 | 82.40 | 83.57 | 82.50 | 83.89 |
| Thu 30-Aug-12 | 85.60 | 82.23 | 85.50 | 81.71 | 85.20 | 84.70 | 83.10 | 83.91 | 80.50 | 83.35 |
| Thu 06-Sep-12 | 86.00 | 82.67 | 84.60 | 81.65 | 84.30 | 84.61 | 82.40 | 86.24 | 79.70 | 83.15 |
| Thu 13-Sep-12 | 90.80 | 83.28 | 88.60 | 81.81 | 88.60 | 87.08 | 86.50 | 85.28 | 79.50 | 78.61 |
| Thu 20-Sep-12 | 82.80 | 84.03 | 80.80 | 79.82 | 80.50 | 81.33 | 83.60 | 85.93 | 77.30 | 79.04 |
| Thu 27-Sep-12 | 87.70 | 84.38 | 88.40 | 84.06 | 85.30 | 85.30 | 86.30 | 83.65 | 80.70 | 85.58 |
| Thu 04-Oct-12 | 87.30 | 84.45 | 85.40 |
83.55 | 84.20 | 88.22 | 85.00 |
81.73 | 85.90 | 88.43 |
| Thu 11-Oct-12 | 86.00 |
84.10 | 87.00 |
81.16 | 86.50 | 83.98 | 85.40 |
78.69 | 90.60 | 81.35 |
| Thu 18-Oct-12 | 77.80 | 84.33 | 77.70 | 76.05 | 77.20 | 79.28 | 76.60 | 73.80 | 78.50 | 71.33 |
| Thu 25-Oct-12 | 73.00 | 85.48 | 73.80 | 74.24 | 72.70 | 74.59 | 72.10 | 71.37 | 72.10 | 66.33 |
| Thu 01-Nov-12 | 76.30 | 85.75 | 78.10 | 76.16 | 77.40 | 79.83 | 72.60 | 71.19 | 71.60 | 65.42 |
| Thu 08-Nov-12 | 76.80 | 85.86 | 77.60 | 75.63 | 77.40 | 79.93 | 69.90 | 70.30 | 71.10 | 67.09 |
| Thu 15-Nov-12 | 80.10 | 78.06 | 81.20 | 76.45 | 80.60 | 87.66 | 70.90 | 71.58 | 72.80 | 67.68 |
| Thu 22-Nov-12 | 77.20 | 76.48 | 79.20 | 75.80 | 78.90 | 83.00 | 72.50 | 71.84 | 72.80 | 67.14 |
| Thu 29-Nov-12 | 76.70 | 76.01 | 78.30 | 76.51 | 77.50 | 82.63 | 72.10 | 70.37 | 71.30 | 68.68 |
| Thu 06-Dec-12 | 73.10 | 71.08 | 74.60 | 73.05 | 74.40 | 80.37 | 70.10 | 67.40 | 71.40 | 62.39 |
| Thu 13-Dec-12 | 72.10 | 70.22 | 74.90 | 71.94 | 73.90 | 77.52 | 67.70 | 64.43 | 70.50 | 65.70 |
| Thu 20-Dec-12 | 75.40 | 74.02 | 76.90 | 74.59 | 76.40 | 79.11 | 66.10 | 68.86 | 73.30 | 69.53 |
| Thu 27-Dec-12 | 75.80 | 76.29 | 77.10 | 76.52 | 76.80 | 78.58 | 66.70 | 67.97 | 74.00 | 71.30 |
| Thu 03-Jan-13 | 77.50 | 75.42 | 78.60 | 75.82 | 77.50 | 77.31 | 65.40 | 66.07 | 75.50 | 68.79 |
| Thu 10-Jan-13 | 76.70 | 74.48 | 77.40 | 75.49 | 76.90 | 77.88 | 63.40 | 66.67 | 72.40 | 65.77 |
| Thu 17-Jan-13 | 74.80 | 73.73 | 75.40 | 74.81 | 75.00 | 74.96 | 62.40 | 69.13 | 70.90 | 65.72 |
| Thu 13-Dec-12 | 72.10 | 70.22 | 74.90 | 71.94 | 73.90 | 77.52 | 67.70 | 64.43 | 70.50 | 65.70 |
| Thu 24-Jan-13 | 79.00 | 78.00 | 79.00 | 78.15 | 78.30 | 78.93 | 66.80 | 75.06 | 73.50 | 70.59 |
| Thu 31-Jan-13 | 84.10 | 81.70 | 84.70 | 81.81 | 83.50 | 80.51 | 72.50 | 78.85 | 83.40 | 79.19 |
| Thu 07-Feb-13 | 84.60 | 80.98 | 85.10 | 81.47 | 83.20 | 83.16 | 73.10 | 80.16 | 84.00 | 78.87 |
| Thu 14-Feb-13 | 84.50 | 83.61 | 84.20 | 84.35 | 83.20 | 83.55 | 78.10 | 86.03 | 83.30 | 79.18 |
| Thu 21-Feb-13 | 86.70 | 83.01 | 85.90 | 84.51 | 85.40 | 87.44 | 79.70 | 85.90 | 86.00 | 82.60 |
| Thu 28-Feb-13 | 82.80 | 80.41 | 81.90 | 83.34 | 81.90 | 83.14 | 80.50 | 83.70 | 86.20 | 81.99 |
| Thu 07-Mar-13 | 84.10 | 80.00 | 83.60 | 82.22 | 83.30 | 84.09 | 81.00 | 82.56 | 86.90 | 80.15 |
| Thu 14-Mar-13 | 84.60 | 81.52 | 84.00 | 83.10 | 83.90 | 85.12 | 81.70 | 82.24 | 85.40 | 78.61 |
| Thu 21-Mar-13 | 84.10 | 80.55 | 84.50 | 81.59 | 84.80 | 84.95 | 81.80 | 81.66 | 82.10 | 75.28 |
| Thu 28-Mar-13 | 82.00 | 79.08 | 81.50 | 80.79 | 82.60 | 84.24 | 80.20 | 82.51 | 83.80 | 79.62 |
| Thu 04-Apr-13 | 79.40 | 73.32 | 79.50 | 77.54 | 80.60 | 84.10 | 77.40 | 78.17 | 80.20 | 77.14 |
| Thu 11-Apr-13 | 77.30 | 73.36 | 78.90 | 75.92 | 79.80 | 83.84 | 75.90 | 75.52 | 81.50 | 76.23 |
| Thu 18-Apr-13 | 74.70 | 75.92 | 76.30 | 76.28 | 77.10 | 75.04 | 74.90 | 76.41 | 78.50 | 74.77 |
| Thu 25-Apr-13 | 74.80 | 77.01 | 75.90 | 76.42 | 76.70 | 75.40 | 76.80 | 78.08 | 79.00 | 77.56 |
| Thu 02-May-13 | 73.50 | 76.65 | 74.50 | 75.00 | 75.00 | 75.38 | 78.80 | 79.70 | 82.00 | 83.51 |
| Thu 09-May-13 | 75.10 | 76.22 | 77.60 | 77.03 | 78.50 | 77.88 | 83.90 | 87.57 | 90.80 | 87.15 |
| Thu 16-May-13 | 78.10 | 77.25 | 81.50 | 78.21 | 80.90 | 80.54 | 89.30 | 101.10 | 92.50 | 85.64 |
| Thu 23-May-13 | 78.60 | 78.37 | 80.50 | 78.09 | 81.30 | 79.53 | 94.20 | 86.80 | 90.30 | 78.24 |
| Thu 30-May-13 | 78.40 | 78.36 | 79.80 | 77.90 | 81.40 | 78.43 | 92.60 | 82.64 | 87.60 | 73.33 |
| Thu 06-Jun-13 | 78.70 | 78.91 | 80.50 | 78.17 | 81.60 | 78.16 | 92.40 | 83.64 | 86.60 | 76.00 |
Sources: NRCan, Bloomberg Oil Buyers Guide
Reinventing the Gasoline Station
Propel Fuels of Fresno, California, has opened a refuelling station that offers E85 flex fuel and biodiesel, which are sourced from local California producers, along with conventional fuels.
Propel Fuels also offers to purchase carbon offset at the pump, effectively offsetting the carbon emissions associated with the fuel purchase by directly funding clean air projects.
(Source: Propel Fuels)
Gasoline Refining and Marketing Margins
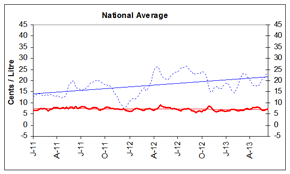
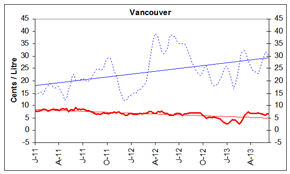
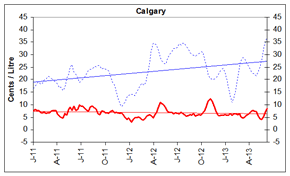
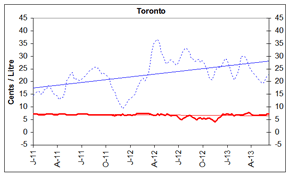
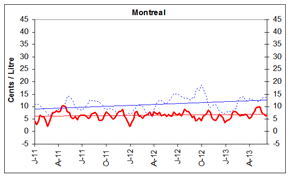
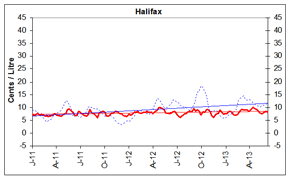
Four-week rolling averages are used for gasoline refining and marketing margins. Overall, for the week ending June 11, 2013, refining margins hovered at 23 cents per litre—less than 1 cent per litre higher than for the same period in June 2012.
The refining margins shown here are derived numbers based on the difference between the estimated crude oil price and the wholesale price of gasoline at a point in time. While the analysis presented here is useful for tracking the trends in gasoline margins and estimating how much of the pump price is going to the refiner, it does not represent overall refining margins when considering all refinery products (e.g. gasoline, diesel, asphalt, lubricating oil, etc.).
Gasoline, accounting for about 30-35% of a refinery’s output, is only one of many products produced from a barrel of crude oil. As one of the higher-valued products, gasoline generates a disproportionate share of the revenues. Gasoline margins are offset by much lower margins on other products such as heavy fuel oil and asphalt that often sell for less than the cost of the crude oil used to make them.
Figure 5: Gasoline Refining and Marketing Margins
Four-Week Rolling Average Ending June 11, 2013
_________ Refining Margin _______ Marketing Margin
 |
 |
|
 |
 |
|
 |
 |
Text version - Figure 5
These graphs show the trend in refining and marketing costs and margins for selected centres in Canada and the national average.
| 4-week rolling average | Canada | Vancouver | Calgary | Toronto | Montreal | Halifax | ||||||
|---|---|---|---|---|---|---|---|---|---|---|---|---|
| Marketing Margin | Refining Margin | Marketing Margin | Refining Margin | Marketing Margin | Refining Margin | Marketing Margin | Refining Margin | Marketing Margin | Refining Margin | Marketing Margin | Refining Margin | |
| 2011-01-04 | 6.8 | 12.7 | 8.0 | 14.4 | 7.5 | 16.6 | 7.1 | 14.4 | 4.1 | 11.0 | 7.4 | 9.0 |
| 2011-01-11 | 6.8 | 13.2 | 7.6 | 14.8 | 8.1 | 17.5 | 7.0 | 15.4 | 2.9 | 11.1 | 6.9 | 8.8 |
| 2011-01-18 | 6.6 | 13.7 | 7.9 | 15.1 | 7.7 | 18.7 | 7.1 | 16.0 | 4.3 | 11.1 | 7.2 | 8.7 |
| 2011-01-25 | 6.9 | 14.1 | 8.2 | 15.6 | 7.8 | 19.2 | 7.0 | 16.1 | 6.7 | 10.3 | 7.7 | 7.9 |
| 2011-02-01 | 7.6 | 14.0 | 8.3 | 14.5 | 6.9 | 18.2 | 7.0 | 15.0 | 6.0 | 9.7 | 7.1 | 7.2 |
| 2011-02-08 | 7.3 | 13.1 | 8.6 | 15.1 | 6.9 | 18.7 | 7.0 | 15.3 | 5.9 | 9.0 | 7.3 | 6.4 |
| 2011-02-15 | 7.4 | 13.1 | 8.3 | 17.0 | 7.1 | 19.9 | 7.0 | 16.7 | 4.5 | 8.2 | 7.2 | 5.9 |
| 2011-02-22 | 7.2 | 13.6 | 7.9 | 17.7 | 6.7 | 20.1 | 7.0 | 17.2 | 2.1 | 7.2 | 6.6 | 4.9 |
| 2011-03-01 | 6.5 | 13.5 | 8.1 | 18.9 | 6.8 | 21.3 | 7.0 | 18.3 | 4.1 | 6.3 | 6.7 | 4.3 |
| 2011-03-08 | 6.9 | 13.8 | 8.3 | 18.3 | 6.8 | 21.2 | 7.0 | 17.8 | 5.9 | 6.8 | 6.4 | 4.9 |
| 2011-03-15 | 7.2 | 13.8 | 8.6 | 17.3 | 7.6 | 20.4 | 7.0 | 16.1 | 7.7 | 6.9 | 6.9 | 5.3 |
| 2011-03-22 | 7.7 | 13.1 | 8.4 | 17.0 | 7.8 | 19.3 | 7.0 | 15.0 | 7.6 | 7.7 | 7.0 | 6.4 |
| 2011-03-29 | 7.7 | 12.8 | 8.3 | 17.9 | 7.7 | 19.2 | 7.0 | 14.8 | 8.4 | 8.7 | 7.5 | 7.5 |
| 2011-04-05 | 7.8 | 13.2 | 8.1 | 17.4 | 6.1 | 18.2 | 7.0 | 14.2 | 7.8 | 8.8 | 7.0 | 7.9 |
| 2011-04-12 | 7.4 | 12.8 | 8.5 | 15.5 | 5.7 | 16.7 | 7.1 | 12.8 | 8.1 | 8.9 | 6.9 | 8.0 |
| 2011-04-19 | 7.4 | 11.9 | 8.9 | 14.4 | 4.9 | 17.0 | 7.1 | 13.9 | 10.4 | 9.6 | 6.6 | 8.8 |
| 2011-04-26 | 7.7 | 12.6 | 8.6 | 12.2 | 4.6 | 15.9 | 7.1 | 13.9 | 10.2 | 10.1 | 6.6 | 9.2 |
| 2011-05-03 | 7.6 | 12.5 | 8.9 | 12.9 | 6.6 | 17.0 | 7.0 | 16.0 | 10.1 | 11.6 | 7.2 | 10.9 |
| 2011-05-10 | 8.0 | 14.2 | 7.5 | 16.6 | 5.8 | 20.5 | 7.0 | 20.5 | 7.8 | 14.2 | 7.6 | 12.5 |
| 2011-05-17 | 7.3 | 17.8 | 8.3 | 18.3 | 8.1 | 22.1 | 7.0 | 21.4 | 7.7 | 14.1 | 9.3 | 12.2 |
| 2011-05-24 | 8.0 | 18.5 | 8.3 | 21.5 | 9.1 | 25.0 | 6.9 | 23.3 | 5.8 | 13.4 | 9.5 | 10.9 |
| 2011-05-31 | 7.9 | 19.7 | 8.1 | 22.6 | 7.8 | 26.1 | 7.0 | 23.5 | 5.3 | 12.3 | 8.5 | 9.2 |
| 2011-06-07 | 7.6 | 19.7 | 9.3 | 20.3 | 9.6 | 23.1 | 7.0 | 21.0 | 5.8 | 9.6 | 8.2 | 6.9 |
| 2011-06-14 | 8.3 | 17.0 | 8.4 | 20.3 | 7.8 | 22.3 | 7.0 | 20.9 | 4.6 | 9.0 | 6.8 | 6.3 |
| 2011-06-21 | 7.5 | 16.5 | 8.6 | 20.3 | 8.2 | 20.9 | 7.1 | 20.7 | 5.9 | 9.4 | 7.0 | 7.0 |
| 2011-06-28 | 7.8 | 16.3 | 8.3 | 20.5 | 9.9 | 19.0 | 7.0 | 20.3 | 6.6 | 8.5 | 8.4 | 6.3 |
| 2011-07-05 | 8.4 | 15.5 | 8.5 | 20.8 | 9.4 | 19.6 | 7.1 | 21.0 | 6.7 | 8.7 | 7.9 | 6.1 |
| 2011-07-12 | 8.2 | 15.9 | 8.3 | 20.6 | 9.5 | 20.2 | 7.1 | 21.6 | 6.8 | 9.7 | 7.2 | 6.7 |
| 2011-07-19 | 8.1 | 16.4 | 8.2 | 19.8 | 8.8 | 21.0 | 7.0 | 22.2 | 6.1 | 10.3 | 6.9 | 7.3 |
| 2011-07-26 | 7.6 | 16.9 | 8.1 | 19.7 | 7.7 | 22.5 | 7.1 | 23.0 | 5.3 | 11.4 | 6.7 | 8.5 |
| 2011-08-02 | 7.2 | 17.8 | 7.7 | 20.5 | 7.7 | 23.9 | 6.9 | 24.1 | 5.4 | 12.7 | 7.2 | 10.1 |
| 2011-08-09 | 7.1 | 18.9 | 7.5 | 22.0 | 9.3 | 24.1 | 6.9 | 24.5 | 7.1 | 12.4 | 9.2 | 10.0 |
| 2011-08-16 | 7.8 | 19.1 | 6.8 | 23.4 | 9.4 | 24.4 | 6.8 | 25.3 | 7.3 | 12.5 | 7.9 | 10.0 |
| 2011-08-23 | 7.8 | 19.6 | 6.5 | 24.5 | 8.7 | 25.5 | 6.8 | 25.8 | 7.6 | 12.3 | 7.6 | 9.7 |
| 2011-08-30 | 7.7 | 20.1 | 6.6 | 24.8 | 8.3 | 25.3 | 6.9 | 25.2 | 6.6 | 11.9 | 7.2 | 9.1 |
| 2011-09-06 | 7.5 | 19.7 | 6.5 | 24.6 | 6.4 | 25.8 | 6.9 | 25.2 | 4.4 | 12.0 | 5.8 | 9.4 |
| 2011-09-13 | 6.7 | 19.9 | 6.8 | 24.4 | 6.2 | 25.5 | 7.0 | 24.0 | 4.4 | 11.2 | 7.8 | 8.9 |
| 2011-09-20 | 6.8 | 19.2 | 7.2 | 25.1 | 7.5 | 24.1 | 6.9 | 22.7 | 4.7 | 10.5 | 8.1 | 8.3 |
| 2011-09-27 | 7.3 | 18.2 | 6.8 | 27.8 | 7.2 | 24.7 | 6.9 | 23.4 | 6.5 | 9.4 | 8.5 | 7.4 |
| 2011-10-04 | 7.6 | 18.4 | 7.0 | 29.0 | 6.9 | 24.2 | 6.9 | 22.7 | 7.8 | 9.0 | 8.2 | 6.7 |
| 2011-10-11 | 8.0 | 17.9 | 6.7 | 29.5 | 6.8 | 24.0 | 6.9 | 21.9 | 7.4 | 8.9 | 6.6 | 6.5 |
| 2011-10-18 | 7.7 | 17.6 | 7.0 | 29.0 | 6.7 | 23.5 | 6.9 | 21.5 | 6.8 | 9.3 | 6.5 | 6.9 |
| 2011-10-25 | 7.5 | 17.4 | 7.2 | 26.5 | 7.4 | 21.1 | 6.8 | 18.6 | 5.6 | 9.1 | 7.1 | 7.0 |
| 2011-11-01 | 7.4 | 15.7 | 7.3 | 23.8 | 7.7 | 19.0 | 6.8 | 16.6 | 4.9 | 8.6 | 7.7 | 6.4 |
| 2011-11-08 | 7.4 | 14.2 | 7.2 | 22.4 | 7.0 | 17.8 | 6.4 | 15.8 | 5.6 | 8.3 | 7.9 | 6.0 |
| 2011-11-15 | 7.3 | 13.4 | 7.5 | 19.5 | 7.2 | 15.0 | 7.0 | 13.1 | 7.2 | 7.1 | 8.4 | 4.8 |
| 2011-11-22 | 7.4 | 11.2 | 7.4 | 16.7 | 6.9 | 12.8 | 6.9 | 11.8 | 8.2 | 6.5 | 8.3 | 3.8 |
| 2011-11-29 | 7.0 | 10.1 | 6.6 | 14.6 | 6.6 | 10.7 | 6.8 | 10.6 | 8.2 | 6.3 | 7.6 | 3.4 |
| 2011-12-06 | 7.1 | 8.9 | 6.9 | 12.3 | 6.7 | 9.2 | 7.2 | 9.3 | 8.8 | 6.1 | 7.5 | 3.3 |
| 2011-12-13 | 7.3 | 7.6 | 6.2 | 12.2 | 6.0 | 10.1 | 6.6 | 10.3 | 6.7 | 6.7 | 6.8 | 3.7 |
| 2011-12-20 | 6.8 | 8.0 | 6.2 | 12.4 | 4.6 | 11.5 | 6.8 | 11.0 | 5.3 | 6.7 | 6.7 | 4.0 |
| 2011-12-27 | 6.4 | 9.1 | 6.8 | 14.0 | 4.3 | 13.5 | 7.0 | 12.6 | 3.7 | 7.3 | 6.5 | 4.8 |
| 2012-01-03 | 6.1 | 10.4 | 6.9 | 14.1 | 4.6 | 13.9 | 6.9 | 13.0 | 1.9 | 7.1 | 7.3 | 4.4 |
| 2012-01-10 | 6.1 | 11.3 | 6.4 | 14.9 | 3.0 | 14.2 | 6.7 | 13.8 | 3.7 | 7.5 | 7.1 | 5.0 |
| 2012-01-17 | 6.5 | 11.8 | 6.4 | 15.4 | 4.0 | 14.1 | 6.9 | 14.5 | 5.1 | 8.7 | 7.2 | 6.0 |
| 2012-01-24 | 7.3 | 11.5 | 6.3 | 15.1 | 5.0 | 13.6 | 7.0 | 14.9 | 7.5 | 9.1 | 8.3 | 6.5 |
| 2012-01-31 | 7.6 | 12.3 | 6.7 | 16.6 | 5.0 | 15.0 | 7.4 | 17.3 | 8.0 | 10.6 | 8.2 | 8.1 |
| 2012-02-07 | 7.2 | 13.6 | 6.8 | 16.6 | 5.2 | 16.5 | 7.4 | 18.9 | 6.2 | 10.6 | 8.4 | 8.2 |
| 2012-02-14 | 7.0 | 15.2 | 6.8 | 17.4 | 4.8 | 17.9 | 7.3 | 20.8 | 6.1 | 10.3 | 7.8 | 8.4 |
| 2012-02-21 | 6.6 | 16.2 | 6.9 | 18.5 | 3.9 | 18.6 | 7.5 | 21.4 | 5.1 | 10.1 | 7.9 | 8.7 |
| 2012-02-28 | 6.8 | 16.9 | 6.8 | 19.3 | 3.9 | 17.7 | 7.3 | 20.3 | 6.5 | 8.8 | 8.0 | 8.2 |
| 2012-03-06 | 7.1 | 15.4 | 7.2 | 22.2 | 4.9 | 18.9 | 7.3 | 21.6 | 6.7 | 7.7 | 8.1 | 7.9 |
| 2012-03-13 | 7.3 | 16.2 | 7.5 | 26.6 | 5.6 | 22.4 | 7.4 | 23.8 | 6.9 | 6.9 | 8.4 | 7.6 |
| 2012-03-20 | 7.5 | 18.1 | 7.5 | 31.2 | 6.0 | 26.7 | 7.2 | 27.6 | 7.8 | 6.4 | 8.0 | 7.3 |
| 2012-03-27 | 6.9 | 20.1 | 7.1 | 36.2 | 5.6 | 31.9 | 6.9 | 32.5 | 6.3 | 6.9 | 8.0 | 7.7 |
| 2012-04-03 | 6.8 | 24.3 | 6.8 | 39.0 | 4.8 | 34.7 | 6.7 | 35.3 | 7.8 | 8.7 | 7.6 | 9.6 |
| 2012-04-10 | 7.1 | 25.8 | 7.1 | 38.3 | 5.8 | 34.4 | 6.8 | 36.2 | 7.4 | 10.4 | 8.4 | 11.4 |
| 2012-04-17 | 7.5 | 26.2 | 7.5 | 37.4 | 7.2 | 33.9 | 7.0 | 36.6 | 6.9 | 12.1 | 8.8 | 13.1 |
| 2012-04-24 | 8.0 | 25.7 | 7.4 | 34.4 | 9.0 | 31.8 | 6.7 | 34.9 | 7.6 | 12.4 | 10.0 | 13.3 |
| 2012-05-01 | 9.3 | 23.3 | 7.8 | 31.6 | 11.0 | 28.9 | 7.0 | 32.0 | 6.5 | 12.6 | 9.8 | 12.6 |
| 2012-05-08 | 8.7 | 21.7 | 7.2 | 31.0 | 10.5 | 27.3 | 6.9 | 29.5 | 6.6 | 12.0 | 9.8 | 11.3 |
| 2012-05-15 | 8.4 | 20.7 | 6.8 | 32.0 | 9.7 | 26.3 | 6.6 | 27.5 | 6.8 | 11.2 | 9.2 | 10.1 |
| 2012-05-22 | 8.0 | 20.6 | 7.0 | 33.2 | 8.6 | 26.3 | 7.0 | 27.0 | 5.9 | 11.4 | 7.8 | 9.7 |
| 2012-05-29 | 8.1 | 20.5 | 6.2 | 37.0 | 7.4 | 28.4 | 6.8 | 28.0 | 7.0 | 12.0 | 7.8 | 10.1 |
| 2012-06-05 | 8.0 | 21.8 | 6.1 | 38.6 | 7.1 | 30.0 | 6.5 | 28.5 | 6.3 | 13.2 | 7.6 | 10.9 |
| 2012-06-12 | 7.5 | 22.8 | 6.2 | 37.9 | 7.0 | 30.9 | 6.7 | 27.8 | 6.2 | 14.0 | 7.9 | 11.5 |
| 2012-06-19 | 7.8 | 23.3 | 6.7 | 38.0 | 6.3 | 32.5 | 6.7 | 27.5 | 8.0 | 15.3 | 8.3 | 12.9 |
| 2012-06-26 | 7.6 | 23.7 | 6.8 | 35.7 | 6.8 | 32.5 | 6.6 | 26.5 | 6.9 | 15.2 | 8.4 | 12.9 |
| 2012-07-03 | 7.3 | 23.7 | 7.0 | 34.9 | 6.5 | 33.0 | 6.1 | 27.0 | 6.6 | 14.8 | 7.3 | 12.1 |
| 2012-07-10 | 7.0 | 24.5 | 6.6 | 35.3 | 6.3 | 34.4 | 5.3 | 29.0 | 7.4 | 14.7 | 6.4 | 11.8 |
| 2012-07-17 | 6.6 | 25.8 | 5.9 | 34.9 | 7.0 | 34.0 | 4.9 | 30.9 | 6.3 | 14.0 | 6.2 | 10.7 |
| 2012-07-24 | 7.1 | 25.9 | 6.7 | 35.0 | 6.6 | 34.6 | 5.4 | 32.5 | 7.7 | 13.6 | 6.9 | 10.3 |
| 2012-07-31 | 7.6 | 26.1 | 6.6 | 34.3 | 6.2 | 34.6 | 5.8 | 33.3 | 9.0 | 13.4 | 7.5 | 10.4 |
| 2012-08-07 | 7.5 | 26.6 | 6.8 | 32.0 | 5.3 | 33.2 | 6.3 | 32.7 | 8.1 | 13.5 | 7.6 | 9.9 |
| 2012-08-14 | 7.6 | 25.4 | 7.1 | 30.2 | 5.5 | 32.4 | 6.7 | 31.2 | 8.2 | 13.0 | 8.4 | 9.3 |
| 2012-08-21 | 7.2 | 24.5 | 7.1 | 27.9 | 6.1 | 30.7 | 6.3 | 29.3 | 6.9 | 12.8 | 8.4 | 8.8 |
| 2012-08-28 | 6.5 | 23.9 | 7.1 | 26.4 | 6.0 | 30.0 | 5.8 | 28.8 | 5.8 | 13.6 | 8.2 | 9.9 |
| 2012-09-04 | 6.5 | 22.7 | 7.1 | 25.2 | 6.5 | 29.7 | 5.5 | 27.9 | 6.1 | 13.4 | 9.6 | 10.9 |
| 2012-09-11 | 5.6 | 23.3 | 7.0 | 23.6 | 5.3 | 29.3 | 4.8 | 28.3 | 4.2 | 15.9 | 8.4 | 13.5 |
| 2012-09-18 | 6.1 | 23.3 | 7.2 | 22.8 | 5.9 | 30.1 | 5.4 | 28.8 | 4.8 | 17.3 | 9.0 | 15.8 |
| 2012-09-25 | 6.5 | 22.9 | 7.0 | 22.3 | 6.2 | 30.4 | 5.7 | 27.6 | 5.4 | 16.4 | 8.8 | 16.4 |
| 2012-10-02 | 5.9 | 24.2 | 6.3 | 23.3 | 6.0 | 31.2 | 5.3 | 28.3 | 4.3 | 18.7 | 7.0 | 18.5 |
| 2012-10-09 | 6.6 | 23.8 | 5.7 | 25.6 | 6.9 | 31.1 | 5.4 | 27.5 | 6.1 | 17.4 | 8.4 | 17.9 |
| 2012-10-16 | 6.7 | 22.9 | 4.7 | 26.6 | 7.3 | 29.3 | 5.2 | 26.3 | 6.8 | 15.7 | 8.0 | 16.6 |
| 2012-10-23 | 7.5 | 20.4 | 5.1 | 24.4 | 9.1 | 25.9 | 5.5 | 23.7 | 7.2 | 14.0 | 9.3 | 14.3 |
| 2012-10-30 | 8.5 | 17.2 | 5.5 | 21.6 | 11.4 | 22.0 | 5.5 | 20.9 | 8.6 | 10.3 | 9.3 | 10.3 |
| 2012-11-06 | 8.3 | 14.8 | 5.1 | 18.7 | 12.4 | 20.3 | 5.1 | 20.8 | 7.9 | 9.6 | 8.5 | 8.6 |
| 2012-11-13 | 7.3 | 15.1 | 5.4 | 17.2 | 11.5 | 19.3 | 4.6 | 21.7 | 5.2 | 10.4 | 6.7 | 8.7 |
| 2012-11-20 | 6.3 | 16.8 | 5.1 | 18.2 | 9.4 | 20.0 | 4.1 | 24.4 | 4.7 | 10.8 | 6.1 | 8.9 |
| 2012-11-27 | 6.0 | 17.2 | 5.0 | 18.7 | 7.3 | 21.2 | 4.9 | 25.5 | 4.4 | 10.8 | 7.4 | 8.9 |
| 2012-12-04 | 6.2 | 17.2 | 4.8 | 20.1 | 5.8 | 21.8 | 5.8 | 25.7 | 5.5 | 9.9 | 7.5 | 8.6 |
| 2012-12-11 | 6.5 | 16.3 | 4.3 | 19.3 | 5.5 | 21.0 | 6.1 | 24.0 | 6.9 | 7.9 | 9.1 | 6.3 |
| 2012-12-18 | 6.7 | 16.6 | 3.6 | 23.2 | 5.8 | 24.0 | 7.1 | 27.1 | 6.5 | 7.8 | 8.0 | 6.0 |
| 2012-12-25 | 6.4 | 17.7 | 3.0 | 25.6 | 5.8 | 24.4 | 6.8 | 28.8 | 5.4 | 7.5 | 7.4 | 5.8 |
| 2013-01-01 | 6.2 | 18.6 | 2.8 | 25.9 | 6.1 | 23.1 | 7.1 | 28.9 | 3.6 | 7.3 | 7.7 | 5.6 |
| 2013-01-08 | 6.4 | 19.0 | 2.7 | 24.5 | 6.0 | 19.8 | 7.1 | 27.6 | 4.4 | 8.0 | 7.5 | 6.6 |
| 2013-01-15 | 6.5 | 17.5 | 3.5 | 22.2 | 5.9 | 16.3 | 6.8 | 25.5 | 4.6 | 8.2 | 8.5 | 7.2 |
| 2013-01-22 | 6.9 | 15.6 | 4.4 | 20.2 | 6.3 | 14.3 | 7.0 | 23.9 | 5.5 | 8.3 | 8.5 | 7.6 |
| 2013-01-29 | 6.9 | 15.0 | 4.2 | 16.8 | 5.8 | 11.0 | 6.5 | 20.7 | 7.7 | 8.4 | 7.6 | 7.9 |
| 2013-02-05 | 7.0 | 14.6 | 4.2 | 18.2 | 6.4 | 12.3 | 6.8 | 21.1 | 8.1 | 9.5 | 7.1 | 9.2 |
| 2013-02-12 | 6.8 | 16.2 | 3.4 | 22.2 | 6.4 | 16.1 | 6.9 | 23.6 | 7.8 | 9.4 | 7.1 | 9.1 |
| 2013-02-19 | 6.4 | 18.5 | 2.4 | 25.6 | 6.2 | 19.9 | 6.8 | 25.7 | 7.0 | 11.0 | 7.4 | 10.8 |
| 2013-02-26 | 6.6 | 20.8 | 3.4 | 31.1 | 6.3 | 26.0 | 7.0 | 30.0 | 6.3 | 13.7 | 8.6 | 13.6 |
| 2013-03-05 | 6.7 | 22.7 | 4.7 | 32.0 | 5.2 | 27.8 | 7.0 | 30.1 | 6.7 | 13.9 | 9.3 | 14.0 |
| 2013-03-12 | 6.8 | 23.3 | 5.8 | 32.1 | 4.7 | 28.9 | 7.1 | 29.7 | 6.8 | 14.3 | 9.0 | 14.6 |
| 2013-03-19 | 7.2 | 23.1 | 7.0 | 31.5 | 5.1 | 29.1 | 7.4 | 29.4 | 6.8 | 12.3 | 9.1 | 12.8 |
| 2013-03-26 | 7.5 | 21.7 | 7.3 | 27.8 | 6.0 | 26.5 | 7.8 | 26.4 | 6.7 | 12.3 | 9.0 | 12.9 |
| 2013-04-02 | 7.1 | 20.9 | 6.9 | 26.5 | 6.4 | 25.8 | 7.5 | 25.6 | 5.2 | 12.6 | 8.4 | 12.9 |
| 2013-04-09 | 7.3 | 19.4 | 6.8 | 24.2 | 7.4 | 23.6 | 6.8 | 24.1 | 5.7 | 13.2 | 9.2 | 12.6 |
| 2013-04-16 | 7.8 | 17.9 | 6.9 | 22.7 | 7.7 | 21.6 | 6.7 | 22.2 | 7.2 | 11.6 | 10.1 | 10.5 |
| 2013-04-23 | 7.9 | 17.6 | 7.0 | 23.6 | 7.3 | 22.4 | 6.6 | 22.5 | 8.4 | 12.6 | 9.5 | 11.1 |
| 2013-04-30 | 8.2 | 17.6 | 7.2 | 24.1 | 7.4 | 22.9 | 6.8 | 22.2 | 9.5 | 12.2 | 9.2 | 10.6 |
| 2013-05-07 | 7.8 | 17.9 | 6.8 | 24.4 | 5.6 | 23.0 | 6.9 | 20.1 | 9.9 | 12.1 | 8.3 | 10.3 |
| 2013-05-14 | 7.4 | 19.2 | 6.7 | 27.0 | 4.4 | 25.1 | 6.9 | 19.3 | 10.2 | 12.4 | 7.8 | 10.2 |
| 2013-05-21 | 6.6 | 20.7 | 6.3 | 29.2 | 4.1 | 28.2 | 7.0 | 19.6 | 7.7 | 13.4 | 7.6 | 10.7 |
| 2013-05-28 | 6.7 | 21.3 | 6.3 | 31.3 | 5.4 | 32.2 | 7.0 | 20.8 | 6.9 | 13.8 | 8.1 | 10.9 |
| 2013-06-04 | 7.0 | 22.6 | 6.6 | 31.4 | 7.2 | 35.6 | 7.2 | 22.0 | 6.3 | 13.7 | 8.4 | 11.2 |
| 2013-06-11 | 7.3 | 23.3 | 6.8 | 29.9 | 8.5 | 36.8 | 7.2 | 22.9 | 6.4 | 13.9 | 8.1 | 11.8 |
| 2013-06-04 | 7.0 | 22.6 | 6.6 | 31.4 | 7.2 | 35.6 | 7.2 | 22.0 | 6.3 | 13.7 | 8.4 | 11.2 |
| 2013-06-11 | 7.3 | 23.3 | 6.8 | 29.9 | 8.5 | 36.8 | 7.2 | 22.9 | 6.4 | 13.9 | 8.1 | 11.8 |
Source: NRCan
Crude Oil Overview
Global Crude Oil Prices Hover in a Narrow Range
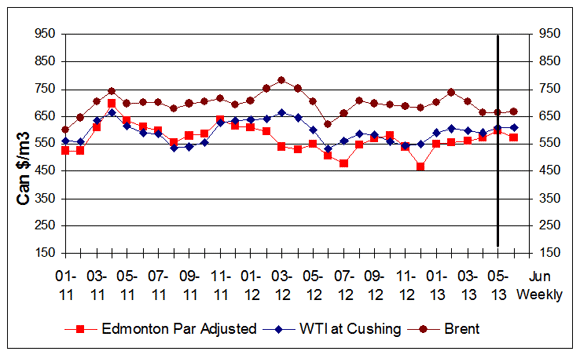
For the week ending June 7, 2013, prices for the three marker crudes averaged between $573/m3 and $668/m3, (US$89 to US$103 per barrel). The price gap between WTI and Brent stood at $59/m3 (US$9), while the price differential between Edmonton Par and WTI has increased slightly. In May, the Edmonton Par crude had reached its highest level since February 2012.
Global crude oil prices hovered in a narrow range for the week ending June 7, 2013. U.S. crude oil and gasoline inventories continue to fluctuate at near or above their five-year average range, helping to moderate the price increase.
Overall crude oil prices remain buoyant in many ways despite some shift in the key factors affecting Brent and WTI. This is partly due to factors such as increasing North American crude oil flowing by rail cars to refiners while European refinery maintenance put downward pressure on Brent prices. A hesitant global economic recovery further contributes to dampen crude oil prices.
The decision by the ministers of the Organization of the Petroleum Exporting Countries to maintain production quotas at 30 million barrels per day also contributed in moderating the price fluctuation.
Figure 6: Crude Oil Price Comparisons
Text version - Figure 6
This graph shows crude oil prices for Edmonton Par, WTI and Brent. The average weekly prices for the period ending June 7, 2013, were $573/cubic metres, $610/cubic metres and $668/cubic metres for Edmonton Par, WTI and Brent, respectively.
| Dates | Edmonton Par Prices | WTI Prices | Brent Prices |
|---|---|---|---|
| 01/11 | 525.08 | 559.18 | 601.95 |
| 02/11 | 525.75 | 556.16 | 645.23 |
| 03/11 | 609.96 | 632.59 | 703.16 |
| 04/11 | 696.77 | 662.59 | 741.59 |
| 05/11 | 634.91 | 617.17 | 697.06 |
| 06/11 | 614.21 | 591.76 | 699.64 |
| 07/11 | 599.18 | 585.28 | 701.96 |
| 08/11 | 554.74 | 533.58 | 679.51 |
| 09/11 | 578.01 | 538.55 | 696.18 |
| 10/11 | 585.88 | 554.72 | 702.66 |
| 11/11 | 636.41 | 627.49 | 713.92 |
| 12/11 | 615.54 | 633.97 | 693.85 |
| 01/12 | 608.11 | 639.88 | 709.45 |
| 02/12 | 594.50 | 640.89 | 750.59 |
| 03/12 | 538.60 | 663.34 | 780.71 |
| 04/12 | 528.21 | 644.60 | 751.91 |
| 05/12 | 548.81 | 601.64 | 704.10 |
| 06/12 | 507.78 | 532.76 | 618.43 |
| 07/12 | 477.07 | 560.69 | 659.07 |
| 08/12 | 544.82 | 587.49 | 707.75 |
| 09/12 | 570.15 | 582.08 | 697.56 |
| 10/12 | 578.61 | 555.66 | 694.60 |
| 11/12 | 539.87 | 543.52 | 686.30 |
| 12/12 | 467.14 | 549.56 | 680.33 |
| 01/13 | 549.97 | 592.14 | 699.83 |
| 02/13 | 553.76 | 605.29 | 736.06 |
| 03/13 | 560.66 | 598.93 | 705.36 |
| 04/13 | 571.20 | 590.06 | 663.78 |
| 05/13 | 598.81 | 608.31 | 662.59 |
| June 7, 2013 | 573.31 | 609.83 | 668.36 |
| Crude Oil Types | Week Ending: 2013-06-07 | Change From: | ||||
|---|---|---|---|---|---|---|
| Previous Week | Last Year | |||||
| $Can/m3 | $US/bbl | $Can/m3 | $US/bbl | $Can/m3 | $US/bbl | |
| Edmonton Par | 573.31 | 88.61 | -25.00 | -3.36 | +60.87 | +9.81 |
| WTI | 609.83 | 94.26 | +1.74 | +0.83 | +60.59 | +9.82 |
| Brent | 668.36 | 103.30 | +2.47 | +0.99 | +21.81 | +3.90 |
Source: NRCan
OPEC to Maintain Crude Oil Production Level
The 163rd Meeting of the Conference of the Organization of the Petroleum Exporting Countries (OPEC) was held in Vienna, Austria, on May 31, 2013.
Some of the highlights of the conference were as follows: oil market developments, in particular supply/demand projections, as well as the outlook for the second half of 2013, and the relative steadiness of prices during 2013 to-date was an indication that the market was adequately supplied, the periodic price fluctuations being a reflection of geopolitical tensions.
While world oil demand is expected to rise from 88.9 million barrels a day in 2012 to 89.7 million barrels per day (mb/d) in 2013, driven almost entirely by non-OECD regions, non-OPEC supply is projected to grow by 1.0 mb/d. Additionally, OECD stock levels remain comfortable. Taking these developments into account, the second half of the year could see a further easing in fundamentals, despite seasonally-higher demand.
In light of these developments, Member Countries decided to hold to the existing production ceiling of 30 mb/d.
Source: OPEC press release
Supplement
Benchmark Crude Oil Price Differentials
Over the past year, a range of estimates, using different methodologies, has been published on the revenue implications of abnormal differentials between the higher prices of global crudes and lower prices for Canadian crudes of similar quality. These differentials are due to growing North American oil production and insufficient pipeline infrastructure. As Canadian crude oil production is expected to double by 2030, additional pipeline capacity will be critical to ensure this problem does not worsen. NRCan estimates crude oil export revenue losses1 (using historical data) at $13.3 billion in 2012.
Analyses undertaken in 2012 focused on key benchmark crude oil differentials: 1) West Texas Intermediate (WTI) versus North Sea Brent; 2) WTI versus Western Canada Select (WCS); and 3) WCS versus other heavy crudes.
1)WTI vs. Brent
WTI and Brent are two similar-quality light crude oils whose prices serve as benchmarks for North American and international crude oil, respectively. For decades, these two benchmarks were within a dollar or two of each other, with WTI typically selling for $1 per barrel (bbl) more than Brent.
In 2010, WTI and Brent prices began to diverge. In North America, growing U.S. and Canadian production exceeded mid-continental refining capacity, and pipeline capacity to coastal refineries was insufficient to handle increasing supply. Hence, crude oil became locked in the mid-continent, causing North American crude prices to drop. Meanwhile, international prices remained strong, driven by continued growth in China, India and other emerging economies. In 2012, Brent averaged US$17/bbl higher than WTI, an abnormal situation given that WTI had averaged $1/bbl higher than Brent from 2005 to 2010.
2)WTI vs. WCS
Western Canada Select (WCS) is the benchmark price for Canadian heavy oil. WCS normally sells at a discount to WTI, reflecting the quality difference between light and heavy oil. The typical WCS discount compared to WTI over 2005–2010 averaged approximately $15/bbl. However, the WTI–WCS differential has been volatile since 2010, ranging from $7 to $41/bbl. Increasing supply from the oil sands and insufficient pipeline capacity to the Gulf Coast has depressed heavy oil prices relative to light. In 2012, the WTI–WCS differential averaged $21 and temporarily eclipsed $40/bbl.
3)WCS vs. Other Global Heavy Crudes
Western Canadian Select (WCS) is a benchmark Canadian heavy crude oil which traditionally (2005–2010) traded at a US$6.12/bbl discount to Maya (a slightly higher quality global benchmark for heavy crude oil prices). WCS–Maya differentials do vary, particularly when the refineries capable of processing WCS are down for maintenance. In 2012, WCS traded at an average US$27/bbl discount relative to Maya.
NRCan estimates 2012 crude oil export revenue losses due to lower–than-normal prices for Canadian light and heavy crudes at $13.3 billion. NRCan obtained the export volumes for Canadian crude oils of different quality grades (e.g., light oil, heavy oil), and compared actual oil export revenues to calculated revenues that would have been received if Canadian crude prices had maintained their typical relationships with other global crudes. The typical relationship was defined as the average relationship between Canadian and global crudes for the 2005–2010 period. The difference between the actual and calculated revenues is the estimate of the losses.
NRCan’s estimates of the losses to the Canadian economy are similar to estimates by ARC Financial, BMO, Scotiabank and CIBC which ranged from $18–$30 billion annually in 2012. Note that crude export sales from Atlantic Canada were excluded from this calculation, as they receive prices similar to the global Brent price. Furthermore, NRCan’s analysis did not consider impacts in the refining or other sectors, but rather considered only impacts on revenues from Canadian crude oil export sales. As all crude oil prices change daily, any calculation of losses or foregone revenues will yield different results, depending on the time period selected.
____________________
1 Estimating the losses associated only with exports recognizes that there could be lower net losses to the economy for Canadian crude that is refined in Canada, as the foregone upstream revenue benefits refiners. NRCan also excluded East Coast offshore crude from consideration since it can access higher priced global crude markets.
Download the report
Fuel Focus - Printable Version [PDF, 202 KB]
To read Adobe Acrobat® files, you will need to download and install the free Acrobat Reader® software available from Adobe Systems Incorporated.
Page details
- Date modified: