Fuel Focus, June 27, 2014
Table of Contents
National Overview
Canadian Retail Gasoline Prices Increased 2 Cents per Litre from Last Week
For the week ending June 24, 2014, the Canadian average retail gasoline price was $1.41 per litre. Higher world crude oil and North American wholesale gasoline prices pushed the Canadian average retail gasoline price up 2 cents per litre from the previous week. Prices are at a new all-time peak, exceeding the previous highest level of $1.40 per litre in July 2008. Prices are now above last year’s level by 11 cents per litre.
Diesel fuel prices rose by less than 1 cent per litre from the previous week to $1.36 per litre, while furnace oil prices increased by 1 cent, ending at $1.26 per litre. Compared to a year ago, prices for diesel and furnace oil are 12 and 9 cents per litre higher, respectively.
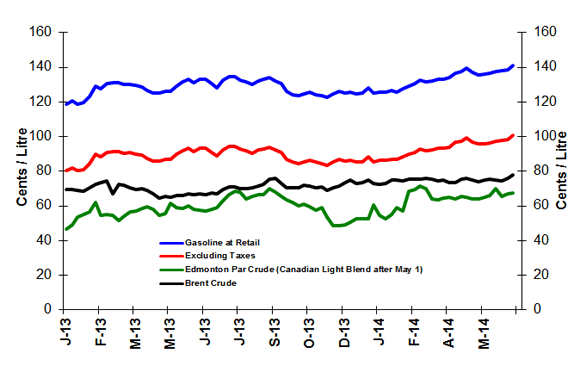
Figure 1: Crude Oil and Regular Gasoline Price Comparison
(National Average)
Text version
Figure 1
The graph shows prices in cents per litre for gasoline at retail, gasoline excluding taxes, and Edmonton Par and Brent crude oil prices. Gasoline prices ended the period of June 24, 2014, at 141.2 cents per litre, excluding taxes at 100.7 cents per litre, Canadian Light Sweet at 67.3 cents per litre and Brent at 77.8 cents per litre.
| Dates | Gasoline at retail | Excluding Taxes | Edmonton Par crude | Brent crude |
|---|---|---|---|---|
| 01/01/2013 | 118.9 | 80.4 | 46.6 | 69.3 |
| 08/01/2013 | 120.6 | 81.9 | 49.4 | 69.5 |
| 15/01/2013 | 118.9 | 80.3 | 53.7 | 69.2 |
| 22/01/2013 | 119.7 | 81.1 | 55.2 | 68.7 |
| 29/01/2013 | 123.3 | 84.3 | 56.6 | 70.7 |
| 05/02/2013 | 129.2 | 89.7 | 61.9 | 72.5 |
| 12/02/2013 | 127.7 | 88.4 | 54.8 | 73.5 |
| 19/02/2013 | 130.5 | 90.9 | 55.3 | 74.6 |
| 26/02/2013 | 131.2 | 91.6 | 54.7 | 67.1 |
| 05/03/2013 | 131.2 | 91.6 | 51.8 | 72.5 |
| 12/03/2013 | 129.9 | 90.4 | 54.2 | 71.8 |
| 19/03/2013 | 130.1 | 90.7 | 56.7 | 70.6 |
| 26/03/2013 | 129.4 | 90.0 | 57.0 | 69.7 |
| 02/04/2013 | 128.7 | 89.3 | 58.4 | 69.9 |
| 09/04/2013 | 126.5 | 87.4 | 59.5 | 68.9 |
| 16/04/2013 | 125.0 | 86.0 | 58.0 | 67.0 |
| 23/04/2013 | 125.1 | 85.9 | 54.8 | 64.4 |
| 30/04/2013 | 126.3 | 87.0 | 55.8 | 65.5 |
| 07/05/2013 | 126.0 | 86.7 | 61.4 | 65.1 |
| 14/05/2013 | 129.3 | 89.8 | 59.1 | 66.1 |
| 21/05/2013 | 131.4 | 91.8 | 58.8 | 66.1 |
| 28/05/2013 | 132.9 | 93.2 | 60.0 | 66.9 |
| 04/06/2013 | 131.1 | 91.5 | 58.1 | 66.6 |
| 11/06/2013 | 132.9 | 93.2 | 57.8 | 66.8 |
| 18/06/2013 | 133.1 | 93.3 | 57.0 | 66.8 |
| 25/06/2013 | 130.5 | 91.0 | 58.0 | 67.4 |
| 02/07/2013 | 128.3 | 88.9 | 59.0 | 67.2 |
| 09/07/2013 | 132.4 | 92.6 | 63.1 | 69.6 |
| 16/07/2013 | 134.4 | 94.3 | 66.6 | 71.2 |
| 23/07/2013 | 134.7 | 94.6 | 68.7 | 71.1 |
| 30/07/2013 | 132.7 | 92.8 | 67.9 | 69.8 |
| 06/08/2013 | 131.5 | 91.7 | 64.1 | 70.1 |
| 13/08/2013 | 130.0 | 90.3 | 65.6 | 70.3 |
| 20/08/2013 | 132.0 | 92.2 | 66.4 | 71.3 |
| 27/08/2013 | 133.0 | 93.0 | 66.4 | 72.3 |
| 03/09/2013 | 133.9 | 93.8 | 70.2 | 75.5 |
| 10/09/2013 | 132.1 | 92.2 | 68.1 | 76.1 |
| 17/09/2013 | 130.6 | 90.8 | 65.8 | 73.0 |
| 24/09/2013 | 126.4 | 87.1 | 63.7 | 70.8 |
| 01/10/2013 | 124.3 | 85.2 | 61.9 | 70.3 |
| 08/10/2013 | 123.6 | 84.6 | 60.1 | 70.6 |
| 15/10/2013 | 124.8 | 85.6 | 60.9 | 71.9 |
| 22/10/2013 | 125.5 | 86.2 | 59.7 | 71.7 |
| 29/10/2013 | 124.4 | 85.2 | 57.4 | 70.6 |
| 05/11/2013 | 123.7 | 84.6 | 58.9 | 71.1 |
| 12/11/2013 | 122.6 | 83.6 | 53.5 | 69.0 |
| 19/11/2013 | 124.6 | 85.3 | 48.7 | 70.7 |
| 26/11/2013 | 126.4 | 86.9 | 48.6 | 71.8 |
| 03/12/2013 | 125.4 | 86.1 | 49.4 | 73.6 |
| 10/12/2013 | 125.9 | 86.5 | 50.9 | 74.9 |
| 17/12/2013 | 124.5 | 85.2 | 52.5 | 73.0 |
| 24/12/2013 | 125.0 | 85.6 | 52.6 | 73.5 |
| 31/12/2013 | 128.3 | 88.6 | 52.6 | 74.9 |
| 07/01/2014 | 125.0 | 85.6 | 60.6 | 73.0 |
| 14/01/2014 | 125.6 | 86.2 | 54.6 | 72.6 |
| 21/01/2014 | 125.7 | 86.3 | 52.8 | 73.2 |
| 28/01/2014 | 126.6 | 87.0 | 55.1 | 74.9 |
| 04/02/2014 | 125.9 | 86.7 | 59.0 | 75.1 |
| 11/02/2014 | 127.6 | 88.2 | 57.0 | 74.4 |
| 18/02/2014 | 129.3 | 89.8 | 68.5 | 75.3 |
| 25/02/2014 | 130.7 | 91.0 | 69.7 | 75.4 |
| 04/03/2014 | 132.5 | 92.7 | 71.5 | 75.4 |
| 11/03/2014 | 131.8 | 92.1 | 70.3 | 75.9 |
| 18/03/2014 | 132.0 | 92.3 | 64.3 | 75.4 |
| 25/03/2014 | 132.9 | 93.2 | 63.4 | 74.7 |
| 01/04/2014 | 132.9 | 93.2 | 64.4 | 75.2 |
| 08/04/2014 | 133.9 | 94.1 | 65.1 | 73.7 |
| 15/04/2014 | 136.8 | 96.7 | 64.2 | 73.8 |
| 22/04/2014 | 137.7 | 97.4 | 65.5 | 75.7 |
| 29/04/2014 | 139.8 | 99.4 | 65.0 | 76.1 |
| 06/05/2014 | 136.9 | 96.8 | 64.2 | 74.8 |
| 13/05/2014 | 135.7 | 95.8 | 64.2 | 73.9 |
| 20/05/2014 | 136.0 | 95.9 | 65.2 | 75.0 |
| 27/05/2014 | 136.8 | 96.6 | 66.2 | 75.5 |
| 03/06/2014 | 137.4 | 97.2 | 70.3 | 75.0 |
| 10/06/2014 | 138.1 | 97.9 | 65.5 | 74.7 |
| 17/06/2014 | 138.8 | 98.5 | 67.1 | 76.0 |
| 24/06/2014 | 141.2 | 100.7 | 67.3 | 77.8 |
Figure 2: Weekly Regular Gasoline Prices

Note:
Edmonton Par prices are discontinued as of May 1, 2014, and replaced by the Canadian Light crude blend which is traded daily on the Net Energy Index.
Text version
Figure 2
This graph shows the gasoline price trends from 2012 to 2014.
| Date | 2012 Gasoline at Retail | Date | 2013 Gasoline at Retail | Date | 2014 Gasoline at Retail |
|---|---|---|---|---|---|
| 12-01-03 | 120.60 | 13-01-01 | 118.90 | 13-12-31 | 128.30 |
| 12-01-10 | 122.90 | 13-01-08 | 120.60 | 14-01-07 | 125.00 |
| 12-01-17 | 123.00 | 13-01-15 | 118.90 | 14-01-14 | 125.60 |
| 12-01-24 | 123.30 | 13-01-22 | 119.70 | 14-01-21 | 125.70 |
| 12-01-31 | 124.70 | 13-01-29 | 123.30 | 14-01-28 | 126.60 |
| 12-02-07 | 122.70 | 13-02-05 | 129.20 | 14-02-04 | 125.90 |
| 12-02-14 | 126.70 | 13-02-12 | 127.70 | 14-02-11 | 127.60 |
| 12-02-21 | 127.00 | 13-02-19 | 130.50 | 14-02-18 | 129.30 |
| 12-02-28 | 131.70 | 13-02-26 | 131.20 | 14-02-25 | 130.70 |
| 12-03-06 | 127.30 | 13-03-05 | 131.20 | 14-03-04 | 132.50 |
| 12-03-13 | 131.00 | 13-03-12 | 129.90 | 14-03-11 | 131.80 |
| 12-03-20 | 132.80 | 13-03-19 | 130.10 | 14-03-18 | 132.00 |
| 12-03-27 | 132.70 | 13-03-26 | 129.40 | 14-03-25 | 132.90 |
| 12-04-03 | 135.10 | 13-04-02 | 128.70 | 14-04-01 | 132.90 |
| 12-04-10 | 136.40 | 13-04-09 | 126.50 | 14-04-08 | 133.90 |
| 12-04-17 | 136.70 | 13-04-16 | 125.00 | 14-04-15 | 136.80 |
| 12-04-24 | 132.00 | 13-04-23 | 125.10 | 14-04-22 | 137.70 |
| 12-05-01 | 131.90 | 13-04-30 | 126.30 | 14-04-29 | 139.80 |
| 12-05-08 | 129.50 | 13-05-07 | 126.00 | 14-05-06 | 136.90 |
| 12-05-15 | 130.30 | 13-05-14 | 129.30 | 14-05-13 | 135.70 |
| 12-05-22 | 128.50 | 13-05-21 | 131.40 | 14-05-20 | 136.00 |
| 12-05-29 | 129.30 | 13-05-28 | 132.90 | 14-05-27 | 136.80 |
| 12-06-05 | 126.80 | 13-06-04 | 131.10 | 14-06-03 | 137.40 |
| 12-06-12 | 126.70 | 13-06-11 | 132.90 | 14-06-10 | 138.10 |
| 12-06-19 | 126.80 | 13-06-18 | 133.10 | 14-06-17 | 138.80 |
| 12-06-26 | 123.70 | 13-06-25 | 130.50 | 14-06-24 | 141.20 |
| 12-07-03 | 123.10 | 13-07-02 | 128.30 | 14-07-01 | |
| 12-07-10 | 126.00 | 13-07-09 | 132.40 | 14-07-08 | |
| 12-07-17 | 128.00 | 13-07-16 | 134.40 | 14-07-15 | |
| 12-07-24 | 129.20 | 13-07-23 | 134.70 | 14-07-22 | |
| 12-07-31 | 127.30 | 13-07-30 | 132.70 | 14-07-29 | |
| 12-08-07 | 129.70 | 13-08-06 | 131.50 | 14-08-05 | |
| 12-08-14 | 131.00 | 13-08-13 | 130.00 | 14-08-12 | |
| 12-08-21 | 130.30 | 13-08-20 | 132.00 | 14-08-19 | |
| 12-08-28 | 130.60 | 13-08-27 | 133.00 | 14-08-26 | |
| 12-09-04 | 130.90 | 13-09-03 | 133.90 | 14-09-02 | |
| 12-09-11 | 132.20 | 13-09-10 | 132.10 | 14-09-09 | |
| 12-09-18 | 134.60 | 13-09-17 | 130.60 | 14-09-16 | |
| 12-09-25 | 128.90 | 13-09-24 | 126.40 | 14-09-23 | |
| 12-10-02 | 132.80 | 13-10-01 | 124.30 | 14-09-30 | |
| 12-10-09 | 133.00 | 13-10-08 | 123.60 | 14-10-07 | |
| 12-10-16 | 130.10 | 13-10-15 | 124.80 | 14-10-14 | |
| 12-10-23 | 124.30 | 13-10-22 | 125.50 | 14-10-21 | |
| 12-10-30 | 123.50 | 13-10-29 | 124.40 | 14-10-28 | |
| 12-11-06 | 121.60 | 13-11-05 | 123.70 | 14-11-04 | |
| 12-11-13 | 122.50 | 13-11-12 | 122.60 | 14-11-11 | |
| 12-11-20 | 122.20 | 13-11-19 | 124.60 | 14-11-18 | |
| 12-11-27 | 122.60 | 13-11-26 | 126.40 | 14-11-25 | |
| 12-12-04 | 120.90 | 13-12-03 | 125.40 | 14-12-02 | |
| 12-12-11 | 117.30 | 13-12-10 | 125.90 | 14-12-09 | |
| 12-12-18 | 117.70 | 13-12-17 | 124.50 | 14-12-16 | |
| 12-12-25 | 119.00 | 13-12-24 | 125.00 | 14-12-23 | |
| 13-12-31 | 128.30 | 14-12-30 |
| ¢/L | Week of: 2014-06-24 | Change from: Previous Week | Change from: Last Year |
|---|---|---|---|
| Gasoline | 141.2 | +2.4 | +10.7 |
| Diesel | 135.6 | +0.4 | +11.8 |
| Furnace Oil | 126.5 | +0.7 | +9.0 |
Source: NRCan
| 2014-06-24 | ¢/kilogram | ¢/L gasoline equivalent | ¢/L diesel equivalent |
|---|---|---|---|
| Vancouver | 114.6 | 75.6 | 78.4 |
| Edmonton | 115.1 | 75.9 | 78.7 |
| Toronto | 128.3 | 84.6 | 87.8 |
Source: ¢/kg Kent Marketing Services Limited
Recent Developments
- Auto Idle-stop Systems: While most Canadians understand the fuel and environmental costs of unnecessary idling, it can be difficult to avoid, especially in traffic jams and at long intersection waits. Enter the idle-stop system: when the car is at a full stop, its computer system automatically sends a signal to turn off the engine, which re-starts when the driver releases the brake, reducing the amount of time the engine spends idling. Transport Canada recently conducted tests on idle-stop systems and concluded that in typical stop-and-go city traffic, idle-stop systems offered fuel savings of 11.5 percent compared to a standard vehicle. Transport Canada noted however that some systems did not engage in temperatures below -7°C. (Source: Canadian Fuels Association, Tech Talk, Issue 6.)
- IEA Global Oil Demand Forecast: According to the International Energy Agency (IEA) Medium-Term Oil Market Report 2014, global oil demand is forecast to climb to 99.1 million bbls per day by 2019. The IEA forecasts a growth in demand of 7.6 million bbls per day over the 2013-2019 forecast period, for an average annual growth rate of 1.3 per cent. Before the end of the decade, however, demand growth may start to slow down as a combination of high oil prices, environmental concerns and cheaper fuel alternatives lead to both fuel-switching away from oil and overall fuel savings. (Source: Daily Oil Bulletin)
- Propane Inventories Continue to Rise: U.S. propane stocks increased by 2.0 million barrels last week to 51.2 million barrels as of June 13, 2014, 1.9 million barrels (3.5%) lower than a year ago. Gulf Coast inventories increased by 1.6 million barrels and East Coast inventories increased by 0.4 million barrels. Rocky Mountain/West Coast inventories increased by 0.1 million barrels while Midwest inventories remained unchanged.
Retail Gasoline Overview
The four-week average regular gasoline pump price in selected cities across Canada was $1.39 per litre for the period ending June 24, 2014. This is an increase of 2 cents per litre from the last report on June 13, 2014, and it represents an increase of 7 cents per litre compared to the same period in 2013.
The four-week average crude oil price component of gasoline was up 1 cent from two weeks ago and registered at 75 cents per litre—13 cents per litre higher than during the same period in 2013.
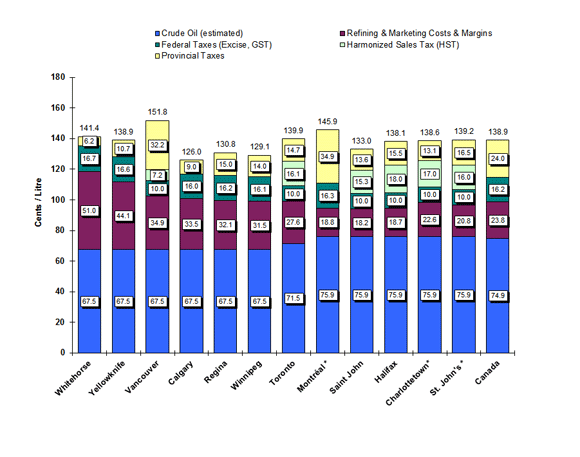
Retail gasoline prices in eastern centres increased on average by 1 cent per litre compared to the last report two weeks ago, and ranged from $1.33 per litre to $1.40 per litre. Prices in western centres increased, on average, by 2 cents per litre and ranged from $1.26 per litre to $1.52 per litre.
At the national level, refining and marketing costs rose by 1 cent per litre from the previous report of two weeks ago to 24 cents per litre. The increase in wholesale gasoline prices was larger than the increase in crude oil prices, resulting in higher average refining margins.
Figure 3: Regular Gasoline Pump Prices in Selected Cities Four-Week Average (June 3 to 24, 2014)
Text version
Figure 3
This graph shows the gasoline price components for 2 territories and 10 cities plus the national average.
| Whitehorse | Yellowknife | Vancouver | Calgary | Regina | Winnipeg | Toronto | Montreal* | Saint John* |
Halifax* | Charlottetown* | St. John's* |
Canada | |
|---|---|---|---|---|---|---|---|---|---|---|---|---|---|
| Pump Price | 141.4 | 138.9 | 151.8 | 126.0 | 130.8 | 129.1 | 139.9 | 145.9 | 133.0 | 138.1 | 138.6 | 139.2 | 138.9 |
| Crude (est.) | 67.5 | 67.5 | 67.5 | 67.5 | 67.5 | 67.5 | 71.5 | 75.9 | 75.9 | 75.9 | 75.9 | 75.9 | 74.9 |
| Federal Taxes | 16.7 | 16.6 | 10.0 | 16.0 | 16.2 | 16.1 | 10.0 | 16.3 | 10.0 | 10.0 | 10.0 | 10.0 | 16.2 |
| Provincial Tax | 6.2 | 10.7 | 32.2 | 9.0 | 15.0 | 14.0 | 14.7 | 34.9 | 13.6 | 15.5 | 13.1 | 16.5 | 24.0 |
| HST | 7.2 | 16.1 | 15.3 | 18.0 | 17.0 | 16.0 | |||||||
| Refining & Marketing Costs & Margins | 51.0 | 44.1 | 34.9 | 33.5 | 32.1 | 31.5 | 27.6 | 18.8 | 18.2 | 18.7 | 22.6 | 20.8 | 23.8 |
Source: NRCan
* Regulated Markets
Note: Toronto crude oil cost includes pipeline tolls of $4 per barrel for light crude oil from Edmonton to Sarnia, Ontario.
2013 National Retail Petroleum Site Census
MJ Ervin & Associates recently published its 2013 National Retail Petroleum Site Census. This is a comprehensive review of retail petroleum outlets in Canada. The census illustrates a continued diversity of brands of gasoline in Canada with the physical product largely originating from 14 refineries in Canada, operated by a total of nine refining organizations.
As of December 31, 2013 there were 11,849 retail gasoline stations operating in Canada; 3.4 outlets for every 10,000 persons. The census illustrates a strong relationship between "throughput efficiency" (the volume of gasoline sold by each retail outlet) and the level of retail markup in each province's markets. Markets with poor (low) throughput tend to have higher retail gasoline prices (after tax differences are factored out) than those with high throughput.
The census found that 80 percent of all gasoline stations in Canada are price-controlled by individual outlet proprietors or non-refiner marketers, with the remaining 19 percent of all gas stations under the price control of one of the 8 refiner-marketers in Canada. The census also measured the market representation of a number of site features and offerings: the type of pump service (full or self), convenience stores, car washes, fast food, automotive service, and whether diesel fuel was offered for sale. A full version of this report is available for purchase at the MJ Ervin & Associates website.
Wholesale Gasoline Prices
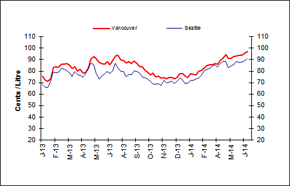
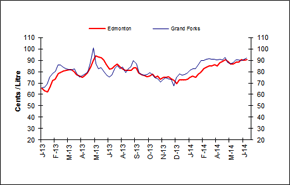
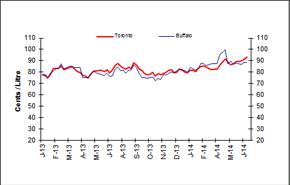
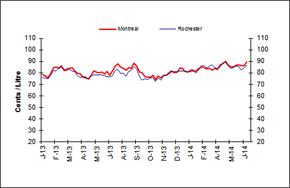
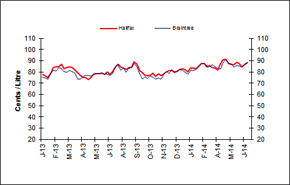
For the week of June 19, 2013, compared to the previous week, wholesale gasoline prices rose in all centres from less than 1 to nearly 3 cents per litre.
In the eastern markets of Canada and the United States, wholesale gasoline prices increased in the range of less than 1 to nearly 3 cents per litre. Prices for the period ended in the 86-to-93 cent-per-litre range.
Western wholesale gasoline prices ended in the range of 91 to 97 cents per litre with changes ranging from an increase of 1 to 2 cents per litre.
Overall, in the last four weeks, prices have fluctuated in the range of less than 1 cent per litre to 4 cents per litre. Wholesale prices are higher than last year’s level with price increases ranging from 4 to 15 cents per litre, compared to the same period last year.
 |
 |
|
 |
 |
|
 |
Text version
Figure 4
This graph shows the trend in wholesale gasoline prices for selected centres in Canada and the U.S.
| DATE | Halifax | Braintree | Montreal | Rochester | Toronto | Buffalo | Edmonton | Grand Forks |
Vancouver | Seattle |
|---|---|---|---|---|---|---|---|---|---|---|
| Thu 03-Jan-13 | 77.50 | 75.42 | 78.60 | 75.82 | 77.50 | 77.31 | 65.40 | 66.07 | 75.50 | 68.79 |
| Thu 10-Jan-13 | 76.70 | 74.48 | 77.40 | 75.49 | 76.90 | 77.88 | 63.40 | 66.67 | 72.40 | 65.77 |
| Thu 17-Jan-13 | 74.80 | 73.73 | 75.40 | 74.81 | 75.00 | 74.96 | 62.40 | 69.13 | 70.90 | 65.72 |
| Thu 13-Dec-12 | 72.10 | 70.22 | 74.90 | 71.94 | 73.90 | 77.52 | 67.70 | 64.43 | 70.50 | 65.70 |
| Thu 24-Jan-13 | 79.00 | 78.00 | 79.00 | 78.15 | 78.30 | 78.93 | 66.80 | 75.06 | 73.50 | 70.59 |
| Thu 31-Jan-13 | 84.10 | 81.70 | 84.70 | 81.81 | 83.50 | 80.51 | 72.50 | 78.85 | 83.40 | 79.19 |
| Thu 07-Feb-13 | 84.60 | 80.98 | 85.10 | 81.47 | 83.20 | 83.16 | 73.10 | 80.16 | 84.00 | 78.87 |
| Thu 14-Feb-13 | 84.50 | 83.61 | 84.20 | 84.35 | 83.20 | 83.55 | 78.10 | 86.03 | 83.30 | 79.18 |
| Thu 21-Feb-13 | 86.70 | 83.01 | 85.90 | 84.51 | 85.40 | 87.44 | 79.70 | 85.90 | 86.00 | 82.60 |
| Thu 28-Feb-13 | 82.80 | 80.41 | 81.90 | 83.34 | 81.90 | 83.14 | 80.50 | 83.70 | 86.20 | 81.99 |
| Thu 07-Mar-13 | 84.10 | 80.00 | 83.60 | 82.22 | 83.30 | 84.09 | 81.00 | 82.56 | 86.90 | 80.15 |
| Thu 14-Mar-13 | 84.60 | 81.52 | 84.00 | 83.10 | 83.90 | 85.12 | 81.70 | 82.24 | 85.40 | 78.61 |
| Thu 21-Mar-13 | 84.10 | 80.55 | 84.50 | 81.59 | 84.80 | 84.95 | 81.80 | 81.66 | 82.10 | 75.28 |
| Thu 28-Mar-13 | 82.00 | 79.08 | 81.50 | 80.79 | 82.60 | 84.24 | 80.20 | 82.51 | 83.80 | 79.62 |
| Thu 04-Apr-13 | 79.40 | 73.32 | 79.50 | 77.54 | 80.60 | 84.10 | 77.40 | 78.17 | 80.20 | 77.14 |
| Thu 11-Apr-13 | 77.30 | 73.36 | 78.90 | 75.92 | 79.80 | 83.84 | 75.90 | 75.52 | 81.50 | 76.23 |
| Thu 18-Apr-13 | 74.70 | 75.92 | 76.30 | 76.28 | 77.10 | 75.04 | 74.90 | 76.41 | 78.50 | 74.77 |
| Thu 25-Apr-13 | 74.80 | 77.01 | 75.90 | 76.42 | 76.70 | 75.40 | 76.80 | 78.08 | 79.00 | 77.56 |
| Thu 02-May-13 | 73.50 | 76.65 | 74.50 | 75.00 | 75.00 | 75.38 | 78.80 | 79.70 | 82.00 | 83.51 |
| Thu 09-May-13 | 75.10 | 76.22 | 77.60 | 77.03 | 78.50 | 77.88 | 83.90 | 87.57 | 90.80 | 87.15 |
| Thu 16-May-13 | 78.10 | 77.25 | 81.50 | 78.21 | 80.90 | 80.54 | 89.30 | 101.10 | 92.50 | 85.64 |
| Thu 23-May-13 | 78.60 | 78.37 | 80.50 | 78.09 | 81.30 | 79.53 | 94.20 | 86.80 | 90.30 | 78.24 |
| Thu 30-May-13 | 78.40 | 78.36 | 79.80 | 77.90 | 81.40 | 78.43 | 92.60 | 82.64 | 87.60 | 73.33 |
| Thu 06-Jun-13 | 78.70 | 78.91 | 80.50 | 78.17 | 81.60 | 78.16 | 92.40 | 83.64 | 86.60 | 76.00 |
| Thu 13-Jun-13 | 77.80 | 78.32 | 78.90 | 77.45 | 80.60 | 76.84 | 90.20 | 79.79 | 86.00 | 77.78 |
| Thu 20-Jun-13 | 80.10 | 78.00 | 81.00 | 76.50 | 82.00 | 79.30 | 86.20 | 76.78 | 88.10 | 79.78 |
| Thu 27-Jun-13 | 77.80 | 76.96 | 78.10 | 76.22 | 79.40 | 76.41 | 82.40 | 75.29 | 85.70 | 77.93 |
| Thu 04-Jul-13 | 79.80 | 78.53 | 81.30 | 77.56 | 81.80 | 76.93 | 82.70 | 77.19 | 88.70 | 80.47 |
| Thu 11-Jul-13 | 84.60 | 84.52 | 86.30 | 82.08 | 85.80 | 82.51 | 85.00 | 83.36 | 93.40 | 87.07 |
| Thu 18-Jul-13 | 87.10 | 86.48 | 87.80 | 82.88 | 87.80 | 84.45 | 86.70 | 85.15 | 93.90 | 82.94 |
| Thu 25-Jul-15 | 84.40 | 81.63 | 84.80 | 79.09 | 85.40 | 81.21 | 84.10 | 82.55 | 89.90 | 79.53 |
| Thu 01-Aug-13 | 83.20 | 83.68 | 84.00 | 80.06 | 84.10 | 81.93 | 82.00 | 84.32 | 89.50 | 79.81 |
| Thu 08-Aug-13 | 82.30 | 79.58 | 82.20 | 76.89 | 82.60 | 78.85 | 81.10 | 78.95 | 87.00 | 75.45 |
| Thu 15-Aug-13 | 84.20 | 83.01 | 84.40 | 80.94 | 84.20 | 81.32 | 81.20 | 82.30 | 88.50 | 76.76 |
| Thu 22-Aug-13 | 83.90 | 83.75 | 84.00 | 82.03 | 83.50 | 82.16 | 80.90 | 84.32 | 86.40 | 76.73 |
| Thu 29-Aug-13 | 88.90 | 87.42 | 88.30 | 85.55 | 88.10 | 86.41 | 83.40 | 89.62 | 88.90 | 80.31 |
| Thu 05-Sep-13 | 86.70 | 84.77 | 86.20 | 83.13 | 85.90 | 84.03 | 83.20 | 86.81 | 86.50 | 79.97 |
| Thu 12-Sep-13 | 81.00 | 79.52 | 80.90 | 77.16 | 82.90 | 78.97 | 79.20 | 79.37 | 84.00 | 78.65 |
| Thu 19-Sep-13 | 79.70 | 73.77 | 80.20 | 73.60 | 81.60 | 75.45 | 77.10 | 77.32 | 83.70 | 74.59 |
| Thu 26-Sep-13 | 77.40 | 75.99 | 77.00 | 74.69 | 78.70 | 75.25 | 76.50 | 76.96 | 80.90 | 74.43 |
| Thu 03-Oct-13 | 76.50 | 73.93 | 76.00 | 74.33 | 77.80 | 74.45 | 75.60 | 77.48 | 79.10 | 73.09 |
| Thu 10-Oct-13 | 77.00 | 76.23 | 76.40 | 75.22 | 78.20 | 75.24 | 76.20 | 79.28 | 76.80 | 71.32 |
| Thu 17-Oct-13 | 78.80 | 75.48 | 78.00 | 75.66 | 79.80 | 75.64 | 77.80 | 77.39 | 78.30 | 68.82 |
| Thu 24-Oct-13 | 76.30 | 73.26 | 74.20 | 72.60 | 76.40 | 76.40 | 75.10 | 74.67 | 75.20 | 68.55 |
| Thu 31-Oct-13 | 78.40 | 74.83 | 77.40 | 75.50 | 78.90 | 74.66 | 75.90 | 73.89 | 75.50 | 69.29 |
| Thu 07-Nov-13 | 76.50 | 73.29 | 75.40 | 73.47 | 77.70 | 73.62 | 73.10 | 70.87 | 73.90 | 67.58 |
| Thu 14-Nov-13 | 78.50 | 78.01 | 77.70 | 77.49 | 78.90 | 78.23 | 74.80 | 73.14 | 74.60 | 71.77 |
| Thu 21-Nov-13 | 80.00 | 80.43 | 77.80 | 77.74 | 79.80 | 77.16 | 75.30 | 74.96 | 73.50 | 69.75 |
| Thu 28-Nov-13 | 81.30 | 78.79 | 80.20 | 79.06 | 81.60 | 79.32 | 75.50 | 73.46 | 74.60 | 70.20 |
| Thu 05-Dec-13 | 81.30 | 81.98 | 81.70 | 80.77 | 81.90 | 79.95 | 74.00 | 73.04 | 74.70 | 71.18 |
| Thu 12-Dec-13 | 79.30 | 80.57 | 80.00 | 80.76 | 79.60 | 79.52 | 72.30 | 67.30 | 73.60 | 69.01 |
| Thu 19-Dec-13 | 80.60 | 80.41 | 80.60 | 80.76 | 79.80 | 81.20 | 69.40 | 74.95 | 74.60 | 71.49 |
| Thu 26-Dec-13 | 82.50 | 82.08 | 84.20 | 81.35 | 82.80 | 82.75 | 72.70 | 77.90 | 77.80 | 73.92 |
| Thu 02-Jan-14 | 83.00 | 81.60 | 83.90 | 81.26 | 82.40 | 81.49 | 72.90 | 77.05 | 77.80 | 72.33 |
| Thu 09-Jan-14 | 81.80 | 79.89 | 81.30 | 81.25 | 80.00 | 81.12 | 72.60 | 77.50 | 75.40 | 69.37 |
| Thu 16-Jan-14 | 79.90 | 78.10 | 80.80 | 80.69 | 79.20 | 80.27 | 73.60 | 78.54 | 74.50 | 69.50 |
| Thu 23-Jan-14 | 83.30 | 81.27 | 82.50 | 80.86 | 81.50 | 84.27 | 75.20 | 81.56 | 77.80 | 72.04 |
| Thu 30-Jan-14 | 83.60 | 81.57 | 82.50 | 81.27 | 81.60 | 84.27 | 75.90 | 82.75 | 77.20 | 72.24 |
| Thu 06-Feb-14 | 83.00 | 81.77 | 81.00 | 79.85 | 80.60 | 82.00 | 75.00 | 82.38 | 76.40 | 73.02 |
| Thu 13-Feb-14 | 85.40 | 84.58 | 83.50 | 82.68 | 83.50 | 83.54 | 77.70 | 86.24 | 79.80 | 74.26 |
| Thu 20-Feb-14 | 87.30 | 87.33 | 84.90 | 85.83 | 85.20 | 88.00 | 79.60 | 89.82 | 80.40 | 76.56 |
| Thu 27-Feb-14 | 87.60 | 87.64 | 84.60 | 86.29 | 85.70 | 87.43 | 83.00 | 89.92 | 82.60 | 80.13 |
| Thu 06-Mar-14 | 85.10 | 84.56 | 83.30 | 84.37 | 84.20 | 85.84 | 84.10 | 91.11 | 84.80 | 81.55 |
| Thu 13-Mar-14 | 85.90 | 84.97 | 83.80 | 85.80 | 83.50 | 86.75 | 85.30 | 91.48 | 85.40 | 82.23 |
| Thu 20-Mar-14 | 84.20 | 86.34 | 82.40 | 86.82 | 82.10 | 87.62 | 85.00 | 91.13 | 85.70 | 84.11 |
| Thu 27-Mar-14 | 83.40 | 84.62 | 84.62 | 84.72 | 82.80 | 87.34 | 85.90 | 90.80 | 86.80 | 85.82 |
| Thu 03-Apr-14 | 81.90 | 82.99 | 83.10 | 83.94 | 82.50 | 87.19 | 85.30 | 90.11 | 85.90 | 83.37 |
| Thu 10-Apr-14 | 86.70 | 82.53 | 86.50 | 85.36 | 86.00 | 95.70 | 88.00 | 91.01 | 89.40 | 86.71 |
| Thu 17-Apr-14 | 90.60 | 88.47 | 87.90 | 88.00 | 88.70 | 97.62 | 88.80 | 90.24 | 91.20 | 88.76 |
| Thu 24-Apr-14 | 91.30 | 91.03 | 90.10 | 89.26 | 91.40 | 99.92 | 90.50 | 92.66 | 94.50 | 88.79 |
| Thu 01-May-14 | 87.60 | 88.06 | 87.00 | 86.18 | 88.80 | 87.36 | 88.70 | 88.15 | 91.30 | 83.13 |
| Thu 08-May-14 | 86.90 | 87.20 | 84.80 | 83.61 | 86.60 | 89.49 | 86.60 | 87.11 | 91.00 | 84.56 |
| Thu 15-May-14 | 86.50 | 84.35 | 85.10 | 84.57 | 87.20 | 86.86 | 86.90 | 88.18 | 92.50 | 85.56 |
| Thu 22-May-14 | 88.30 | 85.62 | 86.70 | 85.75 | 89.30 | 88.24 | 88.30 | 90.07 | 93.20 | 88.76 |
| Thu 29-May-14 | 87.30 | 85.51 | 86.80 | 85.31 | 89.40 | 87.46 | 88.60 | 90.44 | 93.60 | 87.32 |
| Thu 05-Jun-14 | 84.80 | 84.40 | 86.10 | 82.54 | 89.80 | 86.83 | 90.60 | 89.57 | 93.60 | 88.04 |
| Thu 12-Jun-14 | 86.10 | 87.14 | 86.30 | 84.73 | 91.30 | 88.58 | 89.80 | 90.68 | 95.40 | 89.01 |
| Thu 19-Jun-14 | 88.80 | 87.87 | 89.70 | 86.27 | 93.50 | 88.82 | 90.50 | 91.88 | 97.40 | 90.68 |
Sources: NRCan, Bloomberg Oil Buyers Guide
Gasoline Refining and Marketing Margins
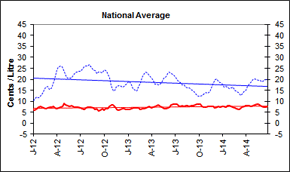
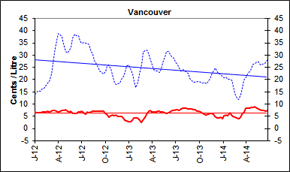
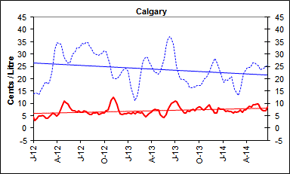
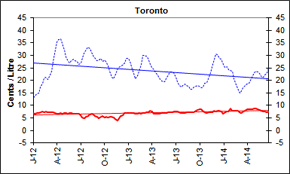
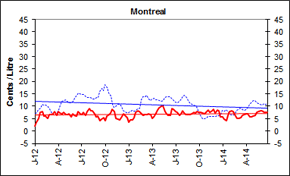
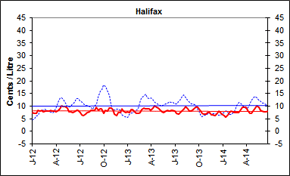
Four-week rolling averages are used for gasoline refining and marketing margins. Overall, for the week ending June 24, 2014, refining margins hovered at nearly 20 cents per litre — 2 cents per litre lower than for the same period last year.
The refining margins shown here are derived numbers based on the difference between the estimated crude oil price and the wholesale price of gasoline at a point in time. While the analysis presented here is useful for tracking the trends in gasoline margins and estimating how much of the pump price is going to the refiner, it does not represent overall refining margins when considering all refinery products (e.g. gasoline, diesel, asphalt, lubricating oil, etc.).
Gasoline, accounting for about 30-35% of a refinery’s output, is only one of many products produced from a barrel of crude oil. As one of the higher-valued products, gasoline generates a disproportionate share of the revenues. Gasoline margins are offset by much lower margins on other products such as heavy fuel oil and asphalt that often sell for less than the cost of the crude oil used to make them.
 |
 |
|
 |
 |
|
 |
 |
Text version
Figure 5
These graphs show the trend in refining and marketing costs and margins for selected centres in Canada and the national average.
| 4-week rolling average | Canada | Vancouver | Calgary | Toronto | Montreal | Halifax | ||||||
|---|---|---|---|---|---|---|---|---|---|---|---|---|
| Marketing Margin | Refining Margin | Marketing Margin | Refining Margin | Marketing Margin | Refining Margin | Marketing Margin | Refining Margin | Marketing Margin | Refining Margin | Marketing Margin | Refining Margin | |
| 2012-01-03 | 6.1 | 10.4 | 6.9 | 14.1 | 4.6 | 13.9 | 6.9 | 13.0 | 1.9 | 7.1 | 7.3 | 4.4 |
| 2012-01-10 | 6.1 | 11.3 | 6.4 | 14.9 | 3.0 | 14.2 | 6.7 | 13.8 | 3.7 | 7.5 | 7.1 | 5.0 |
| 2012-01-17 | 6.5 | 11.8 | 6.4 | 15.4 | 4.0 | 14.1 | 6.9 | 14.5 | 5.1 | 8.7 | 7.2 | 6.0 |
| 2012-01-24 | 7.3 | 11.5 | 6.3 | 15.1 | 5.0 | 13.6 | 7.0 | 14.9 | 7.5 | 9.1 | 8.3 | 6.5 |
| 2012-01-31 | 7.6 | 12.3 | 6.7 | 16.6 | 5.0 | 15.0 | 7.4 | 17.3 | 8.0 | 10.6 | 8.2 | 8.1 |
| 2012-02-07 | 7.2 | 13.6 | 6.8 | 16.6 | 5.2 | 16.5 | 7.4 | 18.9 | 6.2 | 10.6 | 8.4 | 8.2 |
| 2012-02-14 | 7.0 | 15.2 | 6.8 | 17.4 | 4.8 | 17.9 | 7.3 | 20.8 | 6.1 | 10.3 | 7.8 | 8.4 |
| 2012-02-21 | 6.6 | 16.2 | 6.9 | 18.5 | 3.9 | 18.6 | 7.5 | 21.4 | 5.1 | 10.1 | 7.9 | 8.7 |
| 2012-02-28 | 6.8 | 16.9 | 6.8 | 19.3 | 3.9 | 17.7 | 7.3 | 20.3 | 6.5 | 8.8 | 8.0 | 8.2 |
| 2012-03-06 | 7.1 | 15.4 | 7.2 | 22.2 | 4.9 | 18.9 | 7.3 | 21.6 | 6.7 | 7.7 | 8.1 | 7.9 |
| 2012-03-13 | 7.3 | 16.2 | 7.5 | 26.6 | 5.6 | 22.4 | 7.4 | 23.8 | 6.9 | 6.9 | 8.4 | 7.6 |
| 2012-03-20 | 7.5 | 18.1 | 7.5 | 31.2 | 6.0 | 26.7 | 7.2 | 27.6 | 7.8 | 6.4 | 8.0 | 7.3 |
| 2012-03-27 | 6.9 | 20.1 | 7.1 | 36.2 | 5.6 | 31.9 | 6.9 | 32.5 | 6.3 | 6.9 | 8.0 | 7.7 |
| 2012-04-03 | 6.8 | 24.3 | 6.8 | 39.0 | 4.8 | 34.7 | 6.7 | 35.3 | 7.8 | 8.7 | 7.6 | 9.6 |
| 2012-04-10 | 7.1 | 25.8 | 7.1 | 38.3 | 5.8 | 34.4 | 6.8 | 36.2 | 7.4 | 10.4 | 8.4 | 11.4 |
| 2012-04-17 | 7.5 | 26.2 | 7.5 | 37.4 | 7.2 | 33.9 | 7.0 | 36.6 | 6.9 | 12.1 | 8.8 | 13.1 |
| 2012-04-24 | 8.0 | 25.7 | 7.4 | 34.4 | 9.0 | 31.8 | 6.7 | 34.9 | 7.6 | 12.4 | 10.0 | 13.3 |
| 2012-05-01 | 9.3 | 23.3 | 7.8 | 31.6 | 11.0 | 28.9 | 7.0 | 32.0 | 6.5 | 12.6 | 9.8 | 12.6 |
| 2012-05-08 | 8.7 | 21.7 | 7.2 | 31.0 | 10.5 | 27.3 | 6.9 | 29.5 | 6.6 | 12.0 | 9.8 | 11.3 |
| 2012-05-15 | 8.4 | 20.7 | 6.8 | 32.0 | 9.7 | 26.3 | 6.6 | 27.5 | 6.8 | 11.2 | 9.2 | 10.1 |
| 2012-05-22 | 8.0 | 20.6 | 7.0 | 33.2 | 8.6 | 26.3 | 7.0 | 27.0 | 5.9 | 11.4 | 7.8 | 9.7 |
| 2012-05-29 | 8.1 | 20.5 | 6.2 | 37.0 | 7.4 | 28.4 | 6.8 | 28.0 | 7.0 | 12.0 | 7.8 | 10.1 |
| 2012-06-05 | 8.0 | 21.8 | 6.1 | 38.6 | 7.1 | 30.0 | 6.5 | 28.5 | 6.3 | 13.2 | 7.6 | 10.9 |
| 2012-06-12 | 7.5 | 22.8 | 6.2 | 37.9 | 7.0 | 30.9 | 6.7 | 27.8 | 6.2 | 14.0 | 7.9 | 11.5 |
| 2012-06-19 | 7.8 | 23.3 | 6.7 | 38.0 | 6.3 | 32.5 | 6.7 | 27.5 | 8.0 | 15.3 | 8.3 | 12.9 |
| 2012-06-26 | 7.6 | 23.7 | 6.8 | 35.7 | 6.8 | 32.5 | 6.6 | 26.5 | 6.9 | 15.2 | 8.4 | 12.9 |
| 2012-07-03 | 7.3 | 23.7 | 7.0 | 34.9 | 6.5 | 33.0 | 6.1 | 27.0 | 6.6 | 14.8 | 7.3 | 12.1 |
| 2012-07-10 | 7.0 | 24.5 | 6.6 | 35.3 | 6.3 | 34.4 | 5.3 | 29.0 | 7.4 | 14.7 | 6.4 | 11.8 |
| 2012-07-17 | 6.6 | 25.8 | 5.9 | 34.9 | 7.0 | 34.0 | 4.9 | 30.9 | 6.3 | 14.0 | 6.2 | 10.7 |
| 2012-07-24 | 7.1 | 25.9 | 6.7 | 35.0 | 6.6 | 34.6 | 5.4 | 32.5 | 7.7 | 13.6 | 6.9 | 10.3 |
| 2012-07-31 | 7.6 | 26.1 | 6.6 | 34.3 | 6.2 | 34.6 | 5.8 | 33.3 | 9.0 | 13.4 | 7.5 | 10.4 |
| 2012-08-07 | 7.5 | 26.6 | 6.8 | 32.0 | 5.3 | 33.2 | 6.3 | 32.7 | 8.1 | 13.5 | 7.6 | 9.9 |
| 2012-08-14 | 7.6 | 25.4 | 7.1 | 30.2 | 5.5 | 32.4 | 6.7 | 31.2 | 8.2 | 13.0 | 8.4 | 9.3 |
| 2012-08-21 | 7.2 | 24.5 | 7.1 | 27.9 | 6.1 | 30.7 | 6.3 | 29.3 | 6.9 | 12.8 | 8.4 | 8.8 |
| 2012-08-28 | 6.5 | 23.9 | 7.1 | 26.4 | 6.0 | 30.0 | 5.8 | 28.8 | 5.8 | 13.6 | 8.2 | 9.9 |
| 2012-09-04 | 6.5 | 22.7 | 7.1 | 25.2 | 6.5 | 29.7 | 5.5 | 27.9 | 6.1 | 13.4 | 9.6 | 10.9 |
| 2012-09-11 | 5.6 | 23.3 | 7.0 | 23.6 | 5.3 | 29.3 | 4.8 | 28.3 | 4.2 | 15.9 | 8.4 | 13.5 |
| 2012-09-18 | 6.1 | 23.3 | 7.2 | 22.8 | 5.9 | 30.1 | 5.4 | 28.8 | 4.8 | 17.3 | 9.0 | 15.8 |
| 2012-09-25 | 6.5 | 22.9 | 7.0 | 22.3 | 6.2 | 30.4 | 5.7 | 27.6 | 5.4 | 16.4 | 8.8 | 16.4 |
| 2012-10-02 | 5.9 | 24.2 | 6.3 | 23.3 | 6.0 | 31.2 | 5.3 | 28.3 | 4.3 | 18.7 | 7.0 | 18.5 |
| 2012-10-09 | 6.6 | 23.8 | 5.7 | 25.6 | 6.9 | 31.1 | 5.4 | 27.5 | 6.1 | 17.4 | 8.4 | 17.9 |
| 2012-10-16 | 6.7 | 22.9 | 4.7 | 26.6 | 7.3 | 29.3 | 5.2 | 26.3 | 6.8 | 15.7 | 8.0 | 16.6 |
| 2012-10-23 | 7.5 | 20.4 | 5.1 | 24.4 | 9.1 | 25.9 | 5.5 | 23.7 | 7.2 | 14.0 | 9.3 | 14.3 |
| 2012-10-30 | 8.5 | 17.2 | 5.5 | 21.6 | 11.4 | 22.0 | 5.5 | 20.9 | 8.6 | 10.3 | 9.3 | 10.3 |
| 2012-11-06 | 8.3 | 14.8 | 5.1 | 18.7 | 12.4 | 20.3 | 5.1 | 20.8 | 7.9 | 9.6 | 8.5 | 8.6 |
| 2012-11-13 | 7.3 | 15.1 | 5.4 | 17.2 | 11.5 | 19.3 | 4.6 | 21.7 | 5.2 | 10.4 | 6.7 | 8.7 |
| 2012-11-20 | 6.3 | 16.8 | 5.1 | 18.2 | 9.4 | 20.0 | 4.1 | 24.4 | 4.7 | 10.8 | 6.1 | 8.9 |
| 2012-11-27 | 6.0 | 17.2 | 5.0 | 18.7 | 7.3 | 21.2 | 4.9 | 25.5 | 4.4 | 10.8 | 7.4 | 8.9 |
| 2012-12-04 | 6.2 | 17.2 | 4.8 | 20.1 | 5.8 | 21.8 | 5.8 | 25.7 | 5.5 | 9.9 | 7.5 | 8.6 |
| 2012-12-11 | 6.5 | 16.3 | 4.3 | 19.3 | 5.5 | 21.0 | 6.1 | 24.0 | 6.9 | 7.9 | 9.1 | 6.3 |
| 2012-12-18 | 6.7 | 16.6 | 3.6 | 23.2 | 5.8 | 24.0 | 7.1 | 27.1 | 6.5 | 7.8 | 8.0 | 6.0 |
| 2012-12-25 | 6.4 | 17.7 | 3.0 | 25.6 | 5.8 | 24.4 | 6.8 | 28.8 | 5.4 | 7.5 | 7.4 | 5.8 |
| 2013-01-01 | 6.2 | 18.6 | 2.8 | 25.9 | 6.1 | 23.1 | 7.1 | 28.9 | 3.6 | 7.3 | 7.7 | 5.6 |
| 2013-01-08 | 6.4 | 19.0 | 2.7 | 24.5 | 6.0 | 19.8 | 7.1 | 27.6 | 4.4 | 8.0 | 7.5 | 6.6 |
| 2013-01-15 | 6.5 | 17.5 | 3.5 | 22.2 | 5.9 | 16.3 | 6.8 | 25.5 | 4.6 | 8.2 | 8.5 | 7.2 |
| 2013-01-22 | 6.9 | 15.6 | 4.4 | 20.2 | 6.3 | 14.3 | 7.0 | 23.9 | 5.5 | 8.3 | 8.5 | 7.6 |
| 2013-01-29 | 6.9 | 15.0 | 4.2 | 16.8 | 5.8 | 11.0 | 6.5 | 20.7 | 7.7 | 8.4 | 7.6 | 7.9 |
| 2013-02-05 | 7.0 | 14.6 | 4.2 | 18.2 | 6.4 | 12.3 | 6.8 | 21.1 | 8.1 | 9.5 | 7.1 | 9.2 |
| 2013-02-12 | 6.8 | 16.2 | 3.4 | 22.2 | 6.4 | 16.1 | 6.9 | 23.6 | 7.8 | 9.4 | 7.1 | 9.1 |
| 2013-02-19 | 6.4 | 18.5 | 2.4 | 25.6 | 6.2 | 19.9 | 6.8 | 25.7 | 7.0 | 11.0 | 7.4 | 10.8 |
| 2013-02-26 | 6.6 | 20.8 | 3.4 | 31.1 | 6.3 | 26.0 | 7.0 | 30.0 | 6.3 | 13.7 | 8.6 | 13.6 |
| 2013-03-05 | 6.7 | 22.7 | 4.7 | 32.0 | 5.2 | 27.8 | 7.0 | 30.1 | 6.7 | 13.9 | 9.3 | 14.0 |
| 2013-03-12 | 6.8 | 23.3 | 5.8 | 32.1 | 4.7 | 28.9 | 7.1 | 29.7 | 6.8 | 14.3 | 9.0 | 14.6 |
| 2013-03-19 | 7.2 | 23.1 | 7.0 | 31.5 | 5.1 | 29.1 | 7.4 | 29.4 | 6.8 | 12.3 | 9.1 | 12.8 |
| 2013-03-26 | 7.5 | 21.7 | 7.3 | 27.8 | 6.0 | 26.5 | 7.8 | 26.4 | 6.7 | 12.3 | 9.0 | 12.9 |
| 2013-04-02 | 7.1 | 20.9 | 6.9 | 26.5 | 6.4 | 25.8 | 7.5 | 25.6 | 5.2 | 12.6 | 8.4 | 12.9 |
| 2013-04-09 | 7.3 | 19.4 | 6.8 | 24.2 | 7.4 | 23.6 | 6.8 | 24.1 | 5.7 | 13.2 | 9.2 | 12.6 |
| 2013-04-16 | 7.8 | 17.9 | 6.9 | 22.7 | 7.7 | 21.6 | 6.7 | 22.2 | 7.2 | 11.6 | 10.1 | 10.5 |
| 2013-04-23 | 7.9 | 17.6 | 7.0 | 23.6 | 7.3 | 22.4 | 6.6 | 22.5 | 8.4 | 12.6 | 9.5 | 11.1 |
| 2013-04-30 | 8.2 | 17.6 | 7.2 | 24.1 | 7.4 | 22.9 | 6.8 | 22.2 | 9.5 | 12.2 | 9.2 | 10.6 |
| 2013-05-07 | 7.8 | 17.9 | 6.8 | 24.4 | 5.6 | 23.0 | 6.9 | 20.1 | 9.9 | 12.1 | 8.3 | 10.3 |
| 2013-05-14 | 7.4 | 19.2 | 6.7 | 27.0 | 4.4 | 25.1 | 6.9 | 19.3 | 10.2 | 12.4 | 7.8 | 10.2 |
| 2013-05-21 | 6.6 | 20.7 | 6.3 | 29.2 | 4.1 | 28.2 | 7.0 | 19.6 | 7.7 | 13.4 | 7.6 | 10.7 |
| 2013-05-28 | 6.7 | 21.3 | 6.3 | 31.3 | 5.4 | 32.2 | 7.0 | 20.8 | 6.9 | 13.8 | 8.1 | 10.9 |
| 2013-06-04 | 7.0 | 22.6 | 6.6 | 31.4 | 7.2 | 35.6 | 7.2 | 22.0 | 6.3 | 13.7 | 8.4 | 11.2 |
| 2013-06-11 | 7.3 | 23.3 | 6.8 | 29.9 | 8.5 | 36.8 | 7.2 | 22.9 | 6.4 | 13.9 | 8.1 | 11.8 |
| 2013-06-04 | 7.0 | 22.6 | 6.6 | 31.4 | 7.2 | 35.6 | 7.2 | 22.0 | 6.3 | 13.7 | 8.4 | 11.2 |
| 2013-06-11 | 7.3 | 23.3 | 6.8 | 29.9 | 8.5 | 36.8 | 7.2 | 22.9 | 6.4 | 13.9 | 8.1 | 11.8 |
| 2013-06-18 | 8.5 | 22.7 | 7.5 | 29.4 | 9.9 | 36.5 | 7.4 | 23.5 | 9.0 | 13.0 | 8.2 | 11.5 |
| 2013-06-25 | 8.7 | 22.2 | 7.5 | 29.0 | 10.4 | 34.3 | 7.6 | 23.4 | 8.8 | 12.4 | 8.3 | 11.5 |
| 2013-07-02 | 8.8 | 21.4 | 7.8 | 27.3 | 10.9 | 29.8 | 7.7 | 21.4 | 7.7 | 11.7 | 8.1 | 11.0 |
| 2013-07-09 | 8.6 | 21.3 | 7.6 | 27.5 | 10.8 | 26.9 | 7.5 | 21.2 | 7.5 | 12.1 | 7.2 | 11.7 |
| 2013-07-16 | 7.9 | 19.3 | 7.3 | 24.9 | 9.3 | 21.9 | 7.2 | 18.2 | 6.3 | 12.1 | 6.9 | 11.9 |
| 2013-07-23 | 7.8 | 18.3 | 8.0 | 23.9 | 8.0 | 20.3 | 7.0 | 17.8 | 7.0 | 12.7 | 7.4 | 12.5 |
| 2013-07-30 | 7.9 | 17.5 | 8.2 | 24.0 | 7.4 | 19.6 | 7.1 | 18.0 | 8.0 | 14.0 | 8.0 | 13.8 |
| 2013-08-06 | 7.6 | 17.4 | 8.2 | 23.6 | 6.2 | 19.4 | 6.9 | 18.2 | 7.1 | 14.5 | 9.0 | 14.4 |
| 2013-08-13 | 7.8 | 16.4 | 8.4 | 22.8 | 6.2 | 18.9 | 7.2 | 17.9 | 6.8 | 13.4 | 9.7 | 13.2 |
| 2013-08-20 | 7.9 | 16.1 | 8.0 | 23.0 | 6.9 | 18.6 | 7.3 | 17.8 | 6.6 | 12.7 | 8.8 | 12.7 |
| 2013-08-27 | 7.8 | 16.2 | 8.0 | 20.5 | 6.8 | 16.7 | 7.4 | 16.4 | 6.6 | 11.3 | 8.0 | 11.5 |
| 2013-09-03 | 7.9 | 15.2 | 8.1 | 19.5 | 7.2 | 16.4 | 7.3 | 16.5 | 6.9 | 11.4 | 8.1 | 11.7 |
| 2013-09-10 | 8.0 | 14.6 | 7.8 | 18.9 | 7.6 | 16.7 | 7.3 | 17.3 | 7.5 | 10.4 | 8.8 | 10.8 |
| 2013-09-17 | 8.2 | 14.0 | 7.6 | 17.7 | 7.1 | 15.6 | 7.9 | 16.7 | 7.2 | 9.1 | 9.1 | 9.4 |
| 2013-09-24 | 8.6 | 12.7 | 7.2 | 19.3 | 7.8 | 17.1 | 8.1 | 18.0 | 7.8 | 9.1 | 9.7 | 9.4 |
| 2013-10-01 | 8.8 | 12.1 | 7.0 | 18.4 | 8.4 | 16.3 | 8.6 | 16.8 | 7.4 | 7.3 | 9.2 | 7.9 |
| 2013-10-08 | 8.5 | 12.2 | 6.7 | 18.9 | 8.5 | 17.2 | 8.4 | 17.1 | 7.4 | 5.9 | 8.1 | 6.6 |
| 2013-10-15 | 7.8 | 12.5 | 6.2 | 18.2 | 7.5 | 17.8 | 7.6 | 17.2 | 7.3 | 5.1 | 7.0 | 6.1 |
| 2013-10-22 | 7.3 | 13.2 | 5.9 | 18.8 | 7.3 | 20.0 | 7.4 | 18.8 | 6.9 | 5.1 | 6.8 | 6.3 |
| 2013-10-29 | 7.3 | 13.9 | 5.7 | 18.1 | 7.8 | 20.1 | 6.9 | 19.1 | 7.6 | 5.1 | 6.7 | 6.3 |
| 2013-11-05 | 7.8 | 13.6 | 5.9 | 18.8 | 8.9 | 21.3 | 7.2 | 20.8 | 8.4 | 5.7 | 7.3 | 6.9 |
| 2013-11-12 | 7.8 | 14.5 | 6.0 | 18.5 | 9.5 | 21.2 | 7.4 | 21.2 | 7.6 | 6.0 | 7.4 | 7.0 |
| 2013-11-19 | 7.6 | 16.2 | 6.1 | 21.9 | 7.7 | 24.7 | 7.3 | 25.6 | 8.3 | 5.9 | 6.6 | 7.0 |
| 2013-11-26 | 7.6 | 17.8 | 5.8 | 23.7 | 7.2 | 26.9 | 7.9 | 28.3 | 8.8 | 6.8 | 6.6 | 7.8 |
| 2013-12-03 | 7.0 | 19.9 | 4.9 | 24.8 | 6.1 | 28.1 | 7.7 | 30.5 | 7.3 | 5.9 | 6.1 | 6.9 |
| 2013-12-10 | 7.3 | 20.2 | 4.5 | 24.3 | 6.1 | 27.8 | 7.9 | 30.9 | 8.3 | 6.2 | 6.9 | 7.0 |
| 2013-12-17 | 7.8 | 18.9 | 4.3 | 22.2 | 8.2 | 24.6 | 7.8 | 28.9 | 8.0 | 6.1 | 8.0 | 6.4 |
| 2013-12-24 | 7.2 | 18.4 | 4.7 | 22.3 | 7.6 | 22.9 | 7.7 | 28.5 | 5.6 | 6.8 | 7.6 | 6.5 |
| 2013-12-31 | 7.5 | 18.1 | 5.7 | 23.0 | 8.1 | 22.0 | 8.1 | 28.3 | 6.3 | 8.0 | 7.6 | 7.1 |
| 2014-01-07 | 7.7 | 16.4 | 5.2 | 20.8 | 7.6 | 18.6 | 7.4 | 25.3 | 4.7 | 8.1 | 6.3 | 7.4 |
| 2014-01-14 | 7.3 | 16.7 | 5.5 | 21.2 | 6.8 | 19.7 | 7.6 | 25.6 | 4.1 | 8.7 | 5.8 | 8.1 |
| 2014-01-21 | 7.9 | 16.3 | 5.2 | 20.1 | 7.0 | 19.4 | 7.6 | 24.3 | 6.4 | 8.1 | 6.6 | 7.7 |
| 2014-01-28 | 7.9 | 15.6 | 6.6 | 20.1 | 6.7 | 20.1 | 8.7 | 24.1 | 7.8 | 6.9 | 7.4 | 6.7 |
| 2014-02-04 | 7.6 | 16.1 | 5.5 | 20.0 | 6.7 | 21.3 | 8.0 | 24.2 | 8.2 | 6.5 | 8.1 | 6.7 |
| 2014-02-11 | 7.3 | 16.4 | 5.0 | 16.9 | 6.1 | 18.0 | 8.0 | 20.7 | 7.8 | 6.5 | 7.6 | 7.3 |
| 2014-02-18 | 7.0 | 15.0 | 4.6 | 16.4 | 6.7 | 17.7 | 7.9 | 20.3 | 6.6 | 7.2 | 7.6 | 8.7 |
| 2014-02-25 | 6.5 | 14.3 | 4.3 | 12.5 | 6.5 | 14.3 | 7.8 | 16.8 | 5.1 | 8.2 | 7.4 | 10.2 |
| 2014-03-04 | 6.3 | 14.1 | 4.0 | 11.8 | 6.7 | 13.3 | 7.2 | 15.0 | 5.0 | 9.1 | 7.4 | 11.6 |
| 2014-03-11 | 6.7 | 12.6 | 4.7 | 14.0 | 7.3 | 16.0 | 7.1 | 16.0 | 5.3 | 9.1 | 8.8 | 11.2 |
| 2014-03-18 | 7.1 | 13.3 | 5.9 | 15.3 | 6.5 | 17.9 | 7.6 | 15.7 | 6.3 | 8.5 | 9.6 | 10.4 |
| 2014-03-25 | 7.7 | 14.3 | 6.8 | 19.7 | 7.4 | 22.1 | 7.8 | 18.0 | 6.6 | 8.4 | 9.6 | 9.7 |
| 2014-04-01 | 8.1 | 15.1 | 8.3 | 21.5 | 7.3 | 24.1 | 8.4 | 18.9 | 7.0 | 8.4 | 9.4 | 8.7 |
| 2014-04-08 | 8.1 | 16.6 | 8.3 | 22.4 | 8.1 | 24.5 | 8.5 | 19.0 | 6.8 | 9.5 | 8.4 | 9.3 |
| 2014-04-15 | 7.8 | 18.2 | 8.5 | 23.7 | 9.0 | 24.9 | 8.4 | 20.3 | 5.8 | 11.1 | 7.1 | 11.0 |
| 2014-04-22 | 7.8 | 18.9 | 8.6 | 24.4 | 8.5 | 25.2 | 8.6 | 21.3 | 5.7 | 11.5 | 7.2 | 12.1 |
| 2014-04-29 | 8.0 | 20.0 | 8.7 | 26.0 | 9.3 | 26.1 | 8.7 | 23.0 | 5.9 | 12.2 | 8.2 | 13.2 |
| 2014-05-06 | 8.4 | 20.3 | 9.0 | 26.7 | 9.6 | 26.3 | 8.8 | 23.7 | 6.4 | 12.3 | 9.4 | 14.0 |
| 2014-05-13 | 8.7 | 19.8 | 8.4 | 27.4 | 9.9 | 26.0 | 8.5 | 23.5 | 7.4 | 11.5 | 10.0 | 13.3 |
| 2014-05-20 | 8.6 | 19.6 | 8.1 | 27.2 | 9.7 | 25.2 | 8.2 | 22.9 | 8.0 | 11.0 | 9.6 | 12.3 |
| 2014-05-27 | 8.0 | 19.4 | 7.7 | 27.2 | 7.9 | 24.8 | 7.8 | 22.5 | 8.0 | 10.8 | 8.4 | 12.1 |
| 2014-06-03 | 7.7 | 18.8 | 7.4 | 26.4 | 7.4 | 23.9 | 7.7 | 21.4 | 8.1 | 10.6 | 8.1 | 11.3 |
| 2014-06-10 | 7.4 | 19.4 | 7.3 | 26.4 | 6.9 | 24.3 | 7.6 | 22.0 | 7.7 | 11.2 | 7.8 | 11.3 |
| 2014-06-17 | 7.3 | 19.8 | 7.1 | 26.9 | 6.8 | 24.7 | 7.3 | 23.0 | 7.6 | 10.8 | 7.7 | 10.7 |
| 2014-06-24 | 7.8 | 19.9 | 7.3 | 28.5 | 8.6 | 25.7 | 7.7 | 24.8 | 7.6 | 11.0 | 8.0 | 10.5 |
Source: NRCan
Crude Oil Overview
Major Crude Oil Benchmarks Pushed Higher on Iraq’s Instability
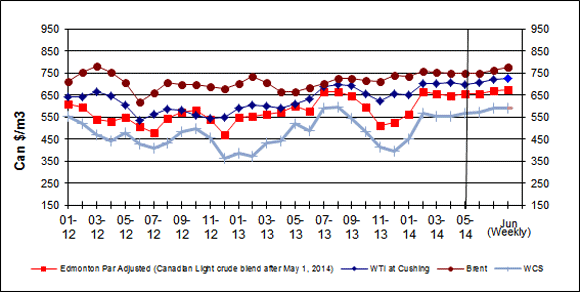
For the week ending June 20, 2014, prices for the four marker crudes averaged between $590/m3 and $777/m3, (US$94 to US$114 per barrel). The price gap between WTI and Brent stood at $52/m3 (US$8 per barrel), while the price differential between the Canadian Light and WTI stood at $53/m3 (US$8 per barrel).
By comparison, Western Canadian Select (WCS) prices averaged $590/m3 (US$94 per barrel). WCS is heavy crude blended with sweet synthetic and condensate diluents. WCS is a heavy sour grade (high sulphur) and requires more time and energy to refine, and so is always sold at a lower price than light crudes.
In Western Canada and Ontario, more than 60% of the crude oil processed by refiners is either conventional light, sweet crude oil or high quality synthetic crude oil. Synthetic crude is a light crude oil that is derived by upgrading oil sands.
Light crude oil prices firmed up on the instability in Iraq and the ongoing risk of supply disruption in the country’s southern oil-producing region. Iraq is the second most important oil-producing country among the Organization of Petroleum Exporting Countries. The threat of the loss of Iraq’s oil supply pushed Brent prices upward. Brent is the main global waterborne crude oil benchmark.
Figure 6: Crude Oil Price Comparisons
Text version
Figure 6
This graph shows crude oil prices for Edmonton Par, WTI and Brent. The average weekly prices for the period ending June 6, 2014, were $655/cubic metres, $705/cubic metres and $747/cubic metres for Edmonton Par, WTI and Brent, respectively.
| Date | Edmonton Par Prices | WTI Prices | Brent Prices |
| 01/12 | 608.11 | 639.88 | 709.45 |
| 02/12 | 594.50 | 640.89 | 750.59 |
| 03/12 | 538.60 | 663.34 | 780.71 |
| 04/12 | 528.21 | 644.60 | 751.91 |
| 05/12 | 548.81 | 601.64 | 704.10 |
| 06/12 | 507.78 | 532.76 | 618.43 |
| 07/12 | 477.07 | 560.69 | 659.07 |
| 08/12 | 544.82 | 587.49 | 707.75 |
| 09/12 | 570.15 | 582.08 | 697.56 |
| 10/12 | 578.61 | 555.66 | 694.60 |
| 11/12 | 539.87 | 543.52 | 686.30 |
| 12/12 | 467.14 | 549.56 | 680.33 |
| 01/13 | 549.97 | 592.14 | 699.83 |
| 02/13 | 553.76 | 605.29 | 736.06 |
| 03/13 | 560.66 | 598.93 | 705.36 |
| 04/13 | 571.20 | 590.06 | 663.78 |
| 05/13 | 598.81 | 608.31 | 662.59 |
| 06/13 | 577.25 | 630.51 | 680.52 |
| 07/13 | 664.03 | 685.36 | 703.73 |
| 08/13 | 665.21 | 697.44 | 722.47 |
| 09/13 | 647.06 | 691.84 | 723.16 |
| 10/13 | 592.41 | 655.54 | 713.92 |
| 11/13 | 511.65 | 620.13 | 711.21 |
| 12/13 | 524.69 | 655.42 | 740.65 |
| 01/14 | 561.87 | 651.27 | 735.43 |
| 02/14 | 665.35 | 699.89 | 756.56 |
| 03/14 | 655.67 | 701.90 | 752.47 |
| 04/14 | 647.62 | 704.92 | 747.57 |
| 05/14 | 652.85 | 697.62 | 748.13 |
| June 6, 2014 | 654.76 | 704.82 | 746.79 |
| June 13, 2014 | 670.83 | 720.89 | 759.68 |
| June 20, 2014 | 673.09 | 725.68 | 777.50 |
Sources: NRCan
| Crude Oil Types | Week Ending: 2014-06-06 |
Change From: Previous Week | Change From: Last Year | |||
|---|---|---|---|---|---|---|
| $Can/ m3 |
$US/ bbl |
$Can/ m3 |
$US/ bbl |
$Can/ m3 |
$US/ bbl |
|
| Canadian Light | 673.09 | 98.78 | +2.27 | +0.77 | +95.19 | +9.45 |
| WTI | 725.68 | 106.50 | +4.79 | +1.18 | +100.48 | +9.84 |
| Brent | 777.50 | 114.10 | +17.82 | +3.12 | +103.90 | +9.96 |
| WCS | 590.40 | 93.86 | +1.98 | +0.31 | +52.72 | +8.38 |
Source: NRCan
Fuel Focus Website and Publications
Natural Resources Canada (NRCan) has published petroleum product prices, the Fuel Focus bi-weekly gasoline report and material related to fuel pricing since July 2006. The purpose of the website is to better communicate with the public about the state of the market and alleviate public concerns about the level and volatility of petroleum product prices, such as gasoline, diesel, and furnace oil.
The need for a price information website arose with recurring volatility in energy markets and prices over the course of the last few decades. Whether this arises from geopolitical instability in the Middle East, supply disruptions or transportation bottlenecks in producing countries, inventory surpluses or shortages, speculation by non-commercial operators, or insufficient or excess refining capacity, there is high public interest in the functioning of the petroleum markets. The Fuel Focus website provides easy access to information for the public and the media.
Consumers and industries have an interest in answers to such questions as:
- What is happening to retail prices?
- Why do they vary from region to region?
- Why do retail prices not adjust immediately to reductions in crude oil prices?
- What are the components that make up petroleum product prices, especially gasoline?
- Can governments do something about higher prices?
The questions often focus on competition and fairness in petroleum markets, pricing and profits, as well as on issues of supply. The role of the Fuel Focus website is partly to help eliminate misconceptions and improve understanding of the federal role, provincial roles, energy polices and crude oil markets.
The factual information also serves the purpose of providing information to government officials for advice to Ministers on market events and possible policy responses. For example, during a period of high fuel prices in 2011, NRCan officials appeared before the House of Commons Standing Committee on Industry, Science and Technology to explain rising gasoline prices.
Analysis of traffic on the Fuel Focus website pages indicates that the most frequently accessed pages relate to fuel prices. The public interest in fuel prices can be closely related to events affecting fuel prices, such as rising gasoline prices in the summer or higher heating fuel prices in the winter. For example, between January 1, 2014 and May 31, 2014, the page viewed most often was the automotive propane prices page, followed by diesel fuel and furnace oil prices. The high propane prices page views are directly tied to concerns over higher propane prices as a result of the propane supply disruption in the eastern parts of Canada and the U.S. this past winter. As readers will recall, propane prices for heating rose significantly. NRCan only collects auto propane prices and in the absence of any other sources for heating propane prices, we assume that the high number of page views for auto propane prices was a proxy for heating propane prices.
By far, the most active day is Tuesday when new prices are released. Overall, between January 1, 2014 and May 31, 2014, there were more than 58,000 web page views for fuel prices, defined as the total number of pages viewed by users. Crude oil prices were viewed more than 17,000 times and the Fuel Focus bi-weekly reports were viewed 1,943 and 351 times in English and in French, respectively.
Note: Web page results are based on Google Analytics website traffic analysis.
Download the report
Fuel Focus - Printable Version [PDF, 462 KB]
To read Adobe Acrobat® files, you will need to download and install the free Acrobat Reader® software available from Adobe Systems Incorporated.
Page details
- Date modified:
