Fuel Focus, September 5, 2014
Table of Contents
National Overview
Canadian Retail Gasoline Prices Increased 1 Cent per Litre from Last Week
For the week ending September 2, 2014, the average Canadian retail gasoline price was $1.33 per litre. This is an increase of less than 1 cent per litre from the previous week and a decrease of 1 cent per litre from a year ago.
Diesel fuel prices rose by nearly 1 cent per litre to $1.30 per litre from the previous week. This is an increase of 1 cent per litre compared to the same period last year. Furnace oil prices declined from the previous week by 0.4 cent to $1.24 per litre, and are 3 cents per litre higher compared to the same period last year.
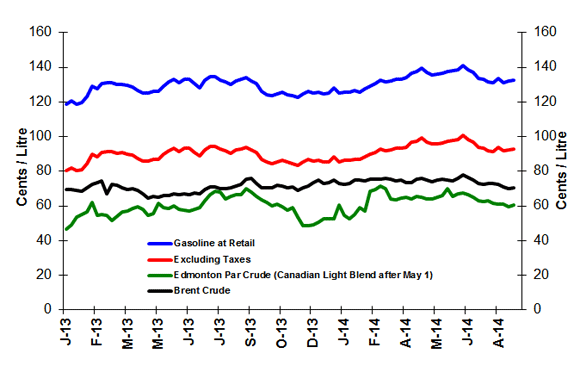
Figure 1: Crude Oil and Regular Gasoline Price Comparison
(National Average)
Text version
Figure 1
The graph shows prices in cents per litre for gasoline at retail, gasoline excluding taxes, and Edmonton Par and Brent crude oil prices. Gasoline prices ended the period of September 2, 2014, at 132.8 cents per litre, excluding taxes at 93.0 cents per litre, Canadian Light Sweet at 60.6 cents per litre and Brent at 70.4 cents per litre.
| Dates | Gasoline at retail | Excluding Taxes | Edmonton Par crude | Brent crude |
|---|---|---|---|---|
| 01/01/2013 | 118.9 | 80.4 | 46.6 | 69.3 |
| 08/01/2013 | 120.6 | 81.9 | 49.4 | 69.5 |
| 15/01/2013 | 118.9 | 80.3 | 53.7 | 69.2 |
| 22/01/2013 | 119.7 | 81.1 | 55.2 | 68.7 |
| 29/01/2013 | 123.3 | 84.3 | 56.6 | 70.7 |
| 05/02/2013 | 129.2 | 89.7 | 61.9 | 72.5 |
| 12/02/2013 | 127.7 | 88.4 | 54.8 | 73.5 |
| 19/02/2013 | 130.5 | 90.9 | 55.3 | 74.6 |
| 26/02/2013 | 131.2 | 91.6 | 54.7 | 67.1 |
| 05/03/2013 | 131.2 | 91.6 | 51.8 | 72.5 |
| 12/03/2013 | 129.9 | 90.4 | 54.2 | 71.8 |
| 19/03/2013 | 130.1 | 90.7 | 56.7 | 70.6 |
| 26/03/2013 | 129.4 | 90.0 | 57.0 | 69.7 |
| 02/04/2013 | 128.7 | 89.3 | 58.4 | 69.9 |
| 09/04/2013 | 126.5 | 87.4 | 59.5 | 68.9 |
| 16/04/2013 | 125.0 | 86.0 | 58.0 | 67.0 |
| 23/04/2013 | 125.1 | 85.9 | 54.8 | 64.4 |
| 30/04/2013 | 126.3 | 87.0 | 55.8 | 65.5 |
| 07/05/2013 | 126.0 | 86.7 | 61.4 | 65.1 |
| 14/05/2013 | 129.3 | 89.8 | 59.1 | 66.1 |
| 21/05/2013 | 131.4 | 91.8 | 58.8 | 66.1 |
| 28/05/2013 | 132.9 | 93.2 | 60.0 | 66.9 |
| 04/06/2013 | 131.1 | 91.5 | 58.1 | 66.6 |
| 11/06/2013 | 132.9 | 93.2 | 57.8 | 66.8 |
| 18/06/2013 | 133.1 | 93.3 | 57.0 | 66.8 |
| 25/06/2013 | 130.5 | 91.0 | 58.0 | 67.4 |
| 02/07/2013 | 128.3 | 88.9 | 59.0 | 67.2 |
| 09/07/2013 | 132.4 | 92.6 | 63.1 | 69.6 |
| 16/07/2013 | 134.4 | 94.3 | 66.6 | 71.2 |
| 23/07/2013 | 134.7 | 94.6 | 68.7 | 71.1 |
| 30/07/2013 | 132.7 | 92.8 | 67.9 | 69.8 |
| 06/08/2013 | 131.5 | 91.7 | 64.1 | 70.1 |
| 13/08/2013 | 130.0 | 90.3 | 65.6 | 70.3 |
| 20/08/2013 | 132.0 | 92.2 | 66.4 | 71.3 |
| 27/08/2013 | 133.0 | 93.0 | 66.4 | 72.3 |
| 03/09/2013 | 133.9 | 93.8 | 70.2 | 75.5 |
| 10/09/2013 | 132.1 | 92.2 | 68.1 | 76.1 |
| 17/09/2013 | 130.6 | 90.8 | 65.8 | 73.0 |
| 24/09/2013 | 126.4 | 87.1 | 63.7 | 70.8 |
| 01/10/2013 | 124.3 | 85.2 | 61.9 | 70.3 |
| 08/10/2013 | 123.6 | 84.6 | 60.1 | 70.6 |
| 15/10/2013 | 124.8 | 85.6 | 60.9 | 71.9 |
| 22/10/2013 | 125.5 | 86.2 | 59.7 | 71.7 |
| 29/10/2013 | 124.4 | 85.2 | 57.4 | 70.6 |
| 05/11/2013 | 123.7 | 84.6 | 58.9 | 71.1 |
| 12/11/2013 | 122.6 | 83.6 | 53.5 | 69.0 |
| 19/11/2013 | 124.6 | 85.3 | 48.7 | 70.7 |
| 26/11/2013 | 126.4 | 86.9 | 48.6 | 71.8 |
| 03/12/2013 | 125.4 | 86.1 | 49.4 | 73.6 |
| 10/12/2013 | 125.9 | 86.5 | 50.9 | 74.9 |
| 17/12/2013 | 124.5 | 85.2 | 52.5 | 73.0 |
| 24/12/2013 | 125.0 | 85.6 | 52.6 | 73.5 |
| 31/12/2013 | 128.3 | 88.6 | 52.6 | 74.9 |
| 07/01/2014 | 125.0 | 85.6 | 60.6 | 73.0 |
| 14/01/2014 | 125.6 | 86.2 | 54.6 | 72.6 |
| 21/01/2014 | 125.7 | 86.3 | 52.8 | 73.2 |
| 28/01/2014 | 126.6 | 87.0 | 55.1 | 74.9 |
| 04/02/2014 | 125.9 | 86.7 | 59.0 | 75.1 |
| 11/02/2014 | 127.6 | 88.2 | 57.0 | 74.4 |
| 18/02/2014 | 129.3 | 89.8 | 68.5 | 75.3 |
| 25/02/2014 | 130.7 | 91.0 | 69.7 | 75.4 |
| 04/03/2014 | 132.5 | 92.7 | 71.5 | 75.4 |
| 11/03/2014 | 131.8 | 92.1 | 70.3 | 75.9 |
| 18/03/2014 | 132.0 | 92.3 | 64.3 | 75.4 |
| 25/03/2014 | 132.9 | 93.2 | 63.4 | 74.7 |
| 01/04/2014 | 132.9 | 93.2 | 64.4 | 75.2 |
| 08/04/2014 | 133.9 | 94.1 | 65.1 | 73.7 |
| 15/04/2014 | 136.8 | 96.7 | 64.2 | 73.8 |
| 22/04/2014 | 137.7 | 97.4 | 65.5 | 75.7 |
| 29/04/2014 | 139.8 | 99.4 | 65.0 | 76.1 |
| 06/05/2014 | 136.9 | 96.8 | 64.2 | 74.8 |
| 13/05/2014 | 135.7 | 95.8 | 64.2 | 73.9 |
| 20/05/2014 | 136.0 | 95.9 | 65.2 | 75.0 |
| 27/05/2014 | 136.8 | 96.6 | 66.2 | 75.5 |
| 03/06/2014 | 137.4 | 97.2 | 70.3 | 75.0 |
| 10/06/2014 | 138.1 | 97.9 | 65.5 | 74.7 |
| 17/06/2014 | 138.8 | 98.5 | 67.1 | 76.0 |
| 24/06/2014 | 141.2 | 100.7 | 67.3 | 77.8 |
| 01/07/2014 | 138.7 | 98.4 | 66.5 | 76.7 |
| 08/07/2014 | 137.2 | 97.0 | 65.2 | 74.9 |
| 15/07/2014 | 133.8 | 93.9 | 62.9 | 72.9 |
| 22/07/2014 | 133.0 | 93.2 | 62.7 | 72.4 |
| 29/07/2014 | 131.8 | 92.1 | 63.0 | 72.9 |
| 05/08/2014 | 131.1 | 91.5 | 63.7 | 72.9 |
| 2014-08-12 | 133.6 | 93.8 | 61.0 | 72.3 |
| 2014-08-19 | 131.3 | 91.7 | 61.1 | 71.1 |
| 26/08/2014 | 132.1 | 92.5 | 59.8 | 70.2 |
| 02/09/2014 | 132.8 | 93.0 | 60.6 | 70.4 |
Figure 2: Weekly Regular Gasoline Prices

Text version
Figure 2
This graph shows the gasoline price trends from 2012 to 2014.
| Date | 2012 Gasoline at Retail | Date | 2013 Gasoline at Retail | Date | 2014 Gasoline at Retail |
|---|---|---|---|---|---|
| 12-01-03 | 120.60 | 13-01-01 | 118.90 | 13-12-31 | 128.30 |
| 12-01-10 | 122.90 | 13-01-08 | 120.60 | 14-01-07 | 125.00 |
| 12-01-17 | 123.00 | 13-01-15 | 118.90 | 14-01-14 | 125.60 |
| 12-01-24 | 123.30 | 13-01-22 | 119.70 | 14-01-21 | 125.70 |
| 12-01-31 | 124.70 | 13-01-29 | 123.30 | 14-01-28 | 126.60 |
| 12-02-07 | 122.70 | 13-02-05 | 129.20 | 14-02-04 | 125.90 |
| 12-02-14 | 126.70 | 13-02-12 | 127.70 | 14-02-11 | 127.60 |
| 12-02-21 | 127.00 | 13-02-19 | 130.50 | 14-02-18 | 129.30 |
| 12-02-28 | 131.70 | 13-02-26 | 131.20 | 14-02-25 | 130.70 |
| 12-03-06 | 127.30 | 13-03-05 | 131.20 | 14-03-04 | 132.50 |
| 12-03-13 | 131.00 | 13-03-12 | 129.90 | 14-03-11 | 131.80 |
| 12-03-20 | 132.80 | 13-03-19 | 130.10 | 14-03-18 | 132.00 |
| 12-03-27 | 132.70 | 13-03-26 | 129.40 | 14-03-25 | 132.90 |
| 12-04-03 | 135.10 | 13-04-02 | 128.70 | 14-04-01 | 132.90 |
| 12-04-10 | 136.40 | 13-04-09 | 126.50 | 14-04-08 | 133.90 |
| 12-04-17 | 136.70 | 13-04-16 | 125.00 | 14-04-15 | 136.80 |
| 12-04-24 | 132.00 | 13-04-23 | 125.10 | 14-04-22 | 137.70 |
| 12-05-01 | 131.90 | 13-04-30 | 126.30 | 14-04-29 | 139.80 |
| 12-05-08 | 129.50 | 13-05-07 | 126.00 | 14-05-06 | 136.90 |
| 12-05-15 | 130.30 | 13-05-14 | 129.30 | 14-05-13 | 135.70 |
| 12-05-22 | 128.50 | 13-05-21 | 131.40 | 14-05-20 | 136.00 |
| 12-05-29 | 129.30 | 13-05-28 | 132.90 | 14-05-27 | 136.80 |
| 12-06-05 | 126.80 | 13-06-04 | 131.10 | 14-06-03 | 137.40 |
| 12-06-12 | 126.70 | 13-06-11 | 132.90 | 14-06-10 | 138.10 |
| 12-06-19 | 126.80 | 13-06-18 | 133.10 | 14-06-17 | 138.80 |
| 12-06-26 | 123.70 | 13-06-25 | 130.50 | 14-06-24 | 141.20 |
| 12-07-03 | 123.10 | 13-07-02 | 128.30 | 14-07-01 | 138.70 |
| 12-07-10 | 126.00 | 13-07-09 | 132.40 | 14-07-08 | 137.20 |
| 12-07-17 | 128.00 | 13-07-16 | 134.40 | 14-07-15 | 133.80 |
| 12-07-24 | 129.20 | 13-07-23 | 134.70 | 14-07-22 | 133.00 |
| 12-07-31 | 127.30 | 13-07-30 | 132.70 | 14-07-29 | 131.80 |
| 12-08-07 | 129.70 | 13-08-06 | 131.50 | 14-08-05 | 131.10 |
| 12-08-14 | 131.00 | 13-08-13 | 130.00 | 14-08-12 | 133.60 |
| 12-08-21 | 130.30 | 13-08-20 | 132.00 | 14-08-19 | 131.30 |
| 12-08-28 | 130.60 | 13-08-27 | 133.00 | 14-08-26 | 132.10 |
| 12-09-04 | 130.90 | 13-09-03 | 133.90 | 14-09-02 | 132.80 |
| 12-09-11 | 132.20 | 13-09-10 | 132.10 | 14-09-09 | |
| 12-09-18 | 134.60 | 13-09-17 | 130.60 | 14-09-16 | |
| 12-09-25 | 128.90 | 13-09-24 | 126.40 | 14-09-23 | |
| 12-10-02 | 132.80 | 13-10-01 | 124.30 | 14-09-30 | |
| 12-10-09 | 133.00 | 13-10-08 | 123.60 | 14-10-07 | |
| 12-10-16 | 130.10 | 13-10-15 | 124.80 | 14-10-14 | |
| 12-10-23 | 124.30 | 13-10-22 | 125.50 | 14-10-21 | |
| 12-10-30 | 123.50 | 13-10-29 | 124.40 | 14-10-28 | |
| 12-11-06 | 121.60 | 13-11-05 | 123.70 | 14-11-04 | |
| 12-11-13 | 122.50 | 13-11-12 | 122.60 | 14-11-11 | |
| 12-11-20 | 122.20 | 13-11-19 | 124.60 | 14-11-18 | |
| 12-11-27 | 122.60 | 13-11-26 | 126.40 | 14-11-25 | |
| 12-12-04 | 120.90 | 13-12-03 | 125.40 | 14-12-02 | |
| 12-12-11 | 117.30 | 13-12-10 | 125.90 | 14-12-09 | |
| 12-12-18 | 117.70 | 13-12-17 | 124.50 | 14-12-16 | |
| 12-12-25 | 119.00 | 13-12-24 | 125.00 | 14-12-23 | |
| 13-12-31 | 128.30 | 14-12-30 |
| ¢/L | Week of: 2014-09-02 | Change from: Previous Week | Change from: Last Year |
|---|---|---|---|
| Gasoline | 132.8 | +0.6 | -1.1 |
| Diesel | 129.8 | +0.6 | +1.3 |
| Furnace Oil | 124.2 | -0.4 | +3.3 |
Source: NRCan
| 2014-09-02 | ¢/kilogram | ¢/L gasoline equivalent | ¢/L diesel equivalent |
|---|---|---|---|
| Vancouver | 119.9 | 79.1 | 82.0 |
| Edmonton | 115.1 | 75.9 | 78.7 |
| Toronto | 128.3 | 84.6 | 87.8 |
Source: ¢/kg Kent Marketing Services Limited
Recent Developments
- U.S. Gasoline Prices Falling: The U.S. average retail price for regular gasoline was $3.45/gallon ($US 0.91 per litre) on August 25, 2014, the lowest price on the Monday before Labor Day since 2010. The average price at the pump is now 25 cents/gallon lower than it was at the end of June. A lower North Sea Brent crude oil price is the main driver of the decline in the gasoline price. (Source: U.S. Energy Information Administration, This Week in Petroleum)
Note: Canadian retail pump prices registered $1.32 per litre on August 26, 2014, which is nearly the same level for the same time period in 2012 and 2013. Since June 2014, average Canadian gasoline prices have fluctuated downward by 9 cents per litre from a high of $1.41 per litre. - World Gasoline Demand to Fall 4% by 2035: According to Navigant Research, world gasoline consumption in road transportation will rise from 362 billion gallons in 2014 to 367 billion in 2021, then fall to 348 billion in 2035. The decline reflects moves by governments to address the costs of oil dependency in transportation in terms of energy security, environmental security, and economic stability. The subsidization of alternative fuels and alternative fuel vehicles, the implementation of biofuel mandates, and tightening of fuel economy requirements for new vehicles are making an impact on global oil demand. (Source: Ontario Ministry of Energy, Fuels and Vehicles Report)
- Gasoline Consumption Increased by 2%: Canadians consumed 18 billion litres of gasoline in the first five months of 2014 or 2% more than the same period last year. In the same period, diesel fuel sales also increased by 2% to 12 billion litres, while furnace oil sales declined by 4% to 1.3 billion litres. (Statistics Canada, Cansim Table 134-0004)
Retail Gasoline Overview
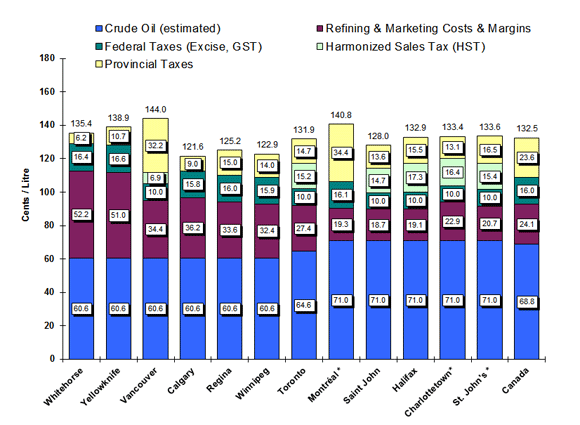
The average Canadian pump price in selected cities for the four-week average ending September 2, 2014, was $1.33 per litre, an increase of less than 1 cent per litre from the last report on August 22, 2014. This represents a 0.2 cent-per-litre increase compared to the same period in 2013.
The four-week average crude oil price decreased by 1 cent per litre to 69 cents per litre compared to two weeks ago. This represents a 0.4 cent-per-litre decrease compared to the same time last year.
On average retail gasoline prices in most western centres—Vancouver to Winnipeg—increased by 1 cent per litre when compared to the previous report and ranged from $1.22 to $1.44 per litre. Prices in eastern cities—Toronto to St. John’s—declined by less than 1 cent per litre and ranged from $1.28 to $1.41 cents per litre.
At the national level, refining and marketing costs and margins increased 1.5 cents per litre to 24 cents per litre. This represents an increase of less than 1 cent per litre compared to the same time last year.
Figure 3: Regular Gasoline Pump Prices in Selected Cities Four-Week Average (August 12 to September 2, 2014)
Text version
Figure 3
This graph shows the gasoline price components for 2 territories and 10 cities plus the national average.
| Whitehorse | Yellowknife | Vancouver | Calgary | Regina | Winnipeg | Toronto | Montreal* | Saint John* | Halifax* | Charlottetown* | St. John's* | Canada | |
|---|---|---|---|---|---|---|---|---|---|---|---|---|---|
| Pump Price/Prix à la pompe | 135.4 | 138.9 | 144.0 | 121.6 | 125.2 | 122.9 | 131.9 | 140.8 | 128.0 | 132.9 | 133.4 | 133.6 | 132.5 |
| Crude (est.) / Brut (est.) | 60.6 | 60.6 | 60.6 | 60.6 | 60.6 | 60.6 | 64.6 | 71.0 | 71.0 | 71.0 | 71.0 | 71.0 | 68.8 |
| Federal Taxes / Taxes fédérales | 16.4 | 16.6 | 10.0 | 15.8 | 16.0 | 15.9 | 10.0 | 16.1 | 10.0 | 10.0 | 10.0 | 10.0 | 16.0 |
| Provincial Tax / Taxe provinciale | 6.2 | 10.7 | 32.2 | 9.0 | 15.0 | 14.0 | 14.7 | 34.4 | 13.6 | 15.5 | 13.1 | 16.5 | 23.6 |
| HST | 6.9 | 15.2 | 14.7 | 17.3 | 16.4 | 15.4 | |||||||
| Refining & Marketing Costs & Margins / Coûts et | 52.2 | 51.0 | 34.4 | 36.2 | 33.6 | 32.4 | 27.4 | 19.3 | 18.7 | 19.1 | 22.9 | 20.7 | 24.1 |
Source: NRCan
* Regulated Markets
Note: Toronto crude oil cost includes pipeline tolls of $4 per barrel for light crude oil from Edmonton to Sarnia, Ontario.
Why are Gasoline Prices Volatile?
Changes in global crude oil prices cause most of the volatility and fluctuations in gasoline prices. Crude oil prices are affected by many factors, such as geopolitical events in the Middle East and North Africa, changes in drilling and investment in crude oil, and productive capacity, weather, and other factors.
Following the Western Accord with Alberta, British Columbia and Saskatchewan, and subsequent market deregulation and the Free Trade agreement with the U.S., the Government of Canada does not control crude oil prices. It does, however, monitor competitive conditions and practices in petroleum markets to ensure that markets are providing competitive prices to Canadians, and to ensure there is no anti-competitive behaviour, such as price fixing or collusion. Provincial governments have jurisdiction over retail prices of petroleum products.
Canada is committed to a market-based approach to oil and fuel prices. This means that the government relies upon competitive markets to determine prices. Overall, the market-based approach helps ensure that the amount of fuel available and the amount needed by consumers and businesses are balanced at a competitive price.
Wholesale Gasoline Prices
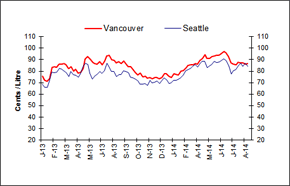
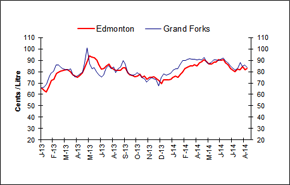
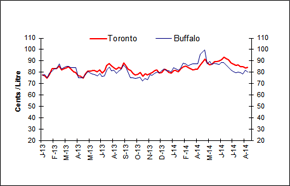
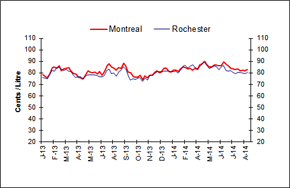
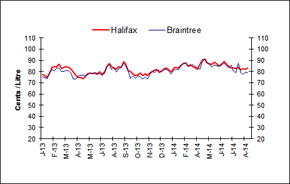
Wholesale gasoline prices for the week ending August 28, 2014, ranged from an increase of 1 cent per litre to a decrease of more than 3 cents per litre compared to the previous week.
In the eastern markets of Canada and the United States, wholesale gasoline prices registered an increase of 1 cent per litre compared to the previous week. Prices for the period ended in the 79 to 84 cent-per-litre range.
Western wholesale gasoline prices ended between 83 to 87 cents per litre, ranging from an increase of 1 cent per litre to a decrease of 3 cents per litre.
Overall, compared to the same period last year, prices ranged from an increase of 4 cents per litre to a decrease of nearly 9 cents per litre.
 |
 |
|
 |
 |
|
 |
Text version
Figure 4
This graph shows the trend in wholesale gasoline prices for selected centres in Canada and the U.S.
| DATE | Halifax | Braintree | Montreal | Rochester | Toronto | Buffalo | Edmonton | Grand Forks | Vancouver | Seattle |
|---|---|---|---|---|---|---|---|---|---|---|
| Thu 03-Jan-13 | 77.50 | 75.42 | 78.60 | 75.82 | 77.50 | 77.31 | 65.40 | 66.07 | 75.50 | 68.79 |
| Thu 10-Jan-13 | 76.70 | 74.48 | 77.40 | 75.49 | 76.90 | 77.88 | 63.40 | 66.67 | 72.40 | 65.77 |
| Thu 17-Jan-13 | 74.80 | 73.73 | 75.40 | 74.81 | 75.00 | 74.96 | 62.40 | 69.13 | 70.90 | 65.72 |
| Thu 13-Dec-12 | 72.10 | 70.22 | 74.90 | 71.94 | 73.90 | 77.52 | 67.70 | 64.43 | 70.50 | 65.70 |
| Thu 24-Jan-13 | 79.00 | 78.00 | 79.00 | 78.15 | 78.30 | 78.93 | 66.80 | 75.06 | 73.50 | 70.59 |
| Thu 31-Jan-13 | 84.10 | 81.70 | 84.70 | 81.81 | 83.50 | 80.51 | 72.50 | 78.85 | 83.40 | 79.19 |
| Thu 07-Feb-13 | 84.60 | 80.98 | 85.10 | 81.47 | 83.20 | 83.16 | 73.10 | 80.16 | 84.00 | 78.87 |
| Thu 14-Feb-13 | 84.50 | 83.61 | 84.20 | 84.35 | 83.20 | 83.55 | 78.10 | 86.03 | 83.30 | 79.18 |
| Thu 21-Feb-13 | 86.70 | 83.01 | 85.90 | 84.51 | 85.40 | 87.44 | 79.70 | 85.90 | 86.00 | 82.60 |
| Thu 28-Feb-13 | 82.80 | 80.41 | 81.90 | 83.34 | 81.90 | 83.14 | 80.50 | 83.70 | 86.20 | 81.99 |
| Thu 07-Mar-13 | 84.10 | 80.00 | 83.60 | 82.22 | 83.30 | 84.09 | 81.00 | 82.56 | 86.90 | 80.15 |
| Thu 14-Mar-13 | 84.60 | 81.52 | 84.00 | 83.10 | 83.90 | 85.12 | 81.70 | 82.24 | 85.40 | 78.61 |
| Thu 21-Mar-13 | 84.10 | 80.55 | 84.50 | 81.59 | 84.80 | 84.95 | 81.80 | 81.66 | 82.10 | 75.28 |
| Thu 28-Mar-13 | 82.00 | 79.08 | 81.50 | 80.79 | 82.60 | 84.24 | 80.20 | 82.51 | 83.80 | 79.62 |
| Thu 04-Apr-13 | 79.40 | 73.32 | 79.50 | 77.54 | 80.60 | 84.10 | 77.40 | 78.17 | 80.20 | 77.14 |
| Thu 11-Apr-13 | 77.30 | 73.36 | 78.90 | 75.92 | 79.80 | 83.84 | 75.90 | 75.52 | 81.50 | 76.23 |
| Thu 18-Apr-13 | 74.70 | 75.92 | 76.30 | 76.28 | 77.10 | 75.04 | 74.90 | 76.41 | 78.50 | 74.77 |
| Thu 25-Apr-13 | 74.80 | 77.01 | 75.90 | 76.42 | 76.70 | 75.40 | 76.80 | 78.08 | 79.00 | 77.56 |
| Thu 02-May-13 | 73.50 | 76.65 | 74.50 | 75.00 | 75.00 | 75.38 | 78.80 | 79.70 | 82.00 | 83.51 |
| Thu 09-May-13 | 75.10 | 76.22 | 77.60 | 77.03 | 78.50 | 77.88 | 83.90 | 87.57 | 90.80 | 87.15 |
| Thu 16-May-13 | 78.10 | 77.25 | 81.50 | 78.21 | 80.90 | 80.54 | 89.30 | 101.10 | 92.50 | 85.64 |
| Thu 23-May-13 | 78.60 | 78.37 | 80.50 | 78.09 | 81.30 | 79.53 | 94.20 | 86.80 | 90.30 | 78.24 |
| Thu 30-May-13 | 78.40 | 78.36 | 79.80 | 77.90 | 81.40 | 78.43 | 92.60 | 82.64 | 87.60 | 73.33 |
| Thu 06-Jun-13 | 78.70 | 78.91 | 80.50 | 78.17 | 81.60 | 78.16 | 92.40 | 83.64 | 86.60 | 76.00 |
| Thu 13-Jun-13 | 77.80 | 78.32 | 78.90 | 77.45 | 80.60 | 76.84 | 90.20 | 79.79 | 86.00 | 77.78 |
| Thu 20-Jun-13 | 80.10 | 78.00 | 81.00 | 76.50 | 82.00 | 79.30 | 86.20 | 76.78 | 88.10 | 79.78 |
| Thu 27-Jun-13 | 77.80 | 76.96 | 78.10 | 76.22 | 79.40 | 76.41 | 82.40 | 75.29 | 85.70 | 77.93 |
| Thu 04-Jul-13 | 79.80 | 78.53 | 81.30 | 77.56 | 81.80 | 76.93 | 82.70 | 77.19 | 88.70 | 80.47 |
| Thu 11-Jul-13 | 84.60 | 84.52 | 86.30 | 82.08 | 85.80 | 82.51 | 85.00 | 83.36 | 93.40 | 87.07 |
| Thu 18-Jul-13 | 87.10 | 86.48 | 87.80 | 82.88 | 87.80 | 84.45 | 86.70 | 85.15 | 93.90 | 82.94 |
| Thu 25-Jul-15 | 84.40 | 81.63 | 84.80 | 79.09 | 85.40 | 81.21 | 84.10 | 82.55 | 89.90 | 79.53 |
| Thu 01-Aug-13 | 83.20 | 83.68 | 84.00 | 80.06 | 84.10 | 81.93 | 82.00 | 84.32 | 89.50 | 79.81 |
| Thu 08-Aug-13 | 82.30 | 79.58 | 82.20 | 76.89 | 82.60 | 78.85 | 81.10 | 78.95 | 87.00 | 75.45 |
| Thu 15-Aug-13 | 84.20 | 83.01 | 84.40 | 80.94 | 84.20 | 81.32 | 81.20 | 82.30 | 88.50 | 76.76 |
| Thu 22-Aug-13 | 83.90 | 83.75 | 84.00 | 82.03 | 83.50 | 82.16 | 80.90 | 84.32 | 86.40 | 76.73 |
| Thu 29-Aug-13 | 88.90 | 87.42 | 88.30 | 85.55 | 88.10 | 86.41 | 83.40 | 89.62 | 88.90 | 80.31 |
| Thu 05-Sep-13 | 86.70 | 84.77 | 86.20 | 83.13 | 85.90 | 84.03 | 83.20 | 86.81 | 86.50 | 79.97 |
| Thu 12-Sep-13 | 81.00 | 79.52 | 80.90 | 77.16 | 82.90 | 78.97 | 79.20 | 79.37 | 84.00 | 78.65 |
| Thu 19-Sep-13 | 79.70 | 73.77 | 80.20 | 73.60 | 81.60 | 75.45 | 77.10 | 77.32 | 83.70 | 74.59 |
| Thu 26-Sep-13 | 77.40 | 75.99 | 77.00 | 74.69 | 78.70 | 75.25 | 76.50 | 76.96 | 80.90 | 74.43 |
| Thu 03-Oct-13 | 76.50 | 73.93 | 76.00 | 74.33 | 77.80 | 74.45 | 75.60 | 77.48 | 79.10 | 73.09 |
| Thu 10-Oct-13 | 77.00 | 76.23 | 76.40 | 75.22 | 78.20 | 75.24 | 76.20 | 79.28 | 76.80 | 71.32 |
| Thu 17-Oct-13 | 78.80 | 75.48 | 78.00 | 75.66 | 79.80 | 75.64 | 77.80 | 77.39 | 78.30 | 68.82 |
| Thu 24-Oct-13 | 76.30 | 73.26 | 74.20 | 72.60 | 76.40 | 76.40 | 75.10 | 74.67 | 75.20 | 68.55 |
| Thu 31-Oct-13 | 78.40 | 74.83 | 77.40 | 75.50 | 78.90 | 74.66 | 75.90 | 73.89 | 75.50 | 69.29 |
| Thu 07-Nov-13 | 76.50 | 73.29 | 75.40 | 73.47 | 77.70 | 73.62 | 73.10 | 70.87 | 73.90 | 67.58 |
| Thu 14-Nov-13 | 78.50 | 78.01 | 77.70 | 77.49 | 78.90 | 78.23 | 74.80 | 73.14 | 74.60 | 71.77 |
| Thu 21-Nov-13 | 80.00 | 80.43 | 77.80 | 77.74 | 79.80 | 77.16 | 75.30 | 74.96 | 73.50 | 69.75 |
| Thu 28-Nov-13 | 81.30 | 78.79 | 80.20 | 79.06 | 81.60 | 79.32 | 75.50 | 73.46 | 74.60 | 70.20 |
| Thu 05-Dec-13 | 81.30 | 81.98 | 81.70 | 80.77 | 81.90 | 79.95 | 74.00 | 73.04 | 74.70 | 71.18 |
| Thu 12-Dec-13 | 79.30 | 80.57 | 80.00 | 80.76 | 79.60 | 79.52 | 72.30 | 67.30 | 73.60 | 69.01 |
| Thu 19-Dec-13 | 80.60 | 80.41 | 80.60 | 80.76 | 79.80 | 81.20 | 69.40 | 74.95 | 74.60 | 71.49 |
| Thu 26-Dec-13 | 82.50 | 82.08 | 84.20 | 81.35 | 82.80 | 82.75 | 72.70 | 77.90 | 77.80 | 73.92 |
| Thu 02-Jan-14 | 83.00 | 81.60 | 83.90 | 81.26 | 82.40 | 81.49 | 72.90 | 77.05 | 77.80 | 72.33 |
| Thu 09-Jan-14 | 81.80 | 79.89 | 81.30 | 81.25 | 80.00 | 81.12 | 72.60 | 77.50 | 75.40 | 69.37 |
| Thu 16-Jan-14 | 79.90 | 78.10 | 80.80 | 80.69 | 79.20 | 80.27 | 73.60 | 78.54 | 74.50 | 69.50 |
| Thu 23-Jan-14 | 83.30 | 81.27 | 82.50 | 80.86 | 81.50 | 84.27 | 75.20 | 81.56 | 77.80 | 72.04 |
| Thu 30-Jan-14 | 83.60 | 81.57 | 82.50 | 81.27 | 81.60 | 84.27 | 75.90 | 82.75 | 77.20 | 72.24 |
| Thu 06-Feb-14 | 83.00 | 81.77 | 81.00 | 79.85 | 80.60 | 82.00 | 75.00 | 82.38 | 76.40 | 73.02 |
| Thu 13-Feb-14 | 85.40 | 84.58 | 83.50 | 82.68 | 83.50 | 83.54 | 77.70 | 86.24 | 79.80 | 74.26 |
| Thu 20-Feb-14 | 87.30 | 87.33 | 84.90 | 85.83 | 85.20 | 88.00 | 79.60 | 89.82 | 80.40 | 76.56 |
| Thu 27-Feb-14 | 87.60 | 87.64 | 84.60 | 86.29 | 85.70 | 87.43 | 83.00 | 89.92 | 82.60 | 80.13 |
| Thu 06-Mar-14 | 85.10 | 84.56 | 83.30 | 84.37 | 84.20 | 85.84 | 84.10 | 91.11 | 84.80 | 81.55 |
| Thu 13-Mar-14 | 85.90 | 84.97 | 83.80 | 85.80 | 83.50 | 86.75 | 85.30 | 91.48 | 85.40 | 82.23 |
| Thu 20-Mar-14 | 84.20 | 86.34 | 82.40 | 86.82 | 82.10 | 87.62 | 85.00 | 91.13 | 85.70 | 84.11 |
| Thu 27-Mar-14 | 83.40 | 84.62 | 84.62 | 84.72 | 82.80 | 87.34 | 85.90 | 90.80 | 86.80 | 85.82 |
| Thu 03-Apr-14 | 81.90 | 82.99 | 83.10 | 83.94 | 82.50 | 87.19 | 85.30 | 90.11 | 85.90 | 83.37 |
| Thu 10-Apr-14 | 86.70 | 82.53 | 86.50 | 85.36 | 86.00 | 95.70 | 88.00 | 91.01 | 89.40 | 86.71 |
| Thu 17-Apr-14 | 90.60 | 88.47 | 87.90 | 88.00 | 88.70 | 97.62 | 88.80 | 90.24 | 91.20 | 88.76 |
| Thu 24-Apr-14 | 91.30 | 91.03 | 90.10 | 89.26 | 91.40 | 99.92 | 90.50 | 92.66 | 94.50 | 88.79 |
| Thu 01-May-14 | 87.60 | 88.06 | 87.00 | 86.18 | 88.80 | 87.36 | 88.70 | 88.15 | 91.30 | 83.13 |
| Thu 08-May-14 | 86.90 | 87.20 | 84.80 | 83.61 | 86.60 | 89.49 | 86.60 | 87.11 | 91.00 | 84.56 |
| Thu 15-May-14 | 86.50 | 84.35 | 85.10 | 84.57 | 87.20 | 86.86 | 86.90 | 88.18 | 92.50 | 85.56 |
| Thu 22-May-14 | 88.30 | 85.62 | 86.70 | 85.75 | 89.30 | 88.24 | 88.30 | 90.07 | 93.20 | 88.76 |
| Thu 29-May-14 | 87.30 | 85.51 | 86.80 | 85.31 | 89.40 | 87.46 | 88.60 | 90.44 | 93.60 | 87.32 |
| Thu 05-Jun-14 | 84.80 | 84.40 | 86.10 | 82.54 | 89.80 | 86.83 | 90.60 | 89.57 | 93.60 | 88.04 |
| Thu 12-Jun-14 | 86.10 | 87.14 | 86.30 | 84.73 | 91.30 | 88.58 | 89.80 | 90.68 | 95.40 | 89.01 |
| Thu 19-Jun-14 | 88.80 | 87.87 | 89.70 | 86.27 | 93.50 | 88.82 | 90.50 | 91.88 | 97.40 | 90.68 |
| Thu 26-Jun-14 | 87.20 | 85.34 | 88.00 | 82.13 | 92.30 | 86.41 | 87.70 | 89.10 | 95.80 | 89.24 |
| Thu 03-Jul-14 | 85.20 | 83.69 | 86.20 | 81.51 | 91.00 | 83.83 | 86.10 | 87.49 | 92.60 | 84.50 |
| Thu 10-Jul-14 | 83.30 | 85.59 | 84.00 | 81.81 | 88.30 | 81.79 | 82.70 | 85.06 | 87.10 | 77.57 |
| Thu 17-Jul-14 | 83.00 | 80.56 | 83.20 | 80.28 | 87.00 | 80.73 | 81.10 | 83.27 | 85.90 | 80.33 |
| Thu 24-Jul-14 | 82.80 | 79.09 | 82.80 | 79.34 | 86.20 | 79.74 | 80.00 | 81.68 | 85.80 | 81.44 |
| Thu 31-Jul-14 | 83.80 | 87.46 | 83.40 | 80.18 | 86.40 | 80.24 | 82.20 | 83.30 | 87.80 | 84.44 |
| Thu 07-Aug-14 | 81.40 | 79.26 | 81.80 | 80.46 | 84.90 | 79.89 | 81.90 | 88.04 | 87.30 | 86.85 |
| Thu 14-Aug-14 | 82.60 | 77.16 | 82.40 | 79.65 | 84.90 | 78.55 | 84.30 | 84.66 | 87.00 | 84.17 |
| Thu 21-Aug-14 | 81.90 | 79.42 | 81.70 | 79.51 | 83.90 | 81.73 | 81.80 | 85.88 | 86.20 | 87.20 |
| Thu 28-Aug-14 | 83.10 | 78.90 | 82.80 | 80.35 | 84.40 | 80.39 | 82.90 | 83.88 | 86.70 | 83.98 |
Sources: NRCan, Bloomberg Oil Buyers Guide
Gasoline Refining and Marketing Margins
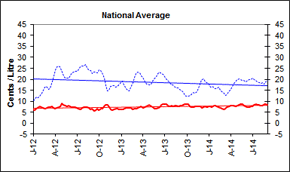
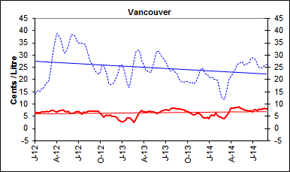
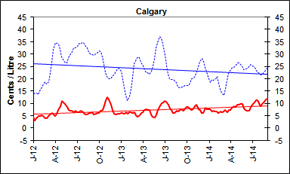
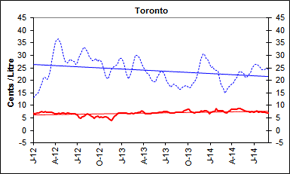
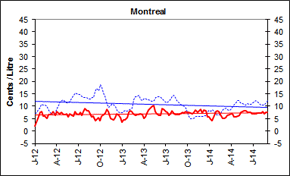
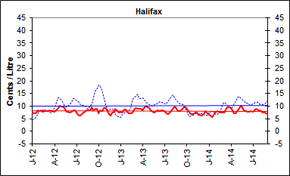
Four-week rolling averages are used for the gasoline refining and marketing margins. Figure 5 shows the trends for the period ending September 2, 2014.
National average gasoline margins ended the week at nearly 20 cents, 4 cents per litre higher than at the same period last year. The refining and marketing margins for gasoline refer to the difference between the cost of the crude oil and the wholesale price at which a refiner can sell gasoline. The margin includes the costs associated with the refining of the product as well as a profit for the refiner.
Marketing margins hovered at 8 cents per litre and represent the difference between the wholesale and retail prices of gasoline. This margin pays for the costs associated with storing the gasoline until it is delivered, transporting it to the local service station, and operating the retail station.
 |
 |
|
 |
 |
|
 |
 |
Text version
Figure 5
These graphs show the trend in refining and marketing costs and margins for selected centres in Canada and the national average.
| 4-week rolling average | Canada | Vancouver | Calgary | Toronto | Montreal | Halifax | ||||||
|---|---|---|---|---|---|---|---|---|---|---|---|---|
| Marketing Margin | Refining Margin | Marketing Margin | Refining Margin | Marketing Margin | Refining Margin | Marketing Margin | Refining Margin | Marketing Margin | Refining Margin | Marketing Margin | Refining Margin | |
| 2012-01-03 | 6.1 | 10.4 | 6.9 | 14.1 | 4.6 | 13.9 | 6.9 | 13.0 | 1.9 | 7.1 | 7.3 | 4.4 |
| 2012-01-10 | 6.1 | 11.3 | 6.4 | 14.9 | 3.0 | 14.2 | 6.7 | 13.8 | 3.7 | 7.5 | 7.1 | 5.0 |
| 2012-01-17 | 6.5 | 11.8 | 6.4 | 15.4 | 4.0 | 14.1 | 6.9 | 14.5 | 5.1 | 8.7 | 7.2 | 6.0 |
| 2012-01-24 | 7.3 | 11.5 | 6.3 | 15.1 | 5.0 | 13.6 | 7.0 | 14.9 | 7.5 | 9.1 | 8.3 | 6.5 |
| 2012-01-31 | 7.6 | 12.3 | 6.7 | 16.6 | 5.0 | 15.0 | 7.4 | 17.3 | 8.0 | 10.6 | 8.2 | 8.1 |
| 2012-02-07 | 7.2 | 13.6 | 6.8 | 16.6 | 5.2 | 16.5 | 7.4 | 18.9 | 6.2 | 10.6 | 8.4 | 8.2 |
| 2012-02-14 | 7.0 | 15.2 | 6.8 | 17.4 | 4.8 | 17.9 | 7.3 | 20.8 | 6.1 | 10.3 | 7.8 | 8.4 |
| 2012-02-21 | 6.6 | 16.2 | 6.9 | 18.5 | 3.9 | 18.6 | 7.5 | 21.4 | 5.1 | 10.1 | 7.9 | 8.7 |
| 2012-02-28 | 6.8 | 16.9 | 6.8 | 19.3 | 3.9 | 17.7 | 7.3 | 20.3 | 6.5 | 8.8 | 8.0 | 8.2 |
| 2012-03-06 | 7.1 | 15.4 | 7.2 | 22.2 | 4.9 | 18.9 | 7.3 | 21.6 | 6.7 | 7.7 | 8.1 | 7.9 |
| 2012-03-13 | 7.3 | 16.2 | 7.5 | 26.6 | 5.6 | 22.4 | 7.4 | 23.8 | 6.9 | 6.9 | 8.4 | 7.6 |
| 2012-03-20 | 7.5 | 18.1 | 7.5 | 31.2 | 6.0 | 26.7 | 7.2 | 27.6 | 7.8 | 6.4 | 8.0 | 7.3 |
| 2012-03-27 | 6.9 | 20.1 | 7.1 | 36.2 | 5.6 | 31.9 | 6.9 | 32.5 | 6.3 | 6.9 | 8.0 | 7.7 |
| 2012-04-03 | 6.8 | 24.3 | 6.8 | 39.0 | 4.8 | 34.7 | 6.7 | 35.3 | 7.8 | 8.7 | 7.6 | 9.6 |
| 2012-04-10 | 7.1 | 25.8 | 7.1 | 38.3 | 5.8 | 34.4 | 6.8 | 36.2 | 7.4 | 10.4 | 8.4 | 11.4 |
| 2012-04-17 | 7.5 | 26.2 | 7.5 | 37.4 | 7.2 | 33.9 | 7.0 | 36.6 | 6.9 | 12.1 | 8.8 | 13.1 |
| 2012-04-24 | 8.0 | 25.7 | 7.4 | 34.4 | 9.0 | 31.8 | 6.7 | 34.9 | 7.6 | 12.4 | 10.0 | 13.3 |
| 2012-05-01 | 9.3 | 23.3 | 7.8 | 31.6 | 11.0 | 28.9 | 7.0 | 32.0 | 6.5 | 12.6 | 9.8 | 12.6 |
| 2012-05-08 | 8.7 | 21.7 | 7.2 | 31.0 | 10.5 | 27.3 | 6.9 | 29.5 | 6.6 | 12.0 | 9.8 | 11.3 |
| 2012-05-15 | 8.4 | 20.7 | 6.8 | 32.0 | 9.7 | 26.3 | 6.6 | 27.5 | 6.8 | 11.2 | 9.2 | 10.1 |
| 2012-05-22 | 8.0 | 20.6 | 7.0 | 33.2 | 8.6 | 26.3 | 7.0 | 27.0 | 5.9 | 11.4 | 7.8 | 9.7 |
| 2012-05-29 | 8.1 | 20.5 | 6.2 | 37.0 | 7.4 | 28.4 | 6.8 | 28.0 | 7.0 | 12.0 | 7.8 | 10.1 |
| 2012-06-05 | 8.0 | 21.8 | 6.1 | 38.6 | 7.1 | 30.0 | 6.5 | 28.5 | 6.3 | 13.2 | 7.6 | 10.9 |
| 2012-06-12 | 7.5 | 22.8 | 6.2 | 37.9 | 7.0 | 30.9 | 6.7 | 27.8 | 6.2 | 14.0 | 7.9 | 11.5 |
| 2012-06-19 | 7.8 | 23.3 | 6.7 | 38.0 | 6.3 | 32.5 | 6.7 | 27.5 | 8.0 | 15.3 | 8.3 | 12.9 |
| 2012-06-26 | 7.6 | 23.7 | 6.8 | 35.7 | 6.8 | 32.5 | 6.6 | 26.5 | 6.9 | 15.2 | 8.4 | 12.9 |
| 2012-07-03 | 7.3 | 23.7 | 7.0 | 34.9 | 6.5 | 33.0 | 6.1 | 27.0 | 6.6 | 14.8 | 7.3 | 12.1 |
| 2012-07-10 | 7.0 | 24.5 | 6.6 | 35.3 | 6.3 | 34.4 | 5.3 | 29.0 | 7.4 | 14.7 | 6.4 | 11.8 |
| 2012-07-17 | 6.6 | 25.8 | 5.9 | 34.9 | 7.0 | 34.0 | 4.9 | 30.9 | 6.3 | 14.0 | 6.2 | 10.7 |
| 2012-07-24 | 7.1 | 25.9 | 6.7 | 35.0 | 6.6 | 34.6 | 5.4 | 32.5 | 7.7 | 13.6 | 6.9 | 10.3 |
| 2012-07-31 | 7.6 | 26.1 | 6.6 | 34.3 | 6.2 | 34.6 | 5.8 | 33.3 | 9.0 | 13.4 | 7.5 | 10.4 |
| 2012-08-07 | 7.5 | 26.6 | 6.8 | 32.0 | 5.3 | 33.2 | 6.3 | 32.7 | 8.1 | 13.5 | 7.6 | 9.9 |
| 2012-08-14 | 7.6 | 25.4 | 7.1 | 30.2 | 5.5 | 32.4 | 6.7 | 31.2 | 8.2 | 13.0 | 8.4 | 9.3 |
| 2012-08-21 | 7.2 | 24.5 | 7.1 | 27.9 | 6.1 | 30.7 | 6.3 | 29.3 | 6.9 | 12.8 | 8.4 | 8.8 |
| 2012-08-28 | 6.5 | 23.9 | 7.1 | 26.4 | 6.0 | 30.0 | 5.8 | 28.8 | 5.8 | 13.6 | 8.2 | 9.9 |
| 2012-09-04 | 6.5 | 22.7 | 7.1 | 25.2 | 6.5 | 29.7 | 5.5 | 27.9 | 6.1 | 13.4 | 9.6 | 10.9 |
| 2012-09-11 | 5.6 | 23.3 | 7.0 | 23.6 | 5.3 | 29.3 | 4.8 | 28.3 | 4.2 | 15.9 | 8.4 | 13.5 |
| 2012-09-18 | 6.1 | 23.3 | 7.2 | 22.8 | 5.9 | 30.1 | 5.4 | 28.8 | 4.8 | 17.3 | 9.0 | 15.8 |
| 2012-09-25 | 6.5 | 22.9 | 7.0 | 22.3 | 6.2 | 30.4 | 5.7 | 27.6 | 5.4 | 16.4 | 8.8 | 16.4 |
| 2012-10-02 | 5.9 | 24.2 | 6.3 | 23.3 | 6.0 | 31.2 | 5.3 | 28.3 | 4.3 | 18.7 | 7.0 | 18.5 |
| 2012-10-09 | 6.6 | 23.8 | 5.7 | 25.6 | 6.9 | 31.1 | 5.4 | 27.5 | 6.1 | 17.4 | 8.4 | 17.9 |
| 2012-10-16 | 6.7 | 22.9 | 4.7 | 26.6 | 7.3 | 29.3 | 5.2 | 26.3 | 6.8 | 15.7 | 8.0 | 16.6 |
| 2012-10-23 | 7.5 | 20.4 | 5.1 | 24.4 | 9.1 | 25.9 | 5.5 | 23.7 | 7.2 | 14.0 | 9.3 | 14.3 |
| 2012-10-30 | 8.5 | 17.2 | 5.5 | 21.6 | 11.4 | 22.0 | 5.5 | 20.9 | 8.6 | 10.3 | 9.3 | 10.3 |
| 2012-11-06 | 8.3 | 14.8 | 5.1 | 18.7 | 12.4 | 20.3 | 5.1 | 20.8 | 7.9 | 9.6 | 8.5 | 8.6 |
| 2012-11-13 | 7.3 | 15.1 | 5.4 | 17.2 | 11.5 | 19.3 | 4.6 | 21.7 | 5.2 | 10.4 | 6.7 | 8.7 |
| 2012-11-20 | 6.3 | 16.8 | 5.1 | 18.2 | 9.4 | 20.0 | 4.1 | 24.4 | 4.7 | 10.8 | 6.1 | 8.9 |
| 2012-11-27 | 6.0 | 17.2 | 5.0 | 18.7 | 7.3 | 21.2 | 4.9 | 25.5 | 4.4 | 10.8 | 7.4 | 8.9 |
| 2012-12-04 | 6.2 | 17.2 | 4.8 | 20.1 | 5.8 | 21.8 | 5.8 | 25.7 | 5.5 | 9.9 | 7.5 | 8.6 |
| 2012-12-11 | 6.5 | 16.3 | 4.3 | 19.3 | 5.5 | 21.0 | 6.1 | 24.0 | 6.9 | 7.9 | 9.1 | 6.3 |
| 2012-12-18 | 6.7 | 16.6 | 3.6 | 23.2 | 5.8 | 24.0 | 7.1 | 27.1 | 6.5 | 7.8 | 8.0 | 6.0 |
| 2012-12-25 | 6.4 | 17.7 | 3.0 | 25.6 | 5.8 | 24.4 | 6.8 | 28.8 | 5.4 | 7.5 | 7.4 | 5.8 |
| 2013-01-01 | 6.2 | 18.6 | 2.8 | 25.9 | 6.1 | 23.1 | 7.1 | 28.9 | 3.6 | 7.3 | 7.7 | 5.6 |
| 2013-01-08 | 6.4 | 19.0 | 2.7 | 24.5 | 6.0 | 19.8 | 7.1 | 27.6 | 4.4 | 8.0 | 7.5 | 6.6 |
| 2013-01-15 | 6.5 | 17.5 | 3.5 | 22.2 | 5.9 | 16.3 | 6.8 | 25.5 | 4.6 | 8.2 | 8.5 | 7.2 |
| 2013-01-22 | 6.9 | 15.6 | 4.4 | 20.2 | 6.3 | 14.3 | 7.0 | 23.9 | 5.5 | 8.3 | 8.5 | 7.6 |
| 2013-01-29 | 6.9 | 15.0 | 4.2 | 16.8 | 5.8 | 11.0 | 6.5 | 20.7 | 7.7 | 8.4 | 7.6 | 7.9 |
| 2013-02-05 | 7.0 | 14.6 | 4.2 | 18.2 | 6.4 | 12.3 | 6.8 | 21.1 | 8.1 | 9.5 | 7.1 | 9.2 |
| 2013-02-12 | 6.8 | 16.2 | 3.4 | 22.2 | 6.4 | 16.1 | 6.9 | 23.6 | 7.8 | 9.4 | 7.1 | 9.1 |
| 2013-02-19 | 6.4 | 18.5 | 2.4 | 25.6 | 6.2 | 19.9 | 6.8 | 25.7 | 7.0 | 11.0 | 7.4 | 10.8 |
| 2013-02-26 | 6.6 | 20.8 | 3.4 | 31.1 | 6.3 | 26.0 | 7.0 | 30.0 | 6.3 | 13.7 | 8.6 | 13.6 |
| 2013-03-05 | 6.7 | 22.7 | 4.7 | 32.0 | 5.2 | 27.8 | 7.0 | 30.1 | 6.7 | 13.9 | 9.3 | 14.0 |
| 2013-03-12 | 6.8 | 23.3 | 5.8 | 32.1 | 4.7 | 28.9 | 7.1 | 29.7 | 6.8 | 14.3 | 9.0 | 14.6 |
| 2013-03-19 | 7.2 | 23.1 | 7.0 | 31.5 | 5.1 | 29.1 | 7.4 | 29.4 | 6.8 | 12.3 | 9.1 | 12.8 |
| 2013-03-26 | 7.5 | 21.7 | 7.3 | 27.8 | 6.0 | 26.5 | 7.8 | 26.4 | 6.7 | 12.3 | 9.0 | 12.9 |
| 2013-04-02 | 7.1 | 20.9 | 6.9 | 26.5 | 6.4 | 25.8 | 7.5 | 25.6 | 5.2 | 12.6 | 8.4 | 12.9 |
| 2013-04-09 | 7.3 | 19.4 | 6.8 | 24.2 | 7.4 | 23.6 | 6.8 | 24.1 | 5.7 | 13.2 | 9.2 | 12.6 |
| 2013-04-16 | 7.8 | 17.9 | 6.9 | 22.7 | 7.7 | 21.6 | 6.7 | 22.2 | 7.2 | 11.6 | 10.1 | 10.5 |
| 2013-04-23 | 7.9 | 17.6 | 7.0 | 23.6 | 7.3 | 22.4 | 6.6 | 22.5 | 8.4 | 12.6 | 9.5 | 11.1 |
| 2013-04-30 | 8.2 | 17.6 | 7.2 | 24.1 | 7.4 | 22.9 | 6.8 | 22.2 | 9.5 | 12.2 | 9.2 | 10.6 |
| 2013-05-07 | 7.8 | 17.9 | 6.8 | 24.4 | 5.6 | 23.0 | 6.9 | 20.1 | 9.9 | 12.1 | 8.3 | 10.3 |
| 2013-05-14 | 7.4 | 19.2 | 6.7 | 27.0 | 4.4 | 25.1 | 6.9 | 19.3 | 10.2 | 12.4 | 7.8 | 10.2 |
| 2013-05-21 | 6.6 | 20.7 | 6.3 | 29.2 | 4.1 | 28.2 | 7.0 | 19.6 | 7.7 | 13.4 | 7.6 | 10.7 |
| 2013-05-28 | 6.7 | 21.3 | 6.3 | 31.3 | 5.4 | 32.2 | 7.0 | 20.8 | 6.9 | 13.8 | 8.1 | 10.9 |
| 2013-06-04 | 7.0 | 22.6 | 6.6 | 31.4 | 7.2 | 35.6 | 7.2 | 22.0 | 6.3 | 13.7 | 8.4 | 11.2 |
| 2013-06-11 | 7.3 | 23.3 | 6.8 | 29.9 | 8.5 | 36.8 | 7.2 | 22.9 | 6.4 | 13.9 | 8.1 | 11.8 |
| 2013-06-04 | 7.0 | 22.6 | 6.6 | 31.4 | 7.2 | 35.6 | 7.2 | 22.0 | 6.3 | 13.7 | 8.4 | 11.2 |
| 2013-06-11 | 7.3 | 23.3 | 6.8 | 29.9 | 8.5 | 36.8 | 7.2 | 22.9 | 6.4 | 13.9 | 8.1 | 11.8 |
| 2013-06-18 | 8.5 | 22.7 | 7.5 | 29.4 | 9.9 | 36.5 | 7.4 | 23.5 | 9.0 | 13.0 | 8.2 | 11.5 |
| 2013-06-25 | 8.7 | 22.2 | 7.5 | 29.0 | 10.4 | 34.3 | 7.6 | 23.4 | 8.8 | 12.4 | 8.3 | 11.5 |
| 2013-07-02 | 8.8 | 21.4 | 7.8 | 27.3 | 10.9 | 29.8 | 7.7 | 21.4 | 7.7 | 11.7 | 8.1 | 11.0 |
| 2013-07-09 | 8.6 | 21.3 | 7.6 | 27.5 | 10.8 | 26.9 | 7.5 | 21.2 | 7.5 | 12.1 | 7.2 | 11.7 |
| 2013-07-16 | 7.9 | 19.3 | 7.3 | 24.9 | 9.3 | 21.9 | 7.2 | 18.2 | 6.3 | 12.1 | 6.9 | 11.9 |
| 2013-07-23 | 7.8 | 18.3 | 8.0 | 23.9 | 8.0 | 20.3 | 7.0 | 17.8 | 7.0 | 12.7 | 7.4 | 12.5 |
| 2013-07-30 | 7.9 | 17.5 | 8.2 | 24.0 | 7.4 | 19.6 | 7.1 | 18.0 | 8.0 | 14.0 | 8.0 | 13.8 |
| 2013-08-06 | 7.6 | 17.4 | 8.2 | 23.6 | 6.2 | 19.4 | 6.9 | 18.2 | 7.1 | 14.5 | 9.0 | 14.4 |
| 2013-08-13 | 7.8 | 16.4 | 8.4 | 22.8 | 6.2 | 18.9 | 7.2 | 17.9 | 6.8 | 13.4 | 9.7 | 13.2 |
| 2013-08-20 | 7.9 | 16.1 | 8.0 | 23.0 | 6.9 | 18.6 | 7.3 | 17.8 | 6.6 | 12.7 | 8.8 | 12.7 |
| 2013-08-27 | 7.8 | 16.2 | 8.0 | 20.5 | 6.8 | 16.7 | 7.4 | 16.4 | 6.6 | 11.3 | 8.0 | 11.5 |
| 2013-09-03 | 7.9 | 15.2 | 8.1 | 19.5 | 7.2 | 16.4 | 7.3 | 16.5 | 6.9 | 11.4 | 8.1 | 11.7 |
| 2013-09-10 | 8.0 | 14.6 | 7.8 | 18.9 | 7.6 | 16.7 | 7.3 | 17.3 | 7.5 | 10.4 | 8.8 | 10.8 |
| 2013-09-17 | 8.2 | 14.0 | 7.6 | 17.7 | 7.1 | 15.6 | 7.9 | 16.7 | 7.2 | 9.1 | 9.1 | 9.4 |
| 2013-09-24 | 8.6 | 12.7 | 7.2 | 19.3 | 7.8 | 17.1 | 8.1 | 18.0 | 7.8 | 9.1 | 9.7 | 9.4 |
| 2013-10-01 | 8.8 | 12.1 | 7.0 | 18.4 | 8.4 | 16.3 | 8.6 | 16.8 | 7.4 | 7.3 | 9.2 | 7.9 |
| 2013-10-08 | 8.5 | 12.2 | 6.7 | 18.9 | 8.5 | 17.2 | 8.4 | 17.1 | 7.4 | 5.9 | 8.1 | 6.6 |
| 2013-10-15 | 7.8 | 12.5 | 6.2 | 18.2 | 7.5 | 17.8 | 7.6 | 17.2 | 7.3 | 5.1 | 7.0 | 6.1 |
| 2013-10-22 | 7.3 | 13.2 | 5.9 | 18.8 | 7.3 | 20.0 | 7.4 | 18.8 | 6.9 | 5.1 | 6.8 | 6.3 |
| 2013-10-29 | 7.3 | 13.9 | 5.7 | 18.1 | 7.8 | 20.1 | 6.9 | 19.1 | 7.6 | 5.1 | 6.7 | 6.3 |
| 2013-11-05 | 7.8 | 13.6 | 5.9 | 18.8 | 8.9 | 21.3 | 7.2 | 20.8 | 8.4 | 5.7 | 7.3 | 6.9 |
| 2013-11-12 | 7.8 | 14.5 | 6.0 | 18.5 | 9.5 | 21.2 | 7.4 | 21.2 | 7.6 | 6.0 | 7.4 | 7.0 |
| 2013-11-19 | 7.6 | 16.2 | 6.1 | 21.9 | 7.7 | 24.7 | 7.3 | 25.6 | 8.3 | 5.9 | 6.6 | 7.0 |
| 2013-11-26 | 7.6 | 17.8 | 5.8 | 23.7 | 7.2 | 26.9 | 7.9 | 28.3 | 8.8 | 6.8 | 6.6 | 7.8 |
| 2013-12-03 | 7.0 | 19.9 | 4.9 | 24.8 | 6.1 | 28.1 | 7.7 | 30.5 | 7.3 | 5.9 | 6.1 | 6.9 |
| 2013-12-10 | 7.3 | 20.2 | 4.5 | 24.3 | 6.1 | 27.8 | 7.9 | 30.9 | 8.3 | 6.2 | 6.9 | 7.0 |
| 2013-12-17 | 7.8 | 18.9 | 4.3 | 22.2 | 8.2 | 24.6 | 7.8 | 28.9 | 8.0 | 6.1 | 8.0 | 6.4 |
| 2013-12-24 | 7.2 | 18.4 | 4.7 | 22.3 | 7.6 | 22.9 | 7.7 | 28.5 | 5.6 | 6.8 | 7.6 | 6.5 |
| 2013-12-31 | 7.5 | 18.1 | 5.7 | 23.0 | 8.1 | 22.0 | 8.1 | 28.3 | 6.3 | 8.0 | 7.6 | 7.1 |
| 2014-01-07 | 7.7 | 16.4 | 5.2 | 20.8 | 7.6 | 18.6 | 7.4 | 25.3 | 4.7 | 8.1 | 6.3 | 7.4 |
| 2014-01-14 | 7.3 | 16.7 | 5.5 | 21.2 | 6.8 | 19.7 | 7.6 | 25.6 | 4.1 | 8.7 | 5.8 | 8.1 |
| 2014-01-21 | 7.9 | 16.3 | 5.2 | 20.1 | 7.0 | 19.4 | 7.6 | 24.3 | 6.4 | 8.1 | 6.6 | 7.7 |
| 2014-01-28 | 7.9 | 15.6 | 6.6 | 20.1 | 6.7 | 20.1 | 8.7 | 24.1 | 7.8 | 6.9 | 7.4 | 6.7 |
| 2014-02-04 | 7.6 | 16.1 | 5.5 | 20.0 | 6.7 | 21.3 | 8.0 | 24.2 | 8.2 | 6.5 | 8.1 | 6.7 |
| 2014-02-11 | 7.3 | 16.4 | 5.0 | 16.9 | 6.1 | 18.0 | 8.0 | 20.7 | 7.8 | 6.5 | 7.6 | 7.3 |
| 2014-02-18 | 7.0 | 15.0 | 4.6 | 16.4 | 6.7 | 17.7 | 7.9 | 20.3 | 6.6 | 7.2 | 7.6 | 8.7 |
| 2014-02-25 | 6.5 | 14.3 | 4.3 | 12.5 | 6.5 | 14.3 | 7.8 | 16.8 | 5.1 | 8.2 | 7.4 | 10.2 |
| 2014-03-04 | 6.3 | 14.1 | 4.0 | 11.8 | 6.7 | 13.3 | 7.2 | 15.0 | 5.0 | 9.1 | 7.4 | 11.6 |
| 2014-03-11 | 6.7 | 12.6 | 4.7 | 14.0 | 7.3 | 16.0 | 7.1 | 16.0 | 5.3 | 9.1 | 8.8 | 11.2 |
| 2014-03-18 | 7.1 | 13.3 | 5.9 | 15.3 | 6.5 | 17.9 | 7.6 | 15.7 | 6.3 | 8.5 | 9.6 | 10.4 |
| 2014-03-25 | 7.7 | 14.3 | 6.8 | 19.7 | 7.4 | 22.1 | 7.8 | 18.0 | 6.6 | 8.4 | 9.6 | 9.7 |
| 2014-04-01 | 8.1 | 15.1 | 8.3 | 21.5 | 7.3 | 24.1 | 8.4 | 18.9 | 7.0 | 8.4 | 9.4 | 8.7 |
| 2014-04-08 | 8.1 | 16.6 | 8.3 | 22.4 | 8.1 | 24.5 | 8.5 | 19.0 | 6.8 | 9.5 | 8.4 | 9.3 |
| 2014-04-15 | 7.8 | 18.2 | 8.5 | 23.7 | 9.0 | 24.9 | 8.4 | 20.3 | 5.8 | 11.1 | 7.1 | 11.0 |
| 2014-04-22 | 7.8 | 18.9 | 8.6 | 24.4 | 8.5 | 25.2 | 8.6 | 21.3 | 5.7 | 11.5 | 7.2 | 12.1 |
| 2014-04-29 | 8.0 | 20.0 | 8.7 | 26.0 | 9.3 | 26.1 | 8.7 | 23.0 | 5.9 | 12.2 | 8.2 | 13.2 |
| 2014-05-06 | 8.4 | 20.3 | 9.0 | 26.7 | 9.6 | 26.3 | 8.8 | 23.7 | 6.4 | 12.3 | 9.4 | 14.0 |
| 2014-05-13 | 8.7 | 19.8 | 8.4 | 27.4 | 9.9 | 26.0 | 8.5 | 23.5 | 7.4 | 11.5 | 10.0 | 13.3 |
| 2014-05-20 | 8.6 | 19.6 | 8.1 | 27.2 | 9.7 | 25.2 | 8.2 | 22.9 | 8.0 | 11.0 | 9.6 | 12.3 |
| 2014-05-27 | 8.0 | 19.4 | 7.7 | 27.2 | 7.9 | 24.8 | 7.8 | 22.5 | 8.0 | 10.8 | 8.4 | 12.1 |
| 2014-06-03 | 7.7 | 18.8 | 7.4 | 26.4 | 7.4 | 23.9 | 7.7 | 21.4 | 8.1 | 10.6 | 8.1 | 11.3 |
| 2014-06-10 | 7.4 | 19.4 | 7.3 | 26.4 | 6.9 | 24.3 | 7.6 | 22.0 | 7.7 | 11.2 | 7.8 | 11.3 |
| 2014-06-17 | 7.3 | 19.8 | 7.1 | 26.9 | 6.8 | 24.7 | 7.3 | 23.0 | 7.6 | 10.8 | 7.7 | 10.7 |
| 2014-06-24 | 7.8 | 19.9 | 7.3 | 28.5 | 8.6 | 25.7 | 7.7 | 24.8 | 7.6 | 11.0 | 8.0 | 10.5 |
| 2014-07-01 | 7.8 | 20.7 | 6.9 | 29.1 | 9.3 | 25.1 | 7.3 | 25.8 | 6.9 | 11.3 | 7.8 | 10.7 |
| 2014-07-08 | 8.2 | 20.0 | 7.7 | 28.0 | 10.0 | 24.0 | 7.7 | 25.6 | 7.1 | 10.8 | 8.2 | 10.3 |
| 2014-07-15 | 8.6 | 19.4 | 7.6 | 27.9 | 11.4 | 23.8 | 7.8 | 26.4 | 6.9 | 12.2 | 8.9 | 11.6 |
| 2014-07-22 | 8.4 | 19.0 | 7.3 | 26.2 | 11.2 | 22.4 | 7.1 | 25.6 | 7.2 | 11.6 | 8.7 | 11.3 |
| 2014-07-29 | 8.3 | 18.4 | 7.9 | 24.5 | 9.9 | 21.5 | 7.4 | 24.6 | 7.1 | 11.1 | 8.3 | 11.0 |
| 2014-08-05 | 7.9 | 18.2 | 7.6 | 24.6 | 8.9 | 21.6 | 7.2 | 24.4 | 7.2 | 10.4 | 8.1 | 10.4 |
| 2014-08-12 | 8.0 | 18.4 | 8.1 | 25.1 | 9.7 | 21.8 | 7.3 | 24.4 | 7.8 | 10.3 | 7.6 | 10.5 |
| 2014-08-19 | 8.6 | 17.8 | 8.3 | 25.2 | 10.5 | 22.3 | 7.3 | 24.2 | 7.0 | 10.1 | 7.8 | 10.4 |
| 2014-08-26 | 8.6 | 18.6 | 8.1 | 25.9 | 11.4 | 23.4 | 6.9 | 24.5 | 7.5 | 11.3 | 7.2 | 11.6 |
| 2014-09-02 | 8.4 | 19.5 | 7.9 | 26.6 | 11.8 | 24.5 | 6.8 | 24.7 | 7.4 | 12.2 | 7.0 | 12.5 |
Source: NRCan
Crude Oil Overview
Overall Crude Oil Prices Trend Lower
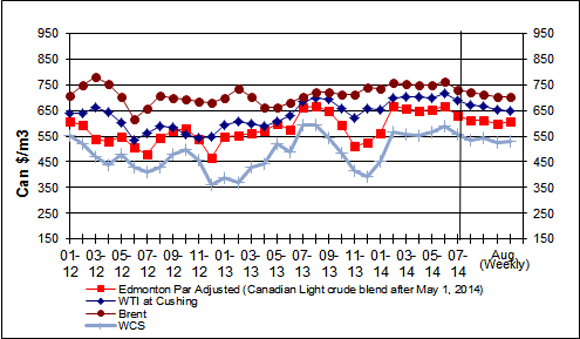
For the week ending August 29, 2014, prices for the three marker light crudes averaged between $606/m3 and $704/m3, (US$88 to US$103 per barrel). Compared to the previous week, the price for Brent and the Canadian Light crudes increased by $2/m3 and $8/m3 (US$0.55 to US$1.43 per barrel), respectively, while WTI prices dropped $6/m3 (US$0.59 per barrel).
Brent crude oil prices traded at a premium to WTI by a margin of $57/m3 (US$8 per barrel). Western Canadian Select prices averaged $531/m3 (US$77 per barrel), up $6/m3 (US$1 per barrel) from the previous week.
While the Russia-Ukraine conflict caused upward pressure on Brent crude oil prices, the risk premium seems to be partly offset by increases in Libyan oil exports and the reduced risk for Iraqi oil exports.
High U.S. crude oil inventory levels and lower refinery demand helped moderate the rise in WTI crude oil prices, which in turn put downward pressure on refined product prices.
Figure 6: Crude Oil Price Comparisons
Text version
Figure 6
This graph shows crude oil prices for Edmonton Par (Canadian Light Sweet after May 1, 2014), WTI, Brent and WCS. The average weekly prices for the period ending August 29, 2014, were $606/cubic metres, $647 cubic metres, $704/cubic metres and $531/cubic metres for the Canadian Light, WTI, Brent and WCS, respectively. Please note that as of May 1, 2014, the Edmonton Par crude oil prices are discontinued and replaced with the Canadian Light Sweet, a blend traded daily on the Net Energy Index and considered a benchmark crude for the Canadian crude market.
| Dates | Edmonton Par Prices (Canadian Light Sweet afterMay 1, 2014) |
WTI | Brent | WCS |
|---|---|---|---|---|
| 01/12 | 608.11 | 639.88 | 709.45 | 551.13 |
| 02/12 | 594.50 | 640.89 | 750.59 | 520.48 |
| 03/12 | 538.60 | 663.34 | 780.71 | 468.90 |
| 04/12 | 528.21 | 644.60 | 751.91 | 439.53 |
| 05/12 | 548.81 | 601.64 | 704.10 | 477.03 |
| 06/12 | 507.78 | 532.76 | 618.43 | 429.13 |
| 07/12 | 477.07 | 560.69 | 659.07 | 408.58 |
| 08/12 | 544.82 | 587.49 | 707.75 | 430.74 |
| 09/12 | 570.15 | 582.08 | 697.56 | 481.00 |
| 10/12 | 578.61 | 555.66 | 694.60 | 496.00 |
| 11/12 | 539.87 | 543.52 | 686.30 | 454.40 |
| 12/12 | 467.14 | 549.56 | 680.33 | 360.23 |
| 01/13 | 549.97 | 592.14 | 699.83 | 387.55 |
| 02/13 | 553.76 | 605.29 | 736.06 | 370.93 |
| 03/13 | 560.66 | 598.93 | 705.36 | 430.10 |
| 04/13 | 571.20 | 590.06 | 663.78 | 441.27 |
| 05/13 | 598.81 | 608.31 | 662.59 | 519.16 |
| 06/13 | 577.25 | 630.51 | 680.52 | 489.10 |
| 07/13 | 664.03 | 685.36 | 703.73 | 592.16 |
| 08/13 | 665.21 | 697.44 | 722.47 | 595.65 |
| 09/13 | 647.06 | 691.84 | 723.16 | 543.60 |
| 10/13 | 592.41 | 655.54 | 713.92 | 483.77 |
| 11/13 | 511.65 | 620.13 | 711.21 | 413.23 |
| 12/13 | 524.69 | 655.42 | 740.65 | 394.48 |
| 01/14 | 561.87 | 651.27 | 735.43 | 452.06 |
| 02/14 | 665.35 | 699.89 | 756.56 | 566.93 |
| 03/14 | 655.67 | 701.90 | 752.47 | 554.81 |
| 04/14 | 647.62 | 704.92 | 747.57 | 550.77 |
| 05/14 | 652.85 | 697.62 | 748.13 | 566.87 |
| 06/14 | 665.50 | 715.93 | 762.22 | 589.57 |
| July 4, 2014 | 651.71 | 703.00 | 749.35 | 561.05 |
| July 11, 2014 | 629.36 | 688.74 | 728.76 | 540.83 |
| July 18, 2014 | 627.34 | 687.24 | 723.61 | 528.94 |
| July 25, 2014 | 629.82 | 695.83 | 728.64 | 539.58 |
| August 1, 2014 | 614.31 | 682.52 | 728.63 | 529.33 |
| August 8, 2014 | 610.28 | 671.27 | 722.88 | 533.53 |
| August 15, 2014 | 610.50 | 667.95 | 711.40 | 544.40 |
| August 22, 2014 | 597.81 | 652.64 | 701.88 | 525.80 |
| August 29, 2014 | 606.24 | 647.08 | 704.08 | 531.40 |
Sources: NRCan
| Crude Oil Types | Week Ending: 2014-08-29 |
Change From: Previous Week | Change From: Last Year | |||
|---|---|---|---|---|---|---|
| $Can/ m3 |
$US/ bbl |
$Can/ m3 |
$US/ bbl |
$Can/ m3 |
$US/ bbl |
|
| Canadian Light | 606.24 | 88.37 | +8.42 | +1.43 | -94.14 | -17.50 |
| WTI | 647.08 | 94.32 | -5.56 | -0.59 | -69.32 | -13.98 |
| Brent | 704.08 | 102.62 | +2.20 | +0.55 | -51.21 | -11.55 |
| WCS | 531.40 | 77.46 | +5.60 | +0.99 | -25.83 | -6.78 |
Source: NRCan
Canada's Energy Policy
Canada's energy policy is guided by a series of principles, agreements and accords. The main principles of Canada’s energy policy are as follows.
Market orientation: Markets are the most effective way of determining supply, demand, prices and trade, while ensuring an efficient, competitive and innovative energy system that is responsive to Canada's energy needs.
Respect for jurisdictional authority and the role of the provinces: Provincial governments are the direct managers of most of Canada's resources and have responsibilities for resource management within their borders.
Where necessary, targeted intervention occurs in the market process to achieve specific policy objectives through regulation or other means. These policy objectives include issues of health and safety (e.g., pipeline regulation) and environmental sustainability.
Over time, numerous federal decisions have also contributed to our energy policy, such as the creation of the National Energy Board; the Canadian Nuclear Safety Commission; Atomic Energy of Canada Limited; and sustained funding of the Program on Energy Research and Development.
Source: Natural Resources Canada
Download the report
Fuel Focus - Printable Version [PDF, 529 KB]
To read Adobe Acrobat® files, you will need to download and install the free Acrobat Reader® software available from Adobe Systems Incorporated.
Page details
- Date modified:
