
ARCHIVED - Energy Efficiency in Buildings
Information Archived on the Web
Information identified as archived on the Web is for reference, research or recordkeeping purposes. It has not been altered or updated after the date of archiving. Web pages that are archived on the Web are not subject to the Government of Canada Web Standards. As per the Communications Policy of the Government of Canada, you can request alternate formats. Please "contact us" to request a format other than those available.
Benchmarking and Best Practices Guide for College Facility Managers
Table of Contents
1. The Benefits of Good Energy Management
2. Managing Energy at the College
4. Benchmarking Energy Performance
6. Improving Energy Efficiency
The Benchmarking and Best Practices Guide for College Facility Managers is intended to help college facility managers calculate their college's benchmark performance and compare it with that of others in the same region and across the country. It also includes suggestions on planning an energy management program and tips on energy-saving opportunities and their potential cost savings.
Intended to be an "eye opener" and to raise questions, this is a good first step on the road to energy savings.
1. The Benefits of Good Energy Management
Good energy management avoids unnecessary costs. This guide may help facility managers to avoid overspending by identifying sources of energy inefficiency and provides tips on:
- identifying sources of energy inefficiency;
- reducing energy consumption through good management practices;
- reducing the unit price for energy;
- achieving better value for money; and
- comparing your facility's energy consumption and costs with those of similar colleges.
1.1 Benefits to Colleges
Some colleges are making significant financial gains and helping to improve the environment by saving on their energy costs. Avoiding energy costs provides more funds for books and equipment, while good energy management provides valuable curriculum opportunities, strengthens management and increases comfort levels.
1.2 The Environmental Picture
In 1992, at the United Nations Conference on Environment and Development in Rio de Janeiro, world nations signed an agenda for the 21st century in which countries or nations are encouraged to adopt the principles of sustainable development. Each college can play its part in helping this process.
In 1997, at the Third Conference of Parties to the United Nations Framework Convention on Climate Change in Kyoto, a world target reduction of greenhouse gas emissions of 5.2 percent from 1990 levels by 2012 was established. Canada agreed to a target of 6 percent, representing 36 million tonnes of carbon dioxide based on 1990 levels of consumption.
Natural Resources Canada offers a variety of programs through the Office of Energy Efficiency (OEE) to assist all sectors of the economy to save energy and reduce greenhouse gas emissions. The Energy Innovators Initiative addresses the college sector. In addition, a strategic partnership was formed between the OEE and the Association of Canadian Community Colleges to promote energy efficiency and climate change awareness in the college sector.
By managing energy more effectively, colleges could save up to 20 percent of their energy costs. Energy inefficiency is caused by inefficient plants, poor controls, lack of energy awareness and outdated practices. Canadian colleges spend about $130 million each year on energy. Avoiding unnecessary expenditures could reduce these energy costs by approximately $20 million a year.
2. Managing Energy at the College
Good energy management ensures that energy use and energy costs are kept as low as possible while standards of comfort and service are maintained or improved. All stakeholders in the college consume energy. Involving the whole college – the board of governors, senior managers, teaching staff, facility managers, support staff and students – will get maximum results. A combined approach generates commitment at all levels to reduce costs and pollution and enrich the curriculum. Energy cost savings also provide a source of funds for investment in further energy efficiency opportunities or in college programs.
2.1 An Energy Management Master Plan
An effective energy management program involves all areas of the college and requires the support of many people. It also requires someone, perhaps the facility manager, to coordinate the central activities, champion the cause and manage effective communications. Teaching and non-teaching staff should be involved. It is necessary to ensure their commitment to the program and organize their contribution to it. Students can participate through curriculum projects.
During the planning stages, it is necessary to set down preliminary goals, collect base data, design a tracking system, spot low-cost opportunities and plan project implementation before taking action and working on a longer-term plan. Remember to publicize and promote the program throughout the college. The OEE's workshop, Dollars to $ense: The Energy Master Plan, provides step-by-step instructions. Guidelines and templates are available from the OEE to help colleges complete energy management action plans to help focus activities and gain commitment. The OEE's Energy Innovator Officers are also available to help you develop your plans.
Getting started also means determining the college's current state of energy efficiency. The first step is to review your facility's current energy management program to determine how it is organized, what policies are in place, what information is collected regularly and who is responsible for it.
Here are some tips to start your program:
- Make sure energy data is collected regularly (weekly or monthly) to coincide with utility meter readings and/or fuel deliveries.
- Update records and profile the college energy performance over a 12-month period. Compare these figures with benchmark values.
- Check energy bills for the last year. Are the right rates being charged?
- Set up a winning team to oversee the campaign, encourage motivation and maintain progress. Choose members from all areas – teaching and non-teaching staff and student bodies.
- Start regular energy efficiency walkabouts.
- Establish energy efficiency measures, room by room; explain them to teaching and administrative staff and students.
- Update lists of items needing maintenance, servicing, repair or replacement. Set priorities for investment. When building retrofits are planned, energy saving measures can be added at a lower cost.
- Teaching staff and students should nominate energy monitors to switch off lights.
- Talk to teaching staff about the direct involvement of students through school projects. Keep people informed of progress through regular feedback.
- Set targets for energy cost and CO2 savings. Compare overall performance with sector best practice benchmarks.
- Initiate continuous staff training.
2.2 Energy Monitoring and Tracking
An effective monitoring and tracking system can help to:
- collect data from meters and fuel bills;
- provide an ongoing analysis of energy and water consumption;
- include observations from student surveys or walkabouts;
- help identify problems;
- analyse energy performance from indices; and
- set targets for the following year.
Outputs from the system can:
- provide evidence of success to encourage building users; and
- data for decision making and future planning within the college.
2.3 Energy Purchasing
The energy management team plays a key role in purchasing energy. As utility markets open up, opportunities are becoming available to obtain more competitive rates and alternative programs from a wider range of suppliers. Knowing where you stand through an effective monitoring and tracking system will help you negotiate the best deals. Plant usage, for example, can be timed to take advantage of time-of-day price options: timetables can be adjusted or plant start-up delayed to avoid expensive peak periods.
2.4 Equipment Purchasing
The team should also be involved in equipment purchasing decisions. Computer equipment should not be chosen solely on the basis of its IT performance. Look at the energy consumption data and choose the highest rated appliances. Consider the life-cycle costs, and not just the purchase price, when ordering refrigerators, TVs and VCRs.
2.5 Communication
Communication is important. Effective communication has two aims: to bring problems to the attention of senior management and find solutions, and to inform everyone at the college of the program's progress and success to reinforce motivation. Some useful ideas include:
- feedback through newsletter articles;
- posters and stickers;
- an energy notice board;
- suggestion schemes;
- student contests for innovative ideas; and
- student projects related to energy efficiency or climate change.
Remember that graphical presentations and pictures get the message across more easily.
The explosion in the number of personal computers in all areas of teaching and leisure is leading to spiralling growth in electricity consumption for many colleges. With plug-in equipment, controlling energy costs in low/medium power electricity circuits becomes almost impossible. A practical approach involves careful scheduling of usage and maintaining an effective purchasing policy. Match computer power to needs and select equipment with energy efficiency features. Energy costs can vary between $4.50 a year for a laptop unit to $185 a year for a high-end unit left running continually.
3. Energy Use in Colleges
Starting an energy efficiency program means first finding out where energy is being used and the potential problem areas. In colleges, energy is used to provide a comfortable and safe environment for educational, sporting and administrative activities. Heating, cooling and lighting are the main services, in addition to facilities such as catering, laboratory equipment and swimming pools. Depending on the college's location, the major use will be either heating or cooling in the form of air conditioning. Heating is generally by gas- or oil-fired boiler plant, with some electric heating where low-cost renewable electricity supplies are available, e.g. some areas of Quebec. Mechanical cooling is operated by electricity.
Fossil fuel for heating may be the largest element of the college's energy use and the largest on-site source of CO2 emissions. However, when primary energy use, including power station conversion, is calculated, air conditioning can produce the greatest amount of CO2. Cooling and lighting costs are often significant as well. Keeping track of both these services should be a major objective of any comprehensive energy monitoring and tracking program. In colleges with important specialized equipment and facilities such as swimming pools, the energy costs and consumption of these areas should be monitored and tracked separately to keep costs within budget.
3.1 The National Picture
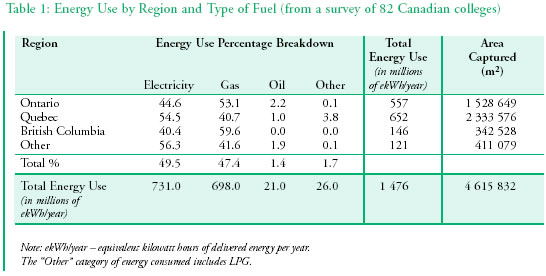
Energy consumption data from a survey of 82 Canadian colleges has been analysed to prepare this benchmark guide. The pattern of fuel use in each province for those colleges that submitted data is displayed in Table 1, below.
Assuming the sample colleges are representative of the 175 colleges in the whole sector, then the total national energy consumption of all of the colleges can be estimated at about 3 000 million ekWh/yr at a cost of $130 million per year.
Table 1: Energy Use by Region and Type of Fuel (from a survey of 82 Canadian colleges)
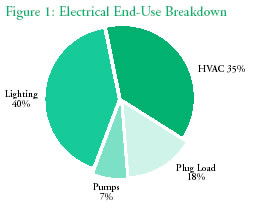
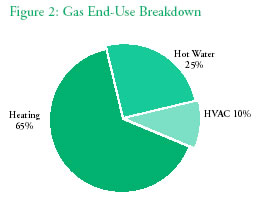
3.2 Typical Energy Use Breakdown
For individual colleges, energy use can be broken down between the various services. Figures 1 and 2 are sample breakdowns for electricity and gas usage for a typical Canadian college.
4. Benchmarking Energy Performance
Information provides the basis for monitoring and tracking energy usage. Regular collection of basic data can help evaluate both performance and potential savings. The data can be used to benchmark performance against similar colleges, locally and nationally, compare results from one year to the next and identify patterns or trends in fuel use.
Benchmarks provide representative data. A college can compare its annual energy use per square metre of floor area or cost per student with national figures and determine the possible benefits of reaching best practice status.
Performance can vary from the benchmark. Influencing factors include additional facilities, hours of use, the age of the buildings or simply overall size. Older buildings generally have lower thermal efficiency with less efficient heating and lighting systems; larger colleges may be more energy-efficient per student.
This guide includes a national overview and regional comparisons. Benchmark figures have been calculated for colleges in most regions of Canada, and data is provided to help colleges compare their performance to that of other similar facilities. Graphs and data prepared using the following procedures are included in Section 5, which shows the results of the first pilot national survey of benchmark performance.
4.1 Calculating National and Regional Benchmarks
Calculating your college's energy benchmark involves collecting data on the physical characteristics of the facility, occupancy patterns, annual energy use and climatic variations. A similar procedure is followed to compare performance against national or regional benchmarks.
4.1.1 Overall Benchmark Performance
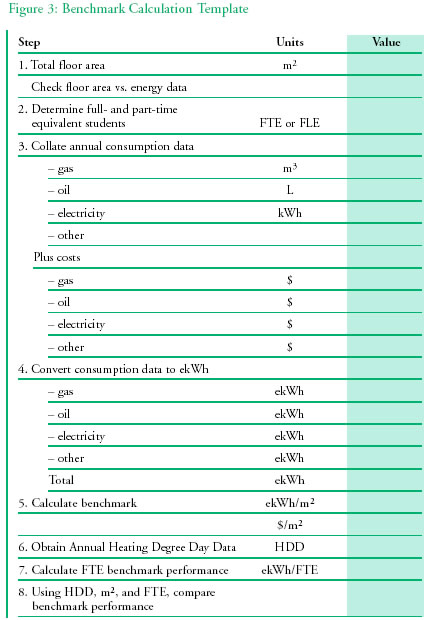
To calculate your college's benchmark and compare it with the data in this guide, follow these steps:
-
Collect information on the total floor area(s) in square metres that are serviced, i.e. heated and/or cooled.
-
Check that the area data corresponds with the building areas for which energy consumptionfigures are available from meter readings and/or utility bills.
-
Collate meter readings or utility bills to determine the annual costs and consumption of fossil fuels and electricity.
-
Convert consumption data to common energy units – equivalent kilowatt hours (ekWh) – and determine the total consumption.
-
Calculate overall benchmark performance in ekWh/m2and $/m2 and compare the results with the national and regional benchmark data in tables and graphs in this guide.
This provides overall benchmark performance. A template to help users calculate their benchmarks is provided (Figure 3).
4.1.2 Accounting for Impact Variables
Performance also varies with location, climate, occupancy levels and other factors.
Location – in this guide, benchmark data has been expressed by region.
Climate – heating and cooling degree days are published for each location. Monthly degree-day figures for different locations are available from Environment Canada. These reflect the total number of equivalent days in a given period for which heating and/or cooling are necessary to achieve standard indoor conditions at the specified location. They provide a basis for comparing different climatic regions in terms of energy use per heating/cooling degree-day. Contact information for Environment Canada is given in Section 7.
-
Collate Annual Heating Degree Day (HDD) data for your locality.
Occupancy – Benchmark data is also available on the number of full and part-time student equivalents (FTE/FLE).
-
Calculate overall benchmark performance in ekWh/FTE and compare the result with the national and regional benchmarks.
-
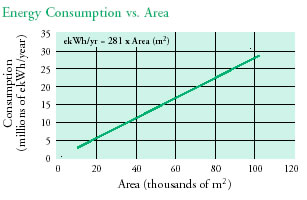
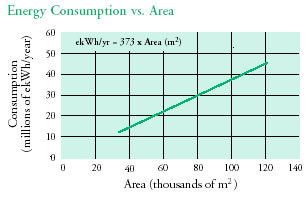
Using the HDD and ekWh/FTE data, compare with similar colleges using Figures 4, 5 and 6 (see page 11).
4.2 Comparison with the Model National Energy Code for Buildings
The OEE uses the Model National Energy Code for Buildings (MNECB) as the basis for comparison under the Commercial Building Incentive Program (CBIP). It establishes minimum standards for building components and features that affect building energy efficiency. One of the main CBIP requirements is that a building's energy use must be at least 25 percent lower than that of a similar structure built to meet the requirements of the MNECB. The MNECB helps designers introduce energy-efficient buildings that minimize air-conditioning and heating bills. The MNECB considers climate, fuel types and costs and regional construction costs to calculate minimum standards. The standards address thermal resistance, lighting efficiency, heating, ventilating and air conditioning, service water usage and general electrical consumption. Energy-using plants and equipment in colleges will generally be designed in accordance with American Society of Heating, Refrigeration, and Air Conditioning Engineers (ASHRAE) standards of performance. Facility managers can refer to ASHRAE codes for further advice on energy performance and the design of improvement measures.
4.3 Calculating Greenhouse Gas Emissions
The college sector is actively participating in the national challenge to reduce CO 2 emissions and individual institutions are registering with Canada's Climate Change Voluntary Challenge and Registry Inc. (VCR Inc.). Participation in the national challenge can have strong motivational and educational benefits. Colleges wishing to demonstrate commitment to the national targets can convert their benchmark data into equivalent CO2 emissions using the appropriate con- version factors to compare it to the national figures.
Standard conversion factors are available from fuel suppliers or other reference sources including VCR Inc.'s Registration Guide 1999. Electric utilities burning a mix of fossil fuels generally provide annual conversion factors for the particular fuel mix used in their generated electricity. College performance can be measured as CO2 emissions through a monitoring and tracking system using standard conversion factors for fossil fuels and an annual correction factor for electricity. To calculate greenhouse gas emissions, use the following:
Fossil Fuels: e CO2 = CO2 + CH2 + N2O
Where,
CO2 = Gas Consumption x EF
CH4 = Gas Consumption x EF for
CH4 X GWP for CH4N2O = Gas Consumption X EF for
N2OX GWP for N2O
Electricity (Indirect Emissions): CO2 = Electricity Consumption x EF for Province
Emissions Factor (EF): the emissions in kilograms per unit volume of fuel used.
Global Warming Potential (GWP): the relative global warming potential of different greenhouse gases
(compared to CO2). GWP values are available from
VCR Inc. For contact information, see Section 7.
Teaching staff and students can be encouraged to calculate their overall college performance and the individual contributions of their respective teaching groups or faculties. This can help identify energy inefficiencies and savings opportunities.
Since 1990, energy management strategies at Humber College have saved $2,861,000 and prevented the emission of a total of 8 200 tonnes of greenhouse gases.
5. The Benchmark Results
In this pilot performance benchmarking program, data from 82 colleges have been analysed to determine national and regional patterns. The results of graphical analysis of energy use and cost related to student numbers and floor area are shown below under the national picture and the regional analysis sections. The basic data in this guide is presented on a non-attributable basis, which is normal for such an exercise.
NB: The following analysis is based on a limited sample of data from colleges that responded to a questionnaire conducted by the OEE. In some cases, the data was incomplete and/or only historic information was available. There was also a significant discrepancy between regions on the level of coverage. Colleges should use the data as a starting point to assess the potential for avoided costs. The results should be regarded as a preliminary view of benchmark performance for the Canadian college sector. An indication of savings may stimulate further detailed analysis on-site. Standards will steadily improve as further measures are implemented. The level of good-and best-practice performance should be improved in subsequent surveys.
5.1 General Comparison of Energy Performance
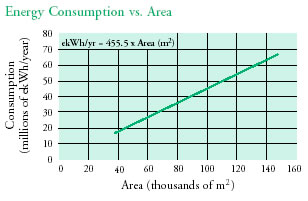
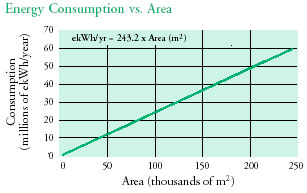
Data from the same 82 colleges has been analysed to determine benchmark performance for the sector. The analysis looked at the overall national picture and individual regions. This guide includes graphs of energy consumption (in ekWh) and cost vs. floor area and equivalent full-time student numbers (FTE). Regression trend lines have been drawn to show the average performance for each group of data with its respective trend line formulas.
Colleges can use this benchmark data to determine how their energy performance compares. Colleges with energy performance at or below the average may be showing good practice, while those with performance 25 percent or more below average could fall into the best practice category. By using the trend line formulas, colleges can calculate the average performance for their particular facility or student numbers and then compare this figure with their current usage. The difference between a college's performance and the good or best practice performance levels provides a global indication of its potential savings.
- When comparing your full and part-time student (FTE/FLE) performance with that of colleges in other provinces, note that the FTE/FLE may be calculated differently in each province.
- Unit cost of energy can vary college to college and region to region; this should be taken into consideration when comparing cost performances.
Regional differences have a significant bearing on potential savings. Colleges can also compare performance with similar colleges on a regional basis; graphs showing regional performance are included. To provide for other impact variables a table of benchmark data has been compiled (Section 5.3) showing maximum, minimum and average performance in ekWh/FTE for colleges with different floor areas and levels of HDDs.
Section 5.1.3 contains an example of a step-by-step process for performance comparison.
5.1.1 National Picture
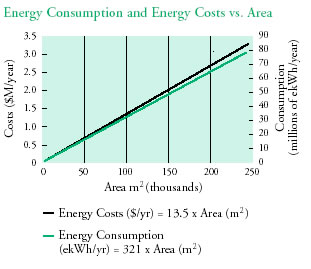
The national results in the graphs below indicate good correlation between energy consumption and cost versus area (m2), particularly with colleges of less than 100 000 m2. With respect to full-time equivalent (FTE) student numbers, the graphs and equations of the best fit line also showed good correlation for the smaller colleges, but, as the size of the facility increases, the points become more scattered. For colleges with student populations over 10 000, the results are more widespread. However, the correlation throughout the range improves for energy cost, indicating that colleges may be exercising more effective cost control. The wider variations at the larger institutions may indicate more variation in facilities and in their utilization.
The data provides useful pointers for small to medium-size colleges to consider when assessing their performance against the national good- and best-practice categories. The current data is less conclusive for larger colleges and individual colleges may need to look at their energy consumption data. Larger colleges may include separate campuses or groups of buildings that are individually metered. These could be regarded as separate small colleges for comparison against the benchmark data. The national average consumption and cost are 321 ekWh/m2 and $13.50/m2.
Equations of Best Fit Line
A statistical technique (regression analysis) can be used to express the relationship between two variables in the form of the equation of a straight line (i.e., Y=mX + b). The relationship between consumption and cost versus area or students can be represented by the equations of the best fit line. Based on this national analysis, the equations of the best fit line are included in the graphs.
5.1.2 Regional Analysis
Similar graphs have been prepared for Quebec, Ontario, British Columbia and the Prairie and Atlantic provinces (Other Regions). As the regional analyses for BC and Other Regions are based on samples of five and seven colleges respectively, it is difficult to draw clear conclusions for these regions.
The data for Quebec and Ontario generally show a positive correlation between energy use and cost-vs.-student numbers and area. The Ontario data demonstrates a large range of college sizes and populations. There is more divergence when considering costs for the two regions. The largest college surveyed in Ontario has annual energy costs of $17.5/m2, whereas, in Quebec, the equivalent costs are $10/m2, reflecting lower unit charges or higher efficiency. This is reversed for costs per student, with Ontario having a maximum of $110/FTE and Quebec $175/FTE. This suggests more intensive use of facilities in Ontario.
Quebec Colleges
Ontario Colleges
British Columbia Colleges
Other Regions
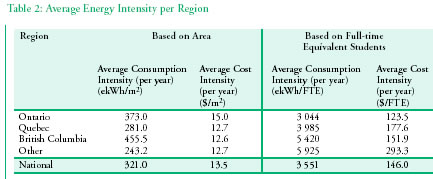
Equations of Best Fit Line and Average Intensities for Regional Graphs
As previously discussed, the relationship between the variables can be represented by the equation of the best fit line. Based on this regional analysis, the equations of the best fit lines for the various regions are provided in the graphs. In addition, the average energy consumption and cost intensities are provided in the following table (see Table 2).
5.1.3 Step-by-Step Process for Performance Comparison
“College A” has the following characteristics.
- Location: Ontario
- Area: 50 000 m2
- FTE: 4 800
-
Total Energy Consumption:
16 200 000 kWh per year - Total Energy Cost: $500,000 per year
“College A” Energy Intensities
Consumption intensities (per year)
- ekWh/m2 = 16 200 000/50 000 = 324 ekWh/m2
-
ekWh/FTE = 16 200 000/4 800 =
3 375 ekWh/FTE
Cost intensities (per year)
- $/m2 = 500 000/50 000 = $10/m2
- $/FTE = 500 000/4 800 = $104/FTE
Comparison with National Averages
For the above characteristics, the average intensities, using the National Picture Graphs and/or average energy intensities (Table 2), are as follows:
National average consumption intensities (per year)
- ekWh/m2 = 321 ekWh/m2
- ekWh/FTE = 3 551 ekWh/FTE
National average cost intensities (per year)
- $/m2= $13.50/m2
- $/FTE = $146/FTE
Based on the national picture, “College A's” energy consumption is within the average range. However, “College A's” energy bill is about 26 percent lower than average. This may suggest that the unit price for energy may be lower in the region where “College A” is located.
Comparison with Regional Averages
Using the Regional Picture Graphs and/or Table 2, the average intensities for Ontario are as follows:
Average consumption intensities (per year) for Ontario
- ekWh/m2 = 373 ekWh/m2
- ekWh/FTE = 3 044 ekWh/FTE
Average cost intensities (per year) for Ontario
- $/m2= $15/m2
- $/FTE = $123.5/FTE
Based on the Ontario regional analysis, “College A's” energy consumption and cost are below the average range. However, in terms of students, “College A's” energy consumption is about 11 percent higher than average. The college may, for example, offer long-distance learning courses that serve a great number of students but are located off-site.
5.2 Comparison with Similar Colleges
To help colleges compare their performance with others with similar characteristics, the analysis also considered the effects of other variables, including climate, facilities and number and age of buildings to determine which had a significant influence on energy use.
NB: A complete analysis was not possible with the limited data available on some of the variables, and the following conclusions should be regarded only as illustrative.
Data was analysed using statistical information that is readily available to college management and that affects energy performance – floor area, student numbers and HDDs for the location. Figures 4, 5 and 6 have been compiled from this analysis.
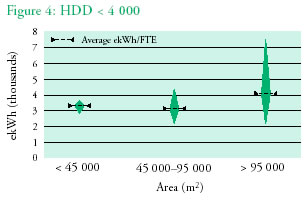
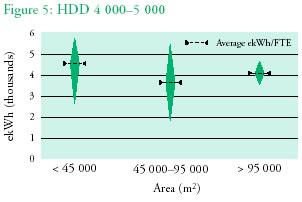
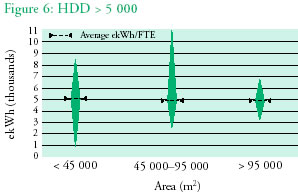
Analysis
The data generally indicate a rising trend with increasing HDDs and college area. However, the increase is not marked despite significant changes in climatic conditions between locations. It appears that colleges in colder areas, where more heating is required, are likely to have buildings better designed for thermal insulation and have more efficient, better controlled heating systems.
Further analysis showed that the level of Cooling Degree Days (CDDs) for the location appeared to influence energy use. In areas where average annual summer temperatures require limited cooling, this may be met by allowing natural ventilation i.e., opening windows). However, as the number of days requiring cooling increases, the college may become more dependent upon the use of air conditioning systems, which have a significant energy burden.
The effect of numbers of buildings and building age was less conclusive. Colleges with predominately smaller buildings appeared to use less energy than those with fewer but larger buildings. Many colleges utilized a mixture of buildings of different ages. Without energy use data related to individual buildings, the effect of building age could not be determined.
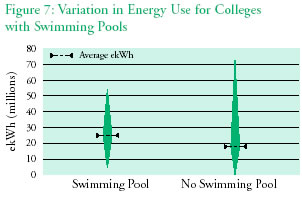
Finally, the effect of particular energy-consuming facilities was studied. Colleges with swimming pools showed an increase in average energy consumption compared to those without, as seen in the graph below. However, the maximum consumption for the non-pool colleges was significantly higher, possibly due to older sites without pools having less efficient buildings.
5.3 Comparison with Commercial Building Incentive Program Requirements
Colleges can use the CBIP requirements to benchmark their existing energy performance against reference examples for their region. As mentioned before, one of the main CBIP requirements is that a building's energy use must be at least 25 percent lower than that of a similar structure built to meet the requirements of the MNECB. This should provide an overall level of savings potential. For more information on the procedures for benchmarking against CBIP requirements, see the contact details in Section 7.
6. Improving Energy Efficiency
Benchmarking of performance will indicate what energy costs could be avoided by bringing energy management up to the good practice level. An energy improvement program may be needed in addition to monitoring and tracking and good housekeeping. The savings in energy avoidance and investment cost will vary for each type of measure and its application, as will the individual payback. Simple low-cost, short-payback measures quickly generate funds for further improvements and promote confidence in investing in larger projects.
6.1 Best Practice
In any benchmark comparison, colleges with energy consumption at or near the minimum could be considered to be applying current best practice. However, standards are continually improving and future benchmarks should be lower. CBIP proposes that a best practice building must meet its mandatory program requirements. ASHRAE standards also provide guidance in assessing energy performance.
Saving fossil fuel use and reducing CO2 emissions by implementing renewable energy projects is another route to best practice energy performance. Colleges could consider biomass heating, wind generation and passive solar design, photovoltaic generation or solar water heating (See Section 6.5.1).
6.2 Good Practice
Colleges are actively participating in the OEE-sponsored Energy Innovators Initiative (EII) and are submitting energy action plans for registration with Canada's Climate Change VCR Inc. Action plans submitted to EII and VCR Inc., which include details of existing measures and future plans, can be found on the VCR Inc.'s Web site at http://www.vcr-mvr.ca/.
Examples of colleges achieving excellent results:
Cégep de Saint-Jérôme reduced its energy use by 25 percent between 1994-95 and 1998-99. Measures included an effective energy management/ monitoring campaign and the installation of controls with payback periods of four years. There were similar reductions in energy use per full-time student. The college plans a further 6 percent reduction by 2004-05.
At Durham College Oshawa Campus, baseload electricity consumption dropped from 600 000 kWh per month in 1989 to 400 000 kWh per month in 1997. Peak demand also fell from 1 600 kW to 1 000 kW. These savings were achieved despite an increase in enrolment from 11 500 full- and part-time students in 1987 to 46 000 in 1997 and the expansion of the campus area from 38 100 m2 (410 000 sq. ft.) to 45 060 m2 (485 000 sq. ft.).
6.3 Seasonal Tips to Achieve Good or Best Practice
To achieve and maintain good or best practice, colleges must implement an effective energy management program as well as specific improvement projects. In addition to establishing the master plan discussed in Section 2.1, good housekeeping measures should be maintained. Here are some seasonal tips to help colleges plan their campaigns throughout the year:
Spring
- Adjust heating systems to ensure that overheating does not occur and that comfort levels are not affected.
- Check that the warm-up period of your building is shorter than in winter.
- Check that the heating is turned off earlier in the day.
- Re-set time switches (where daylight saving time is in effect).
- Ensure chillers are serviced and pumps checked.
- Check that the other air-conditioning plant is in working order and that controls are correctly set.
Summer
- Check that room temperatures are at the maximum for comfort at the correct cooling provided.
- When premises are closed, ensure all non-essential heating, ventilation, air conditioning and lighting systems are switched off. This can be checked by reading meters during empty periods.
- Check that buildings are at the correct temperature during periods of occupancy.
- Avoid cooling the whole building for security staff only.
- Plan ahead for energy-efficient operation prior to the heating season.
- Ensure boilers are serviced and pumps checked.
- Clean fan convector filters.
Check:
- the external envelope of the building to identify damage that could result in heat loss/gain.
- that the recommended thickness of ceiling insulation is in place.
- all external doors to ensure they fit and close properly, and that door closers are effective.
- that effective weatherstripping is installed around external doors and windows.
- that windows fit and close properly and that any damaged handles and catches are repaired.
Autumn
- Check timers; reset at the end of daylight saving time.
- Turn on the heating only when it is required to keep the building warm.
- Isolate the air-conditioning plant to avoid any simultaneous heating and cooling operation.
- With heat on, check that room temperatures are at the minimum for comfort with no overheating.
- Check that buildings are at the correct temperature during occupancy.
- Avoid full building heating for security staff only.
Winter
- Ensure that buildings are correctly heated and lit only when required, especially during weekends and holidays. This can be checked by reading meters during periods when the buildings are empty.
- Ensure proper control of supplementary portable heaters.
- Label light switches to ensure that only necessary lights are turned on.
- Ensure that security lighting comes on only at dark.
- Ensure that controls permit different weekend settings.
- Check that minimum essential services operate correctly during holidays.
- Ensure that heating system controls respond to changes in weather.
- Ensure that cleaning staff use only the lighting required to work effectively and permit safe movement between work areas.
NB:
- When adjusting temperatures and lighting levels in teaching and working areas, make certain that health and safety requirements are fully met.
- ASHRAE standards also provide guidance on comfortable seasonal temperatures.
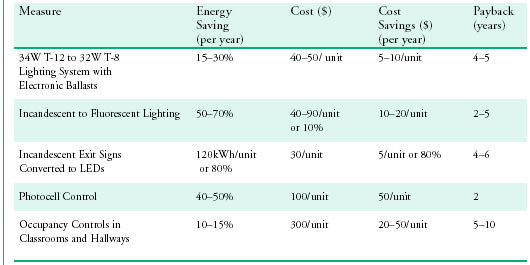
6.4 Energy Efficiency Measures
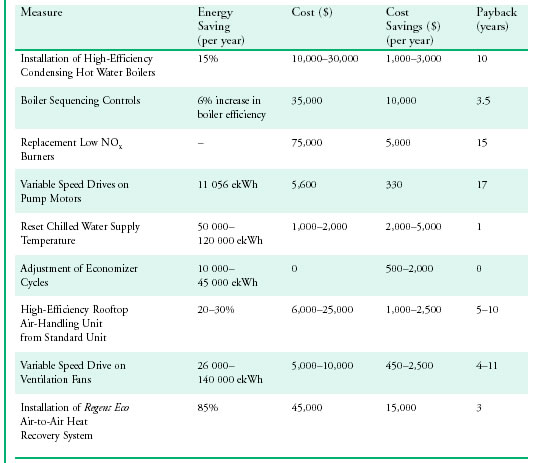
Energy is used to provide a safe and comfortable working environment through heating, cooling, lighting, domestic water and plug loads. Improving energy efficiency involves improving energy conversion and providing effective control of building services. Costs, savings and payback periods are given below for a range of possible improvement measures.
NB: The cost, savings and payback figures quoted are TYPICAL values calculated from completed projects and college energy management action plans. These values can vary significantly depending on existing conditions and the specifics of the measures, and are given as examples only.
In some cases, the savings are provided in terms of percentages because of the difficulty in determining the corresponding range of values.
HVAC Systems
Heating
Heating is generally provided by gas- or oil-fired steam or hot water boilers supplying primary and secondary heating systems through radiators, convector heaters or other heating outlets. Alternative fuels, e.g. coal or propane, are also in use. Direct-fired radiant and convective heating appliances are used in some buildings, such as workshops or sports halls. Electric heating has been installed where low-cost renewable electricity supplies are available. Improvement can be achieved through boiler efficiency, burner controls and pump/fan efficiency in addition to room temperature control. Some col-leges are implementing low-NOx burners to reduce emissions.
Colleges are installing cogeneration systems as an alternative to conventional heating boilers.
In 1998, Southern Alberta Institute of Technology (SAIT) signed a landmark agreement with Applied Global Co-generation to install a mobile 3.5 MW gas turbine unit at the campus. SAIT already operates a 600 kW steam turbine generator set and a 500 kW natural gas engine unit. The combined system produces 27 000 MWh of electricity and 210 X 106pounds of steam and reduces purchased electricity by 60 percent and CO2 emissions by 27 500 tonnes each year. Annual cost savings for the 3.5 MW unit are expected to reach $100,000.
Ventilation and Air Conditioning
Mechanically driven ventilation and air conditioning systems are installed to provide a safe and comfortable environment in areas where natural ventilation is unable to provide sufficient air flow or space cooling. Ventilation systems range from centrally installed air-handling units to locally mounted supply or exhaust fans. Air conditioning comes in two principal forms: centrally installed refrigeration chillers supplying chilled water to local cooling outlets and locally mounted direct expansion package units.
Proven efficiency improvements include more accurate controls covering space and system temperatures and sequence control of chillers. Closer temperature control and variable air volume, related to occupancy, are also available with variable speed drives on chilled water pumps and large fan motors. When replacing chillers with CFC as the refrigerant, colleges can consider opportunities for efficiency improvements. Cooling towers should be selected in conjunction with the refrigeration unit that produces the lowest kilowatt per tonne of refrigeration ratio.
Lighting
Upgrades to improve lamp efficiency can include the replacement of incandescent lighting with compact fluorescent units and older fluorescent lighting with low wattage fluorescent units fitted with electronic ballasts. Incandescent lights should be replaced with compact fluorescent lamps, which provide the same light output but use 50-70 percent less energy and last up to 10 times longer. Lighting systems consisting of 34W T-12 tubes and magnetic ballasts can be retrofitted to 32W T-8 tubes and electronic ballasts to produce energy savings of 15-30 percent due to the change in technology alone, in addition to providing other benefits. T-8 fluorescent lamps utilize a rare-earth tri-phosphor coating that produces consistent, high quality light with a high colour rendering index (CRI). The CRI index uses incandescent light as reference of 100. T-8 lamps emit light with a CRI of 85, compared to about 60 for most T-12 lamps. The result is a higher quality light, better colour rendition and light that contains more of the full spectrum of colours. The average life of T-8 lamps, electronic ballasts and LED units are 20 000 hours, 50 000 hours, and 25 years, respectively.
In addition, the use of electronic ballasts, which operate at a much higher frequency, will eliminate the flicker and the audible hum of magnetic ballasts, which operate at 60 Hz and cause headaches in some people exposed to fluorescent light. The higher frequency also eliminates interference between the lighting and video display terminals, which operate in the 60-75 Hz range.
Additional savings can be achieved by installing occupancy sensors and automated lighting controls, connected to the central building management system, that ensure that lighting is on only when and where required and is off when the room is unoccupied. Daylight harvesting can be used in rooms that have sufficient window or skylight areas, the correct exposure, and where the existing wiring can be easily modified. In areas under consideration, the switches can be replaced with a combination of light level sensor, occupancy sensor and on-off switch. This will automatically turn off lights when the available light reaches a set level, or if no motion is detected after a set time. The threshold lighting level and the occupancy sensor delay are fully adjustable to suit the requirements of the room occupants. The end result is true energy savings at a relatively low initial cost. High-pressure sodium lamps with maximum lamp efficiency should be installed in interior locations where accurate colour rendering is not essential. Exterior and security lighting can also be converted to high-pressure sodium and exit signs to light emitting diodes (LEDs). Lighting controls principally include the installation of photoelectric sensors on perimeter lighting and occupancy controls on room and corridor lighting.
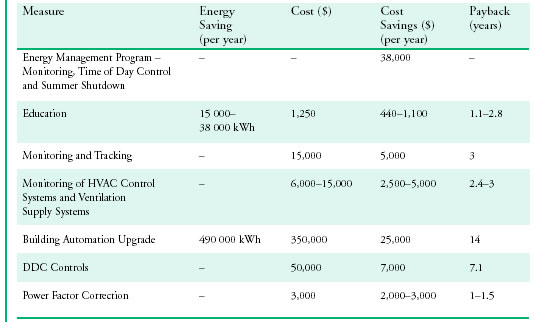
Energy Management and Controls
Energy management measures being adopted by colleges include monitoring and tracking (M&T), metering and education. M&T can include the overall examination of site services and/or detailed monitoring of key systems. Colleges are also implementing a variety of energy management controls ranging from full building automation systems to direct digital control of individual HVAC systems and individual room controls. Power factor correction is also being introduced to produce savings through alternative rate agreements.
For computer monitors consuming between 80 to 100 watts, it may possible to achieve an annual energy saving of $67 by installing a PowerSaver ENERGY STAR compliant device. At a cost of $40 per device, the payback period is eight months. (Caddet Technical Brochure: Result 357)
Building Envelope Measures
Some colleges are also introducing building envelope improvements. Vision wall glazing can be added to the building exteriors to maintain a minimum airflow rate of 0.65 CFM/sq. ft. Other initiatives include replacing single-glazed windows with low-impact, high-performance glazing systems, installing exterior light shelves to use daylight more effectively, upgrading insulation and weatherproofing.
Between 1992 and 1997 Malaspina University-College saved $161,500 by implementing building envelope and orientation measures in five buildings. Projects included standard double glazing and vision walls in conjunction with light shelves and external sun screens. Projected total savings by 2002 are over $1 million.
6.5 Investing in Energy Efficiency
Major projects need careful evaluation and planning. The Energy Innovators Initiative can help set up a structured investment program to get the best return from a package of measures. Colleges implementing energy efficiency projects can save 25 percent or more of their energy costs while taking advantage of utility support programs and energy service company (ESCo) financing to introduce further measures. During the contract period the no/low payback projects help finance the long-term measures.
Since 1991 the University College of the Fraser Valley has invested $250,000 in a comprehensive energy improvement program. By 1998, cumulative savings had reached $200,000. Plans are underway to invest a further $500,000 for a 17 percent improvement over a six-year payback period. Measures include lighting upgrades, variable speed drives on fan motors, updated controls, boiler improvements, metering and education.
The OEE workshops, Dollars-to-$ense, help users spot low-cost energy-saving opportunities. Here are some typical proven measures with an indication of the likely payback period.
No/Low Cost (Payback Under 2 Years)
- Recommission optimizer and heating/ air conditioning controls.
- Check that boiler air/fuel ratio is correct (as part of regular maintenance).
- Repair leaks in distribution mains.
- Install, repair or replace thermostats.
- Provide improved controls for stand-alone heaters/packaged air-conditioning units.
- Install photoelectric controls on exterior and corridor lighting.
- Install occupancy controls in teaching rooms.
Success with these basic measures should provide the confidence to undertake more ambitious projects. Here are some medium to long-term investments:
Medium Cost (2- to 5-Year Payback)
- Update boiler controls, including flue gas monitoring and burner control.
- Improve or repair thermal insulation on boilers and pipes.
- Install optimum start and externally compensated control of heating.
- Install or upgrade building automation system.
- Install dual fuel burners on boilers (depending on supplies).
- Add vent dampers to boilers.
- Install timers on hot water immersion heaters.
- Replace central hot water production with point-of-use devices.
- Install thermostatic radiator valves; install timers on fan convectors.
- Replace incandescent lighting with compact fluorescent lamps.
- Retrofit existing lighting with T-8 lighting.
- Install energy metering and monitoring systems.
High Cost (5- to 10-Year Payback)
- Revise and improve zoning of the heating/ cooling systems.
- Install new condensing boiler.
- Improve controls on storage radiators.
- Add self-closing devices to external doors.
- Install weatherstripping around external doors and windows.
- Insulate ceilings to current standards.
- Install cavity wall insulation.
- Build vestibule at the main entrance.
- Install new chiller plant with non ozone-depleting refrigerants.
6.5.1 Renewable Energy Sources
Investment in renewable energy sources (RES) can
also result in significant reductions in CO2 emissions.
At present most RES technologies will fall into the high-cost category, but colleges may wish to consider the following:>
- Biomass Heating: using available biomass sources, e.g. forest residue, energy crops, waste combustion or landfill gas, as a fuel source for heating boilers and/or a combined heat and power plant.
- Wind Generation: produced by site-mounted wind turbines or purchased from an adjacent wind farm.
- Passive Solar Design: designing buildings to optimize the available solar energy for heating and improving daylight provision in winter and mid-seasons and reduce excess solar gain in summer.
- Active Solar Energy: incorporating solar thermal water heating panels and/or photovoltaic (PV) modules into the envelope design as appropriate. PV panels can be integrated into the building façade.
- Ground Source Heat Pumps: using available energy from geothermal ground sources as the input energy to a heat pump system.
7. Information and References
Additional advice and information are available from these sources:
Office of Energy Efficiency Publications and References:
Dollars-to-$ense Workshops: The Energy Master Plan, Energy Monitoring and Tracking and Spot the Energy Savings Opportunities
College Sector Energy Management Action Plan Template and Guidelines
Energy Management Series (numerous technical documents ranging from auditing, boilers, energy accounting, compressors, lighting etc.)
Commercial Building Incentive Program (CBIP) and the Commercial Building Incentive Program Technical Guidelines, produced in conjunction with the MNECB, are available on the CBIP Web site at: http:/CBIP.nrcan.gc.ca.
Renewable Energy Deployment Initiative (REDI) at: http://www.nrcan.gc.ca/es/erb/reed.
These resources and other publications are available through the OEE's Energy Innovators Initiative. Please phone 613-995-6590 or fax 613-947-4121.
External Publications and Resources
The Model National Energy Code for Buildings (MNECB,) and “Performance Compliance for Buildings” are available from the Institute for Research in Construction at the National Research Council of Canada.
Tel.: 1-800-672-7990 or 613-993-2463 (National Capital Region)
Fax: 613-952-7673Association of Canadian Community Colleges (ACCC)
Ann Dale, Director Energy Efficiency Program
Tel.: 613-746-6089
Fax: 613-746-6721
E-mail: adale@accc.ca
Web site: http://www.accc.ca/english/services/renewable_energy.htmAgence de L'Efficacité Énergétique
Monsieur Luc Lamontagne, Analyste
Tel.: 418-627-6739 ext. 8032
Fax 418-643-5828
E-mail: luc.lamontagne@aee.gouv.qc.caOntario College Physical Resources Directory Association
Frank Dalley, Physical Resources Officer
Tel.: 705-749-5508
Fax 705-749-5540
E-mail: fdalley@flemingc.on.caCanada’s Climate Change Voluntary
Challenge and Registry Inc. (VCR Inc.)
Tel.: 613-565-5151
Fax 613-565-5743
Web site: http://www.vcr-mvr.ca/Écogeste
Roberte Robert, ing.
Directrice du Programme Écogeste
Bureau d’enregistrement des mesures volontaires sur les changements climatiques
Tel.: 418-521-3950 ext. 4907
Fax 418-646-4320
E-mail: ecogeste@mef.gouv.qc.ca
International Sources of Reference
Centre for the Analysis and Dissemination of Demonstrated Energy Technologies – CADDET
Michel Lamanque
CADDET Technology Coordinator
Natural Resources Canada
580 Booth Street, 13th Floor
Ottawa ON K1A OE4
Tel.: 613-947-3812
Fax 613-996-9418
E-mail: mlamanqu@NRCan.gc.caETSU, AEA Technology Plc., Harwell, UK
Tel.: +44-1235-436747
Fax +44-1235-433066
E-mail: etsuenq@aeat.co.uk
Web site: http://www.energy-efficiency.gov.ukBRECSU, BRE, Watford, UK
Tel.: +44-1923-664258
Fax +44-1923-664787
E-mail: brecusenq@bre.co.uk
Web site: http://www.energy-efficiency.gov.uk
You can find other buildings publications from the Office of Energy Efficiency. To order paper copies, or to discuss how we can help you make your property more energy efficient, please contact us.
Office of Energy Efficiency
Natural Resources Canada
580 Booth Street, 18th floor
Ottawa ON K1A 0E4
Tel.: 877-360-5500 (toll free)
Fax: 613-947-4121
Web site
Page details
- Date modified: