
A Changing Québec
With or without climate change, Quebec has never ceased changing over time. Its population, natural and built environment, and socioeconomic activity have transformed over recent centuries, and more particularly in recent decades. Since the nature and magnitude of climate change impacts will depend as much on features of these three key elements, as on climate change itself, it is important to summarize these characteristics, as well as those linked to climate. Before dealing with specific and regional issues related to the impacts of climate change, this section presents the broad features and likely picture of changes in Quebec for the coming decades.
2.1. POPULATION
With a population of 7.5 million (2005), Quebec is the second most populous province in Canada. A large part of its population (82%) is concentrated in the south and along the St. Lawrence River, while the remainder is scattered in other regions where the economy relies more heavily on natural resource development. Quebec is urbanized, with 75% of its population living in 73 cities of more than 10 000 inhabitants - including 54% in the nine cities with more than 100 000 inhabitants, namely Montréal, Québec, Lévis, Gatineau, Sherbrooke, Laval, Longueuil, Saguenay and Trois-Rivières - and its economy is diversified. The rural area (80% of inhabited territory) represents 1.6 million people (22% of the population) living in nearly 1000 villages. Finally, the total Aboriginal population of close to 83 000 consists of 73 000 First Nations people and 10 000 Inuit (Secrétariat aux affaires autochtones, 2006).
In the coming decades, Quebec's population will stabilize in numbers of inhabitants and will show changes in regional composition and age groups. According to the Institut de la statistique du Québec (ISQ), the population will increase to nearly 8 million in 2026 and 7.8 million in 2051 depending on the reference scenario (see Figure 2; Institut de la statistique du Québec, 2003). The uncertainty of this forecast is related mainly to assumptions regarding trends in net immigration and fertility that frame the weak and strong scenarios of the ISQ.
Moreover, 12 of Quebec's 17 administrative regions would experience a population decline by 2026. This decline would be even more pronounced in the long term, ranging from -16% to -32%. At the same time, the population of the Montréal region would increase by nearly 450 000 persons (+13%), who will settle primarily in the north and south belts, thus contributing to the trend towards urban sprawl. The Outaouais region would also experience strong growth, with an increase of 13% by 2041. Nunavik would see its population (10 000 in 2001) increase by 28% (13 000) by 2021, mostly due to special features inherent to this area (see Section 3.1). The current population is young (in 2004, 56% were under 25 years old) and lives in 14 villages located along the coasts of Hudson Bay, Hudson Strait and Ungava Bay (Institut de la statistique du Québec, 2004). Its growth is already creating strong demand for housing (see Section 3.1).
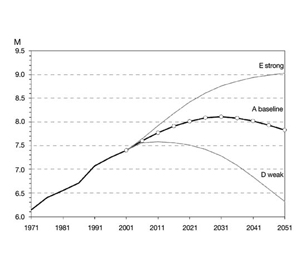
FIGURE 2: Scenarios for total population change in Quebec until 2051 (Institut de la statistique du Québec, 2003).
Text version
A line graph showing three scenarios for total population change in Quebec until 2051. The first line estimates a steady increase from the current population to 9 million in 2051, the second, an increase to 8.3 million in 2031, decreasing to 7.8 million by 2051 and the third, a peak in 2012 at 7.5 million, dropping to 6.3 by 2051.”
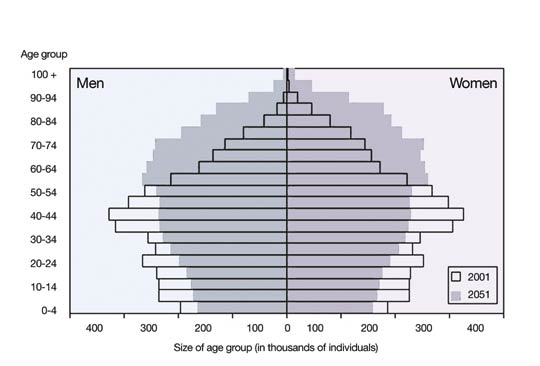
Given these projections, variations in population by age group will be even more pronounced than expected variations in total population in the regions (Figure 3). In fact, because of the ratio between the number of persons older than 65 and those who are younger, demography in Quebec will be completely transformed. In 2051, the number of persons aged 65 and over will exceed 2 million and, in 2026, their demographic weight may exceed 20% in all regions except northern Quebec. In 1996, the Mauricie region, with the greatest number of elderly, had fewer than 15% of persons aged 65 and more. By 2026, only one crescent-shaped area centred on the Montréal region (from the Outaouais to central Quebec) would be showing significant demographic change. As a result, a growing proportion of the population will swell those age brackets often associated with groups currently vulnerable to climate change. These changes will have impacts on the vulnerability of Quebec society, particularly on the financial resources available for health services, which are increasingly in demand (Godbout et al., 2007).
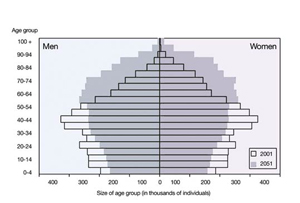
FIGURE 3: Age pyramid of the Quebec population, 2001 to 2051, reference scenario A (Institut de la statistique du Québec, 2003).
Text version
A population pyramid of the Quebec population (males and females) for 2001 and 2051. The Figure shows that by 2051 there will be a demographic shift, so that the highest number of males and females will be between 60 and 80 years old, compared to the 2001 distribution, where the highest number of males and females are between 40 and 54 years old.
The state of health of the Quebec population is changing positively and is well documented for the different administrative regions of the province (Institut national de santé publique du Québec, 2006). Although most socioeconomic and health indicators show a gradual and steady improvement in health, an earlier report identified certain behaviour, perceptions and indicators conducive to a potential increase in vulnerable populations (sedentary behaviour, excess weight, elderly persons living alone; Institut national de santé publique du Québec, 2006). Since then, these trends have not generally been confirmed except in the case of already vulnerable populations, which have seen their vulnerability increase.
Given the slow rate of change in the demographic trends, projections show an aging population, slower growth of urban populations and depopulation of remote regions. Consequently, demographic changes and the state of health will contribute equally to increasing or decreasing the vulnerability of populations to climate change.
2.2. SOCIOECONOMIC ACTIVITY
2.2.1. Economy
Canada's largest province in terms of area, Quebec had a gross domestic product (GDP) of more than $274 billion in 2005 (Statistics Canada, 2007b). Its diversified economy, which is largely export oriented, provides Quebecers with a high standard of living and gives them considerable financial means to address t he potential impacts of climate change (see Chapter 2, Section 2.3). Long known for its natural resources, Quebec has seen a profound transformation of its economy in recent decades. It now has a service sector (tertiary sector) in which commercial and financial activities, health and education services, recreation and public administration account for nearly 70% of GDP compared to 30% for goods-producing primary and secondary sectors (Statistics Canada, 2007b). All indications are that this trend towards a service economy will continue, especially in light of continued growth in the information, leisure and tourism industries, and in the health services sector.
Although dominant at the beginning of the twentieth century, the primary sector, including activities such as agriculture, forestry and hunting and fishing, represented only 2.3% of GDP in 2005. In the manufacturing secondary sector, many industries are based on resource transformation, including agri-food and wood processing. The latter industry accounts for nearly 3% of GDP and a sizable share of Quebec exports. In addition, electricity production in Quebec, of which 96% is water-generated, accounts for 4% of GDP and should grow somewhat during the next decade. The same applies to wind power, an industry now flourishing in response to Quebec's new energy policy. Its installed capacity should grow from 100 to 4000 MW by 2015 (Ministère des Ressources naturelles et de la Faune du Québec, 2006a).
The Quebec economy is also characterized by profound differences between its regions. Although manufacturing and service activities play a significant role in providing work and employment in an economically highly diversified southern Quebec, a significant share of direct employment (12% to 20%) in certain other regions is provided by agriculture, forestry, hydroelectricity production and the mining and resource transformation industries. Several hundred communities depend directly on existing natural resources.
This portrait of the Quebec economy should change greatly in coming decades. Based on current demographic and labour productivity trends (+1.6% according to Lafrance and Desjarlais, 2006), Quebec will experience sustained economic growth and double its production in 50 years (Ministère des Finances du Québec, 2005). Households and individuals will see their incomes rise substantially, giving them greater means to satisfy their needs. A rise in education levels and urbanization is also expected (Institut de la statistique du Québec, 2003). In the different administrative regions, demographic change would create important differences in overall and per capita economic growth, compounded by the effects of the different growth rates of the resource industries relative to those of the other economic sectors.
Finally, the production of goods and services will be influenced by changes in trade (new trade agreements, economic development of emerging countries), in technology (demand, production methods or processes) or in the availability and cost of supplies. Although the evolution of certain sectors is easy to project for the first decades, it is less so for the next 50 or 100 years, particularly for industries such as pulp and paper, wood processing and agri-food, which are all subject to rapid socioeconomic changes.
Demographic and sociocultural changes will also have notable impacts on the demand for goods and services, such as an aging population's greater need for health services or that of retirees for recreation, accompanied by the development of technological means to satisfy them. In short, the socioeconomic context will also be quite different from that of the present day and increased links with international markets will result in complex changes (see Chapter 9) to the socioeconomic system's sensitivity to impacts occurring in Quebec and elsewhere.
2.2.2. Social change
The evolution of human systems is closely tied to numerous social aspects, ranging from individual perceptions to public policy and social capital (Adger, 2003), along with leadership (Bacal, 2006) and changing values. Beyond the more easily measurable physical and economic impacts, the magnitude of various impacts of climate change will be influenced by changes in perceptions and social values, both of which are difficult to evaluate. Decision-making designed to cope with the impacts of climate change will be particularly influenced by socioeconomic growth, rising education levels, increased sensitivity to environmental protection, communications and the complexities of environmental issues (Bryant et al., 2007). For example, the concerns of Quebecers for environmental quality prompted governments to strengthen the baselines for animal waste management (National Water Research Institute, 2004) and abandon other major projects such as the Suro ît thermal power station, and even to enact new legislation for the conservation of water resources (Minist ère du Développement durable, de l'Environnement et des Parcs du Québec, 2002). Scientific research on certain extreme climate events, as well as their media coverage, probably had varied social consequences that were significant yet sometimes difficult to measure. Similar realities and perceptions had previously resulted in Quebec displaying an interest in climate change, starting back in November 1992 when it supported the principles and objective of the United Nations Framework Convention on Climate Change. Since then, Quebec has taken different steps, including the publication of its 2006 to 2012 climate change action plan (Minist ère du Développement durable, de l'Environnement et des Parcs du Québec, 2006) and the adoption of sustainable development regulations, that highlight how it supports a concept that was still relatively unknown scarcely 20 years ago.
On another level, a significant proportion of the population lives in precarious socioeconomic conditions related to employment, demographics and immigration, reduced buying power and the challenge of acquiring a higher education level (Institut national de la statistique du Qu ébec, 2001). This part of the population is concentrated in the large cities and poses particular challenges. For other groups, such as the Inuit of Nunavik and the First Nations communities of other regions, their particular socioeconomic situation will increase or decrease their vulnerability to various aspects of climate change.
Nevertheless, there is every reason to believe that public interest in environmental issues, such as climate change, will increase despite the need to deal with many other rapid transformations, including greater international competition, demographics and technological advances, as well as in issues related to social, educational and individual and collective well-being.
2.3. ENVIRONMENT
2.3.1. Built environment
The built environment has grown rapidly in Quebec since the start of the twentieth century, as a result of urbanization, increased wealth, technological development, population growth and sprawl, and the growing interdependence and complexity of socioeconomic activity. The built environment, usually exposed to the climate, is vulnerable to climate events exceeding an established cost/risk threshold. Assuming a stationary climate, structural engineers incorporate climate data from past decades into infrastructure design intended to meet future needs. Naturally, any change to this stationary climate will affect performance, useful life and safety. Whether the impacts are direct or indirect, a climate event can cause destruction, failure, loss of performance or create an external hazard for all exposed infrastructure.
The grouping by type of infrastructure and buildings that constitute the built environment is drawn from the Loi sur les ingénieurs du Québec (Quebec Engineers Act; Ordre des ingénieurs du Québec, 2006). Transportation infrastructure makes socioeconomic activity possible in many regions (isolated, coastal, urban, rural) using a variety of transportation modes (land [road, rail], maritime, air). Infrastructure related to water resources, such as dams (5144 in Quebec, including 333 large dams, according to the National Water Research Institute, 2004), canals and ports uses the hydrosphere. Infrastructure associated with energy and geology is related primarily to the use or conservation of landscapes. Municipal infrastructure deals with water distribution and treatment, surface water management and waste disposal. Buildings represent by far the largest infrastructure group and shelter people. Protection infrastructure, often described as critical, guarantees the safety of the public, of socioeconomic activity and of the natural and built environment. Well known examples include flood protection structures around the city of Winnipeg and New Orleans, as well as coastal riprap and breakwaters in eastern Quebec. Finally, the natural environment can be developed or modified to maintain or upgrade both it and the built environment (slope under a road or artificial shore).
Built environement, particularly municipal infrastructure, is aging overall and many structures have already exceeded their useful life span (Infrastructure Canada, 2004; Villeneuve et al., 1998; 2004). There is an important need now, and in years to come, for new infrastructure, but more so for refurbishing existing infrastructure, and the massive investments expected and planned for the next decades are already being sought (Statistics Canada, 2006). Due to their unique nature, the northern villages in Nunavik have received sizable investments over the past thirty years or so to acquire municipal, school and business infrastructure, as well as a transportation infrastructure. These villages are not connected to each other or to southern Quebec by a road network and therefore rely on supplies being delivered by boat or plane, the latter for the most part using airports with runways that are unpaved or built on permafrost.
Although the built environment will continue to grow, the trends with regard to aging infrastructure, public investments, demographics and urbanization, as well as the increasing density of southern Quebec, suggest that attention will have to be paid to the refurbishment and replacement of existing infrastructure to meet the needs of an aging population whose activities and socioeconomic interests are different from those associated with the twentieth century. These trends suggest that it will be essential to integrate, where relevant, new climate data or new approaches to future design and refurbishment when considering the future vulnerability of the built environment in Quebec.
2.3.2. Natural environment
Quebec covers an area of 1 667 441 km2 and is made up of the Canadian Shield (hills, vast forests and many lakes), the clay plain of the St. Lawrence Lowlands and part of the Appalachians. The many cycles of glacial advance and retreat left the land with little relief, rarely exceeding 900 m in altitude. The northernmost part of the province is characterized by tundra vegetation, soil underlain by more or less continuous permafrost and a harsh climate with strong winds in which adapted plants and wildlife have become established. Farther south, the forest cover (757,900 km 2) is dominated by dense boreal forest (73.7%) that shelters considerable wildlife and a great variety of birds. The mixed wood forest, a combination of hardwoods and conifers, covers the St. Lawrence Lowlands and contains a great diversity of plant and animal species. Moreover, with its thousands of lakes and rivers, it is estimated that Quebec holds 3% of the planet's renewable water. Finally, 10% of groundwater underlies inhabited areas and one-third of Quebec is within the St. Lawrence watershed, which supplies 80% of the population (Ministère des Ressources naturelles du Québec, 2006; Le Québec géographique, 2006). Furthermore, Quebec's basic economic and societal needs for a growing quantity (in absolute value but not in percentage of GDP) of products and services is gradually being met by increasing development of natural resources.
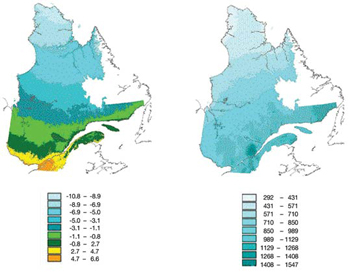
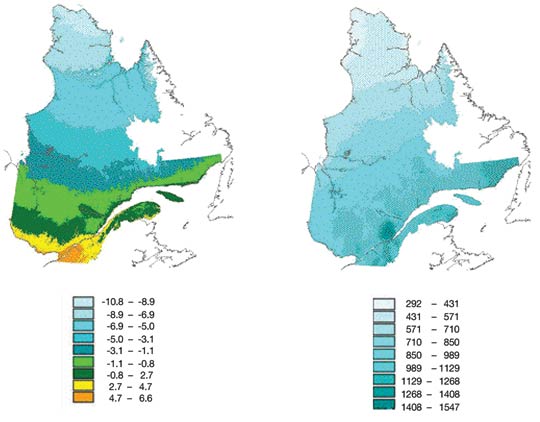
FIGURE 4: Mean annual temperatures (°C) and precipitation (mm) in Quebec
between 1966 and 1996 (Ouranos, 2004).
Text version
Two maps of Quebec showing 1) mean annual temperature (degrees C) and 2) mean annual precipitation (mm) between 1966 and 1996. Mean annual temperatures are highest in the southern region of the province (2.7 to 6.6 degrees C) and decrease northward, to reach -10.8- -8.9 degrees C in the most northern regions. Mean annual precipitation is less variable across the province, but follows a similar trend of decreasing from south to north.
With respect to the atmosphere, many climate characteristics, such as mean annual temperature and total annual precipitation (Figure 4), have contributed to shaping the cryosphere, hydrosphere, biosphere and lithosphere of Quebec over many centuries. The largely spontaneous nature of adaptation processes, in natural systems suggests a higher potential for significant direct and indirect impacts following any change in atmospheric conditions. This contrasts with populations and their socioeconomic activities, which are generally less exposed and have a variety of means for anticipating and adapting to climate change, thus creating a situation potentially conducive to more indirect, more complex impacts.
Human activity has contributed to transforming landscapes, vegetation and wildlife, mainly through population growth and natural resource development. Despite an increasingly service oriented economy and greater importance placed on the natural environment, human activity will induce further changes, including those related to changing climate. Some conclusions on climate trends and projections for Quebec are discussed in the following section, with detailed discussions of these points found in other documents (Ouranos, 2007).
2.3.3. Climate
In addition to the three key elements (population, natural and built environment, socioeconomic activity), regional and local climate changes will strongly influence the nature and magnitude of impacts and adaptation, responses.
Historic climate trends
Barrow et al. (2004) and Gachon et al. (2005) noted statistically significant rises over many decades in annual temperature, total annual precipitation and number of days of rainfall, but shrinking ice cover.

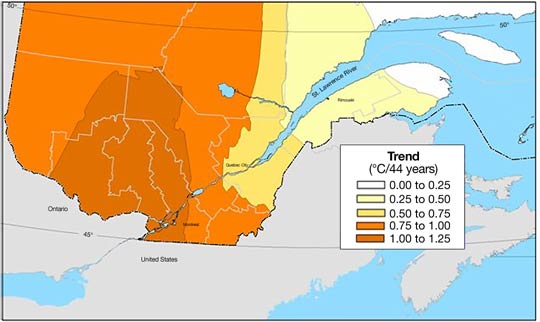
FIGURE 5: Interpolation of trends in mean annual temperature in Quebec between 1960 and 2003. The trends shown here are consistent with analyses done on a continental scale. The large water bodies to the east would explain the east-west difference (Yagouti et al., 2006).
Text version
Map of Quebec showing interpolation of trends in mean annual temperature in Quebec between 1960 and 2003. The easternmost area of the province exhibits the lowest temperature increase (0-0.50 degrees C/44 years). Greatest increases in temperature (1-1.25 °C/ 44 years) were observed in the southern-central portion of the province. Temperature increases in the central regions of the province ranged from 0.50 to 1.00 degrees/44 years.
In recent studies, Yagouti et al. (2006, in press) observed significant warming in several parts of southern Quebec between 1960 and 2003. A marked increase in mean annual temperatures of between 0.5 °C and 1.2°C was observed in southwestern and south-central Quebec. This warming trend shows a decreasing west-to-east gradient and, in southeastern Quebec, an insignificant increase of less than 0.5 °C occurred over the same period. Most stations recorded that warming occurred more rapidly starting in the second half of the 1990s and was more pronounced at night than during the day, primarily in summer. The most significant warming occurred in winter and summer. For example, in summer, minimal temperature increases in south-central and southwestern Quebec ranged from 0.4 to 2.2 °C, whereas the majority of stations in southeastern Quebec recorded no significant trend (Figure 5). Finally, the increase in winter and summer temperatures resulted in a distinct change in several climate indicators, such as growing degree-days, heating degree-days and length of the frost-free season. Readers interested in a more detailed analysis of the evolution of temperatures and the associated climate indicators are referred to the study by Yagouti et al. (2006).
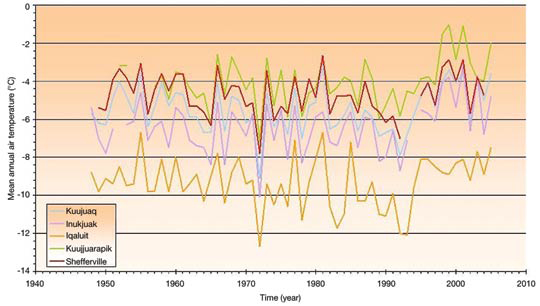
FIGURE 6: Trends in mean annual temperatures for five inhomogeneous stations in northern Quebec (M. Allard, pers. comm., 2006).
Text version
A graph showing trends in mean annual temperatures for five different climate stations in Northern Quebec. From 1950 to 1998, temperatures averaged -6°C, dropping to -4°C from 2000 to 2007 in Kuujuaq, Inukjuak, Kuujuarapick and Shefferville. In Iqaluit, temperatures were colder, at an average of -10°C from 1950 to 1998, dropping to an average of -8°C from 2000 to 2007.”
Analysis of homogeneous data retrieved from several stations suggests that the climate in northern Quebec warmed faster than in any other part of the province during the twentieth century. For example, at Inukjuak, where the longest series of climate data has been collected, the trend in the mean annual temperature shows an increase of 2.9 °C from 1922 to 2004. However, all northern stations (Figure 6), including Inukjuak, exhibit a flat or even slightly downward trend between 1950 and the early 1990s, followed by an increase of at least 1 °C over the 1961 to 1990 normals. As an example of this increase's impact, the temperature of the surface permafrost warmed by nearly 1°C over 10 years at many locations in northern Quebec (Allard et al., 2004).
Other climate studies not specific to Quebec (Intergovernmental Panel on Climate Change, 2007) suggest potential climate trends within the province, including:
- increased cloud cover (Milewska, 2004);
- a decrease in mean sea level pressure gradients between northern and southeastern Canada (Gillett et al., 2003; Wijngaard et al., 2003);
- a recent increase in intense cyclones (McCabe et al., 2001; Lambert, 2004);
- a 181 km northward displacement of the average trajectory of winter depressions in the North Atlantic (Wang et al., 2006);
- an increase in fall precipitation (Stone et al., 2000), although interdecadal variability seems to dominate at the global scale (Zhang et al., 2001);
- less availability of water between 1950 and 2002, mainly in central Quebec (Dai et al., 2004; Ouranos, 2004; D éry and Wood, 2005); and
- a number of modifications to the cryosphere, specifically early spring disappearance of snow and ice between 1966 and 1995 (Groisman et al., 2003; Duguay et al., 2006).
Several studies link these observations to indices such as the North Atlantic Oscillation (NAO), particularly for the cold season (Voituriez, 2003), even in the case of temperatures (Wettstein and Mearns, 2002). Higuchi et al. (2000) suggested that the persistence of a positive NAO and El Ni ño conditions in the Pacific Ocean favour freezing-rain storms in southeastern Canada. An exhaustive description of these studies is, however, beyond the scope of this chapter.
Projected climate scenarios
Following the recommendations in Chapter 2, the seasonal temperature and precipitation changes projected by six global climate models (GCMs) using different scenarios for greenhouse gas emissions are presented for four subregions (Figure 7). Mean changes projected for three decades, centred on the decades 2020, 2050 and 2080, are presented and interpreted in relation to 1961 to 1990 climate normals (Environment Canada, 1993). The four scatterplots (Figures 8 to 11 ) and related summary tables (Tables 1 to 4) summarize the most recent seasonal projections (for interpretations, see Barrow, 2004; Ouranos, 2004; Chaumont, 2005; Chaumont and Chartier, 2005). The regional climate models (RCMs), which simulate dynamics and physics with greater refinement, produce results on spatial and temporal scales of interest for assessing regional impacts (Ouranos, 2004). Increasingly, the results of RCMs, including the Canadian model (CRCM), make it possible to develop more refined projections of climate change (Plummer et al., 2006), hence the inclusion of CRCM results in the scatterplots (see Figures 8 to Figure 11).
Overall, mean temperatures would increase for the three climate decades, especially in the cold season. Total seasonal precipitation would also increase, especially in winter and spring. In the southern and maritime subregions, changes in total summer and autumn precipitation remain undetermined, with as many scenarios indicating decreases as increases, and some decreases being as much as 25%. The projected changes generally diverge from natural climate variability simulated by the CGCM3 starting in the 2020s for temperature and much later for precipitation, sometime in the 2050s or even later in the 2080s.
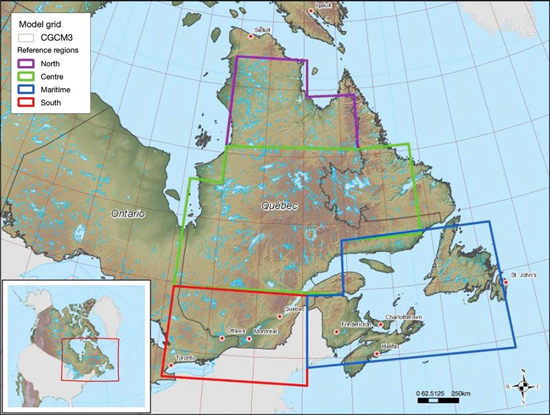
FIGURE 7: The four subregions chosen to establish equally probable scenarios expressed in the form of scatterplots (temperature/precipitation). The grid of the Canadian Global Coupled Model (CGCM3) was added to illustrate the typical spatial resolution of Global Circulation Models (GCMs).
Text version
A map of eastern Canada, including Ontario, Quebec and the Atlantic Provinces which shows the location of four subregions in Quebec (south, central, maritime, and northern) which were chosen to establish equally probable scenarios expressed in the form of scatterplots (temperature/precipitation). The grid of the Canadian Global Coupled Model (CGCM3) is overlain to illustrate the typical spatial resolution of Global Circulation Models (GCMs).
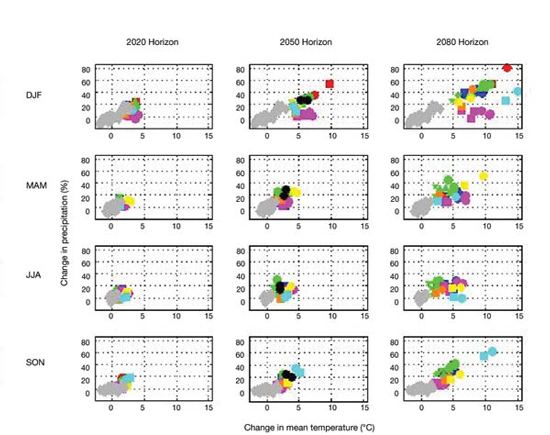
FIGURE 8: Scatterplots of changes in temperature/precipitation for the north subregion by season and by future climate period, compared to 1961 to 1990 climate normals. The values come from several GCMs (colour) for different scenarios of GHG emissions (shape).
The grey diamonds indicate natural variability of the climate over 1000 years of the CGCM3 control simulation. Each diamond represents an average of 30 years. The changes simulated by CRCM 4.1.1 deal only with the 2050s. For legend, see Figure 11.
Text version
Twelve scatterplots of showing projected changes in temperature/precipitation for the north subregion by season (Winter, Spring, Summer, Fall) and by future climate period (2020s, 2050s and 2080s), compared to 1961 to 1990 climate normals. The values come from 7 GCMs for 6 different emissions scenarios. Natural variability of the climate is also shown. Mean temperature is projected to increase over time for each season, with the variation between projections also increasing with time.
Projected temperature increases for all seasons by 2020s range from 0-5 degrees C. For the 2050's, projected changes range from ~0-5 degrees C for the spring, summer and fall, and by ~4-10 degrees C for the winter. For the 2080s, temperature is projected to increase by about ~2-10 degrees C in the spring and fall, by ~2-7 degrees C for the spring and by ~5-15 degrees C for the winter.
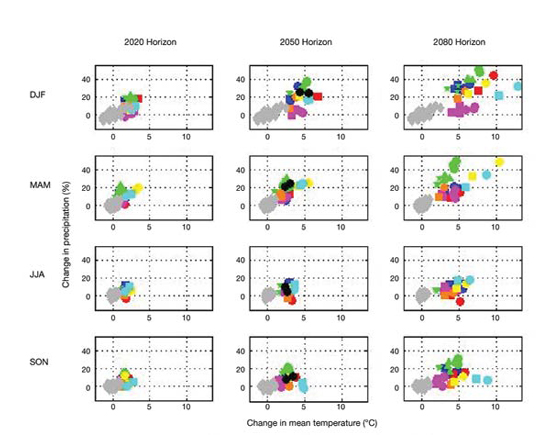
FIGURE 9: Scatterplots of changes in temperatures/precipitation for the central subregion by season and by future climate period compared to 1961 to 1990 climate normals. The values come from several GCMs (colour) for different scenarios of GHG emissions (shape). The grey diamonds indicate natural variability of the climate over 1000 years of the CGCM3 control simulation. Each diamond represents an average of 30 years. The changes simulated by CRCM 4.1.1 deal only with the 2050s. For legend, see Figure 11.
Text version
Twelve scatterplots of showing projected changes in temperature/precipitation for the central subregion by season (Winter, Spring, Summer, Fall) and by future climate period (2020s, 2050s and 2080s), compared to 1961 to 1990 climate normals. The values come from 7 GCMs for 6 different emissions scenarios. Natural variability of the climate is also shown. Mean temperature is projected to increase over time for each season, with the variation between projections also increasing with time.
Projected temperature increases for all seasons by 2020s range from 0 -5 degrees C. For the 2050s, projected changes range from ~0-5 degrees C for the spring, summer and fall, and by ~4-10 degrees C for the winter. For the 2080s, temperature is projected to increase by about ~3-6 degrees C in the summer and fall, by ~2-7 degrees C for the spring and by ~5-15 degrees C for the winter.
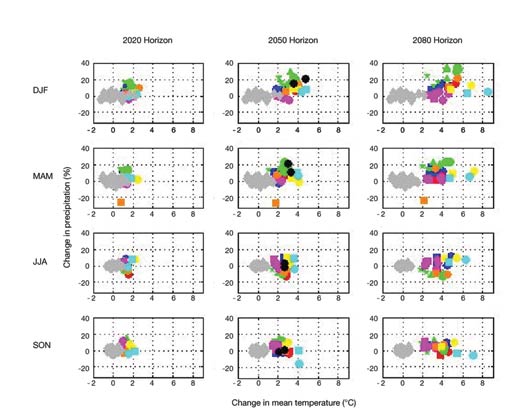
FIGURE 10: Scatterplots of changes in temperatures/precipitation for the maritime subregion by season and by future climate period compared to 1961 to 1990 climate normals. The values come from several GCMs (colour) for different scenarios of GHG emissions (shape).
The grey diamonds indicate natural variability of the climate over 1000 years of the CGCM3 control simulation. Each diamond represents an average of 30 years. The changes simulated by CRCM 4.1.1 deal only with the 2050s. For legend, see Figure 11.
Text version
Twelve scatterplots of showing projected changes in temperature/precipitation for the maritime subregion by season (Winter, Spring, Summer, Fall) and by future climate period (2020s, 2050s and 2080s), compared to 1961 to 1990 climate normals. The values come from 7 GCMs for 6 different emissions scenarios. Natural variability of the climate is also shown. Mean temperature is projected to increase over time for each season with the variation between projections increasing with time.
Projected temperature increases for all seasons by 2020s range from ~0 -2 degrees C. For the 2050s, projected changes range from ~2-4 degrees C for the spring, summer and fall, and by ~2-5 degrees C for the winter. For the 2080s, temperature is projected to increase by about ~3-6 degrees C in the summer and fall, and by ~2-8 degrees C for the spring and by ~2-8 degrees C for the winter.
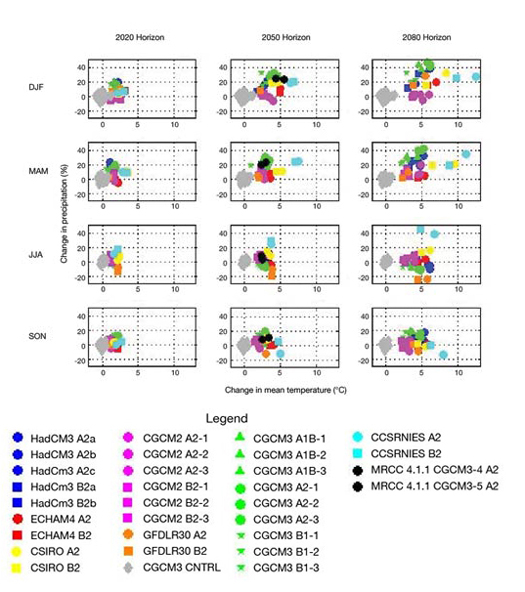
FIGURE 11: Scatterplots of changes in temperature/precipitation for the south subregion of Quebec by season and by future climate period compared to 1961 to 1990 climate normals. The values come from several GCMs (colour) for different scenarios of GHG emissions (shape).
The grey diamonds indicate natural variability of the climate over 1000 years of the CGCM3 control simulation. Each diamond represents an average of 30 years. The changes simulated by CRCM 4.1.1 deal only with the 2050s.
Text version
Twelve scatterplots of showing projected changes in temperature/precipitation for the south subregion by season (Winter, Spring, Summer, Fall) and by future climate period (2020s, 2050s and 2080s), compared to 1961 to 1990 climate normals. The values come from 7 GCMs for 6 different emissions scenarios. The grey diamonds indicate natural variability of the climate. Mean temperature is projected to increase over time for each season with the variation between projections increasing with time.
Projected temperature increases for all seasons by 2020s range from ~0 -4 degrees C. For the 2050s, projected changes range from ~1-6 degrees C for the winter and spring, and by ~1-5 degrees C for the summer and fall. For the 2080s, temperature is projected to increase by about ~3-12 degrees C in the winter and spring, and by ~2-7 degrees C for the summer and fall.
| Season | 1980s climate | Delta 2020s | Delta 2050s | Delta 2080s | |
|---|---|---|---|---|---|
| Winter | Temperature | -21 to 25°C | +2,5 to +3,5°C | +4 to +7°C | +6 to +12,5°C |
| Precipitation | 60 to 180 mm | +1 to +18% | +2 to +32% | +5 to +53% | |
| Spring | Temperature | -7 to -17°C | +0,5 to +2°C | +1,5 to +3.5°C | +2,5 to +7°C |
| Precipitation | 75 to 125 mm | +1 to +12% | +4 to +26% | +8 to +35% | |
| Summer | Temperature | 6 to 10°C | +1 to +2,5°C | +1,5 to +4°C | +2 to +6°C |
| Precipitation | 150 to 230 mm | +1 to +12% | +3 to +19% | +5 to +28% | |
| Fall | Temperature | 1 to 4°C | +1,5 to +2,5°C | +2 to +3,5°C | +2,5 to +6°C |
| Precipitation | 150 to 240 mm | +2 to +16% | +5 to +24% | +9 to +42% |
| Season | 1980s climate | Delta 2020s | Delta 2050s | Delta 2080s | |
|---|---|---|---|---|---|
| Winter | Temperature | -11 to -21°C | +1,5 to +3°C | +3 to +5,5°C | +4,5 to +9,5°C |
| Precipitation | 130 to 325 mm | +1 to +18% | +4 to +32% | +6 to +47% | |
| Spring | Temperature | 3 to -7°C | +0,5 to +2°C | +1,5 to +4,5°C | +2,5 to +8,5°C |
| Precipitation | 125 to 300 mm | +1 to +19% | +6 to +25% | +8 to +45% | |
| Summer | Temperature | 10 to 17°C | +1 to +2°C | +2 to +3,5°C | +2,5 to +5,5°C |
| Precipitation | 230 to 310 mm | 0 to +8% | -2 to +13% | 0 to +13% | |
| Fall | Temperature | -1 to 6°C | +1 to +2°C | +1,5 to +4°C | +2,5 to +5.5°C |
| Precipitation | 215 to 300 mm | 0 to +13% | 0 to +20% | +2 to +26% |
| Season | 1980s climate | Delta 2020s | Delta 2050s | Delta 2080s | |
|---|---|---|---|---|---|
| Winter | Temperature | -10 to -13°C | +1 to +2°C | +2 to +4°C | +3 to +6°C |
| Precipitation | 295 to 400 mm | -2 to +12% | -1 to +21% | +1 to +32% | |
| Spring | Temperature | -1 to -3°C | +1 to +2°C | +1,5 to +3,5°C | +2,5 to +5°C |
| Precipitation | 250 to 325 mm | -3 to +13% | -2 to +16% | +1 to +23% | |
| Summer | Temperature | 13 to 17°C | +1 to +1,5°C | +1,5 to +3°C | +2,5 to +5°C |
| Precipitation | 250 to 350 mm | -6 to +7% | -10 to +9 | -11 to +9% | |
| Fall | Temperature | 3 to 6°C | +1 to +1,5°C | +1,5 to +3°C | +2 to +5°C |
| Precipitation | 275 to 350 mm | +2 to +11% | -3 to +11 | -3 to +11% |
| Season | 1980s climate | Delta 2020s | Delta 2050s | Delta 2080s | |
|---|---|---|---|---|---|
| Winter | Temperature | -7,5 to -11°C | +1 to +2,5°C | +2 to +5°C | +3,5 to +8°C |
| Precipitation | 270 to 330 mm | -5 to +19% | 0 to +32% | +1 to +43% | |
| Spring | Temperature | 270 to 330 mm | -5 to +19% | 0 to +32% | +1 to +43% |
| Precipitation | 240 to 280 mm | -1 to +19% | +2 to +25% | +4 to +39% | |
| Summer | Temperature | 18 to 20°C | +1 to +2°C | +2,5 to +4°C | +2,5 to +6°C |
| Precipitation | 280 to 350 mm | -5 to +10% | -7 to +13% | -11 to +15% | |
| Fall | Temperature | 6,5 to 9°C | +1 to +2,5°C | +2 to +4°C | +2,5 to +5,5°C |
| Precipitation | 270 to 330 mm | -1 to +10% | -8 to +16% | -7 to +18% |
Page details
- Date modified: