
Climate Science
Climate science is an intrinsic and important aspect of addressing vulnerability. Understanding why and how the climate is changing is critical to dealing with climate change. Each regional chapter of this assessment discusses the region's current climate, recent climate trends and future projections as input into analyses of sensitivity and vulnerability. This section complements material in the regional chapters by providing an overview of the causes of climate change, evidence for recent global climate change, and future changes in global climate. Climate change in Canada is discussed in Section 4.3. For more detailed information, readers are referred to the report An Introduction to Climate Change: A Canadian Perspective (Hengeveld et al., 2005), as well as the more technical reports prepared by Working Group I of the Intergovernmental Panel on Climate Change (2001c, 2007a).
3.1 CLIMATE CHANGE DRIVERS
Climate change drivers comprise both natural factors, such as solar orbit, sunspot cycles and volcanic eruptions, and anthropogenic factors, including emissions of greenhouse gases. These drivers influence the amount of energy that the Earth receives from the sun and the amount that is retained within the atmosphere and oceans, resulting in changes in all elements of climate, such as temperature, precipitation and atmospheric circulation. Climate change drivers operate on a range of time scales, with changes in some factors (e.g. the orbit of the Earth around the sun) operating over tens to hundreds of thousands of years, whereas changes in others (e.g. atmospheric concentrations of greenhouse gases and volcanic aerosols) operate on shorter time scales. At timescales of decades to centuries, long-term drivers such as orbital variation are not as relevant. That is because, despite the large magnitude of related changes in climate when accumulated over many millennia, the rate of change on a century time scale is very small, on the order of 0.1 °C/century or less.
Since the mid-twentieth century, human activities, including the burning of fossil fuels and changes in land-use patterns, have been the dominant cause of climate change (Intergovernmental Panel on Climate Change, 2007a). This trend is expected to continue through the present century and beyond, leading to rates of global warming that will exceed any experienced during the past several thousand years (Intergovernmental Panel on Climate Change, 2007a).
Paleoclimatic Change
During the past two and a half million years, the Earth's climate has been dominated by large fluctuations between glacial and interglacial conditions. Although average global surface temperatures during glacial periods were only about 4 to 6 °C colder than during the warm interglacial periods, these changes were enough to alter Canada's landscape from one almost entirely covered with thick ice sheets to the hospitable biome of today. The last global deglaciation began about 20 000 years ago, and full interglacial conditions have dominated the Earth's climate for the past 10 000 years. The best analogue for the current interglacial, in terms of both climate forcing and the pattern of paleogeographic changes, may be the interglacial that took place some 400 000 years ago (European Project for Ice Coring in Antarctica community members, 2004). A comparison of the two periods suggests that the Earth's present climate, if allowed to evolve naturally, might last an additional 20 000 years or so before the conditions begin to slide back into the glacial part of the cycle.
Changes in solar insolation due to variations in the Earth's orbit around the sun are thought to be the primary driver of climate change across glacial-interglacial cycles. These variations include the 100 000 year cycle in the shape (eccentricity) of the Earth's orbit (from ellipse to circle and back again), the 42 000 year cycle in the angle (obliquity) of its axis of rotation with respect to the orbit, and the 22 000 and 19 000 year cycles in its wobble (precession). Reconstruction of past changes in atmospheric composition during the past 650 000 years from ice cores extracted from polar ice sheets indicates that the responsive changes in atmospheric concentrations of carbon dioxide, methane and nitrous oxide, three key natural greenhouse gases, significantly amplified the climatic effects of changes in solar insolation (Hutterli et al., 2005; Spahni et al., 2005).
Analyses of various proxy climate records extracted from polar ice cores, ocean sediments and other sources suggest that global temperatures have been remarkably stable during the past 10 000 years, a period referred to as the Holocene. These data also indicate, however, that this period has experienced some pronounced changes in regional climates, likely due to natural, internal climate variability. Such events involved a redistribution of heat within the climate system rather than a change in the total energy of the system (as in the case of the enhanced greenhouse effect).
Anthropogenic Forcings
Human activities, including greenhouse gas emissions (e.g. of carbon dioxide, methane and nitrous oxide), aerosol emissions (e.g. sulphate, carbon, nitrate and dust) and land-use change (e.g. deforestation, land development) are increasingly affecting global climate. Although natural factors can explain much of the global climate change that occurred during the first part of the twentieth century, the warming observed in the late twentieth century is primarily due to human activities that have led to increased atmospheric concentrations of greenhouse gases (Intergovernmental Panel on Climate Change, 2001c, 2007a; see Table 4). The effect of this anthropogenic radiative forcing on climate since 1950 has been approximately five times greater than the influence of solar output changes (Intergovernmental Panel on Climate Change 2007a; see Figure 4).
| Greenhouse gas | 2005 concentration | Pre-industrial concentration |
|---|---|---|
| Carbon dioxide | 379 ppm | ~280 ppm |
| Methane | 1774 ppb | ~715 ppb |
| Nitrous oxide | 319 ppb | ~270 ppb |
Although the rate of increase in the concentrations of human-induced nitrous oxide and methane are currently stable or declining, the rate of increase in carbon dioxide (the most important greenhouse gas with significant anthropogenic influence) emissions continues to rise (Intergovernmental Panel on Climate Change, 2007a). The predominant sources of carbon dioxide emissions are fossil fuels (production, distribution and consumption), cement production and land-use changes associated with forestry and agriculture.
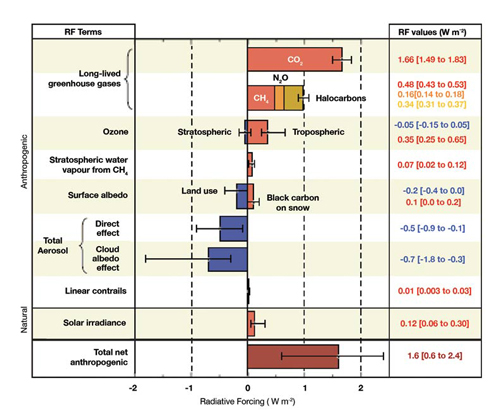
FIGURE 4: Global-average (2005) radiative forcing components of important agents and mechanisms. Modified from Intergovernmental Panel on Climate Change (2007a).
text version - Figure 4
Figure 4
Graph depicting global-average radiative forcing (RF) from 2005. Components of important agents and mechanisms are divided into anthropogenic and natural. Anthropogenic RF includes long-lived greenhouse gases, ozone, stratospheric water vapour from CH4, surface albedo, total aerosol (direct effect and cloud albedo effect) and linear contrails while solar irradiance is the only component of natural RF. RF is measured in W m -2 and the values of each agent is available on the right of the graph.
Atmospheric aerosols emitted by human activities also affect climate, both directly (by reflecting sunlight back to space) and indirectly (through effects on cloud properties). Although their effects are short lived (as they are removed by gravity and precipitation), they significantly affect radiative forcing at the continental to global scale. Aerosols have a negative radiative forcing (cooling effect) and are likely to have offset some of the warming during the twentieth century that would otherwise have been induced by greenhouse gases (Intergovernmental Panel on Climate Change, 2007a).
Feedbacks and Interactions
In addition to these primary drivers of climate change, there are numerous complex interactions and feedbacks in the climate system, at a variety of spatial and temporal scales, that either enhance or moderate climate change. Some of these feedbacks are positive (i.e. they amplify the magnitude of the original change) and others are negative (i.e. they moderate the original change). Particularly important feedbacks are the role of atmospheric water vapour (which also functions as a greenhouse gas) and clouds (which both reflect sunlight and absorb outgoing heat radiation). Rising temperatures increase both the rate of surface evaporation of water and the atmosphere's capacity to hold water vapour (a positive feedback). More water vapour also affects the distribution and properties of clouds in complex ways, providing both positive and negative feedbacks. Another important feedback is the change in the reflectivity of Earth's surface (albedo) that results from changes in the extent of snow and ice cover. The potential for release of large volumes of methane as a result of permafrost degradation, and subsequent decomposition of previously frozen organic material, is another example of a positive feedback that would enhance climate change (cf. Hyndman and Dallimore, 2001). A negative feedback is the potential for reduced Arctic sea-ice cover to allow arctic marine waters to absorb additional CO 2 from the atmosphere (Bates et al., 2006).
3.2 CLIMATE VARIABILITY
Interactions between the ocean and the atmosphere, and changes in associated circulation patterns, are the primary cause of climate variability. These changes are not directly related to changes in the global energy balance, although indirect interactions are likely. Much of this variability is natural, reoccurring at time scales that vary from months to decades and even longer. Because these oscillations change the flow of warm and cold air masses and alter storm tracks, they often cause trends in one region or location opposite to those in another, resulting in relatively small changes in large-scale climate. Nevertheless, their impact on regional climate in different parts of Canada can be quite significant.
Climate variations of particular importance to Canada include the following:
El Niño-Southern Oscillation (ENSO):
This well-known pattern of variability causes surface temperatures of the tropical Pacific Ocean to vary from El Niño conditions (abnormally warm temperatures in the eastern tropical Pacific) to La Niña conditions (much colder surface waters in the tropical Pacific) and back again about once every 3 to 7 years. In transition years, neither condition dominates.
The strength of the easterly trade winds in the tropics is closely related to ENSO behaviour. Strong El Ni ño and La Niña events, however, can also dramatically affect the flow pattern of winds and storm tracks over Canada, and hence temperature and precipitation patterns. These impacts are most evident in British Columbia, where El Niño events bring warmer and drier conditions than La Niña events (see Chapter 8). The impacts of ENSO are strongest in winter and spring, and are a significant factor in the country's year-to-year climate variability.
Pacific Decadal Oscillation (PDO):
This pattern of variability is most prominent in the North Pacific, and therefore has a large influence on the mid-latitude climates of North America, particularly that of western Canada. Its cause is not well understood, but it is likely linked to ocean circulation processes. Although the record is too short to determine whether the PDO is a persistent mode of variability, there have been two full cycles during the past century. The positive (warm) PDO phase is characterized by warmer coastal waters in the northeastern Pacific. In British Columbia, the positive PDO is associated with slightly higher winter and spring temperatures, and variable effects on precipitation, whereas the negative PDO phase is associated with cooler and wetter conditions (see Chapter 8). Hence this oscillation has been a significant influence on climate variability over much of Canada on multi-decadal time scales.
Arctic and North Atlantic Oscillations (AO and NAO):
The North Atlantic Oscillation is an indicator of atmospheric pressure differences between high and temperate latitudes of the North Atlantic Ocean. It is related to variations in the behaviour of the westerly winds of the Northern Hemisphere, so variations in the NAO affect the entire hemisphere. Alternatively, the Arctic Oscillation index (also known as the Northern Annular Mode, or NAM) describes variation in pressure patterns around the North Pole. The two appear to be closely linked. Variations in the NAO-AO significantly influence the monthly and annual variability of Northern Hemisphere climates, but also show significant long-term trends. There are indications that the anomalous behaviour evident in both indices during the 1990s may reflect human influences on the global climate circulation system (Hegerl et al., 2007).
3.3 OBSERVED AND PROJECTED CHANGES IN CLIMATE (GLOBALFootnote 3)
Observed Changes
"Warming of the climate system is unequivocal."
(Intergovernmental Panel on Climate Change, 2007a)
During the past century, the world has become warmer. This is evidenced by the increase in global average air and ocean temperatures, the rise in sea level and the decline in snow (Figure 5) and ice cover. Increased temperatures have been accompanied by a number of other observed changes in global climate (Table 5). For example, global sea level has risen an estimated 0.17 m (range 0.12 -0.22 m) over the past century, with the rate of increase accelerating during the past decade (1993 -2003; Intergovernmental Panel on Climate Change, 2007a).
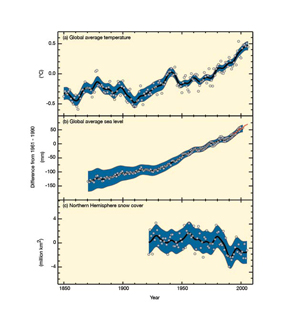
FIGURE 5:Observed changes (relative to 1961-1990) in global average surface temperature, sea level and Northern Hemisphere snow cover (Intergovernmental Panel on Climate Change, 2007a).
text version - Figure 5
Figure 5
Dot graph depicting observed changes relative to 1961-1990 in global average surface temperature, sea level and Northern Hemisphere snow cover. Temperature changes demonstrate an upward trend which has demonstrated an upward trend of approximately 1 C. Sea level has also progressively gone up 100mm. Snow cover in the Northern Hemisphere remained fairly constant until 1980 and since then has dropped 3 million km2.
Shifts in precipitation patterns have also been observed. Some regions have seen increases in precipitation (e.g. northern Europe, northern and central Asia, and northern North America), while others have experienced declines (e.g. the sub-Saharan grasslands and southeastern Africa). In general, precipitation has increased at high latitudes and in the tropics, but decreased in the subtropics. Of greater concern than changes in annual precipitation for many regions is the increased frequency of heavy precipitation events that overload drainage systems, cause extensive flooding, trigger landslides and compromise drinking water and sewage systems, resulting in loss of lives and severe health and economic impacts (see Chapter 9).
Climate Projections
Projections of climate are derived from climate modelling experiments (see Box 3) In many cases, future changes will involve a continuation, and often acceleration in the rate, of the observed trends of the twentieth century. The fourth assessment report of Working Group I of the Intergovernmental Panel on Climate Change (2007a; Meehl et al., 2007) discusses the key changes projected during the twenty-first century (Table 6). Significant advances in this report relative to previous IPCC assessments include greater confidence in model projections, improved projections of extreme events and stronger attribution of observed changes to anthropogenic forcing, all due to the advances in climate science and computer capacity, and longer observational periods.
| Indicator | Change | Comments |
|---|---|---|
| Air Temperature | Increased 0.74°C Increased 0.13°C per decade |
1906-2005 Rate (last 50 years) |
| Ocean Temperature | Increased to depths of 3000 m | |
| Sea level | Rose 1.8 mm/a Rose 0.17 m |
Rate (1961-2003) Total (1900-2000) |
| Snow cover | Declined | Northern Hemishpere |
| Mountain glaciers | Widespread retreat | Since 1900 |
| Arctic sea-ice extent | Decreased 2.7% per decade | Rate (1978-2005) |
| Permafrost extent | Decreased by ~7% | Since 1900 |
| Heavy precipitation events | Increased in frequency | |
| Droughts | Increased in intensity and duration | Since 1970s |
| Heat waves | Increased in frequency | |
| Tropical cyclones | Increased in intensity | Since 1970s |
During the next two decades, IPCC-derived best estimates are that average global temperature will increase by 0.2 °C/decade. Even if atmospheric concentrations of greenhouse gases were kept constant at year 2000 levels, global mean temperature would continue to increase by 0.1 °C/decade (Intergovernmental Panel on Climate Change, 2007a) for the next two decades. Geographic variation in amount of warming is projected, with the greatest warming occurring over land and at high northern latitudes. Precipitation is also projected to increase more at high latitudes, and to decrease most in subtropical land regions. Sea level is projected to rise 0.18 to 0.59 m by 2100, depending on the scenario used (see Table 3).
Higher temperatures will be accompanied by continued reductions in snow cover, reduced extent and duration of Arctic sea ice, and an increase in the depth of permafrost thaw (Intergovernmental Panel on Climate Change, 2007a). Over longer time scales, the magnitudes of projected global temperature increase and sea-level rise are dependent on the assumptions inherent in the scenario used (Table 3), but it is important to note that the directions of such changes are consistent among the emission scenarios.
Changes in extreme weather, including hot days, cold days and heavy precipitation events, will accompany gradual warming (Kharin et al., 2007). Based on outputs of multimodel runs (12 -14 models), Kharin et al. (2007) have projected that days of extreme heat in the summer will become hotter, winter cold extremes will warm substantially and heavy precipitation events will occur more frequently. Other studies suggest that tropical and winter cyclones may become more intense in the future due to rising sea-surface temperatures (Webster et al., 2005; Lambert and Fyfe, 2006).
| Indicator | Change | Likelihood |
|---|---|---|
| Cold days and nights | Warmer and fewer | Virtually certain |
| Hot days and nights | Warmer and more frequent | Virtually certain |
| Heat waves | More frequent | Very likely |
| Hot extremes | More frequent | Very likely |
| Heavy precipitation events | More frequent | Very likely |
| Meridional overturning circulation of Atlantic Ocean | Slowdown (by 25%) | Very likely |
| Increase in area affected | Droughts | Likely |
| Tropical cyclones | More intense | Likely |
Researchers acknowledge that there is also a real and finite risk of large and potentially cataclysmic surprises that are not captured by model simulations (Intergovernmental Panel on Climate Change, 2007a) but could have dire consequences. These include 1) the potential sudden reduction or shutdown of the Atlantic meridional overturning circulation that transports large quantities of heat from the equator to the North Atlantic, and without which Europe's annual temperature would be much cooler; 2) the disintegration of the west Antarctic ice sheet, which could cause global sea level to rise by 5 m; and 3) the abrupt release of large quantities of methane from frozen gas hydrates below the ocean floor, which would cause methane concentrations in the atmosphere to rise rapidly, resulting in further and more pronounced global warming. Although it appears very unlikely that such surprises will be fully realized within the next century, the irreversible processes that ultimately lead to them could be triggered before 2100. Paleoclimate records show that such surprises have occurred in the past, particularly during periods of rapid climate transition.
Page details
- Date modified: