
Implications of Changing Climate for the Arctic Environment
Of the many components that constitute the Arctic environment, the cryosphere is the most sensitive to the effects of changing climate. The cryosphere includes sea ice, seasonal snow cover, glaciers and ice caps, permafrost, and river and lake ice. All of these are effective indicators of climatic trends and important in various climate feedbacks through changes in energy, moisture and gas fluxes (e.g. Intergovernmental Panel on Climate Change, 2007a; Anisimov et al., 2007; Lemke et al., 2007; Trenberth et al., 2007). Terrestrial, freshwater and marine ecosystems will be impacted by changes in the cryosphere and by other aspects of climate change (Arctic Climate Impact Assessment, 2004, 2005). The following summary of several of the most important changes to the cryosphere and related ecosystems draws extensively on relevant chapters of the Arctic Climate Impact Assessment (Callaghan et al., 2005; Walsh et al., 2005; Wrona et al., 2005).
3.1 SEA ICE
Sea-ice areal coverage varies generally from 5 to 6 million km2 at the end of the summer to 14 million km2 at the end of the winter (Parkinson et al., 1999). Sea-ice thickness increases along the path of sea-ice drift and convergence from west to east (from the Siberian side of the Arctic to the Canadian Arctic Archipelago). The annual averaged area of sea ice in the Northern Hemisphere has decreased by 7.4% (3% per decade) between 1978 and 2003 (Johannessen et al., 2004). The annual maximum ice area has shrunk less rapidly, at about 2% per decade, whereas the annual minimum has declined more rapidly, at about 5.6% per decade. Much of the decrease in annual minimum ice area is a consequence of decline in the area occupied by multi-year ice, about 14% (6.7% per decade) between 1978 and 1999 (Johannessen et al., 1999). The loss of thick old floes from the polar pack has caused an obvious decrease in ice thickness in the central Arctic Ocean (Rothrock et al., 1999; Holloway and Sou, 2002).
The primary cause of reductions in ice thickness and in late summer ice extent has been an increased export of multi-year ice from the Arctic via Fram Strait during 1989 –2003, not atmospheric warming (Rigor et al., 2002; Fowler et al., 2004; Rigor and Wallace, 2004; Belchansky et al., 2005). Data from Siberia and northern Canada during the second half of the twentieth century revealed no significant change in the thickness of first-year ice (Brown and Coté, 1992; Polyakov et al., 2003). Although the rate of decrease in late summer ice extent is consistent with the trend in multi-year sea ice (Comiso, 2002), this decrease has been especially large north of the Russian and Alaskan coasts, and considerably less within Canadian waters (Walsh et al., 2005). Even in the much cooler mid –nineteenth century, the extent of summer sea ice in the Canadian Archipelago, insofar as it is shown from ship tracks and the logbooks of explorers, was similar to the present (Wood and Overland, 2003).
All AOGCMs project decreases in sea-ice extent during the twenty-first century. Projections from the CGCM2 model indicate an ice-free Arctic during September by the mid –twenty-first century, whereas other models project ice-free summers in the Arctic by 2100. Therefore, although models differ in their projections of when ice-free Arctic summers can be expected, they agree in projecting that such conditions will eventually develop. By the year 2100, model projections of decreases in annual sea-ice extent vary from about 2 to 4 million km 2, and none of the model projections is close to ice free for the month of March. A modest future retreat of pack ice in winter is anticipated where it meets temperate oceans (i.e., in the Labrador, Greenland, Barents, Okhotsk and Bering seas).
Atmosphere-Ocean General Circulation Models have limitations when projecting future changes in sea ice. Scientific understanding of sea-ice dynamics is incomplete and the representation of the Arctic atmosphere-ice-ocean system in global climate models is relatively primitive. Also, the modelling of sea-ice climate is very sensitive to positive feedbacks between sea ice and climate, and small errors in representing this feedback can have large implications (Walsh et al., 2005). For example, the spatial grid of the modelled ocean is generally too coarse to represent the Canadian Arctic Archipelago (see Kattsov et al., 2005, Table 4.1). Therefore, the observational record of sea-ice extent in Canadian Arctic waters, and an understanding of the physical processes involved, become particularly important in projecting future changes in sea-ice regime.
3.2 SNOW COVER
In the Arctic regions, snow can account for up to 80% of annual precipitation. Snow insulates the ground, affecting the ground thermal regime and permafrost distribution (Marsh, 1990). Snow also influences surface radiation balances and water budgets (Gray and Prowse, 1993), and affects the habitat of terrestrial and aquatic biota (e.g. Adams, 1981).
From 1972 to 2003, average annual snow-cover extent in the Northern Hemisphere decreased by about 10%. The largest decreases occurred during spring and summer, which correlated with a large spring warming over northern land areas (Brown, 2000; Walsh et al., 2005). The largest changes in snow depth in northern Canada for the period 1946 to 1995 were decreases observed for the Mackenzie River basin (Brown and Braaten, 1998), although even more recent records (1955 –1956 to 2002–2003) have also shown significant decreases in the mean and maximum depths of snow cover for the eastern and western Arctic stations (Environment Canada, 2007). Decreases in snow depth have been accompanied by reductions in spring and summer snow-cover duration and extensive reductions in spring snow-covered area (Brown et al., 2004).
Projected increases in temperature will decrease the length of time available for accumulation of a winter snowpack, thereby affecting the magnitude of the spring snowmelt, the major hydrological event of the year in most northern systems (Marsh, 1990). Although changes in mean annual snow cover are generally not expected to be very large for the present century, even for the period 2071 to 2090 when the projected changes vary from –9 to –18% (Walsh et al., 2005), the most pronounced changes in snow extent are expected in the shoulder seasons, November and April, the latter being most influential for spring runoff.
3.3 GLACIERS AND ICE SHEETS
The estimated total volume of land ice in the circumpolar Arctic is approximately 3.1 million km 3, which is equivalent to about 8 m of sea level (Dowdeswell and Hagen, 2004). Although the majority of this is contained on Greenland, Canada has major glaciers and ice caps in the high Arctic and Yukon. In general, glaciers and ice caps across the Arctic (apart from the Greenland Ice Sheet) show a retreat in glacier fronts and volume decreases since about 1920, although there are large regional variations (Walsh et al., 2005). For the Canadian high Arctic (data since about the 1960s), the monitored glaciers and ice caps on the Queen Elizabeth Islands (except the Meighen Ice Cap, which may be cooled from an increasingly open ocean nearby) show a weak but significant trend towards increasingly negative mass balances, primarily due to slight summer warming (Koerner, 2005).
The mass balance for all ice caps in the Canadian Arctic Archipelago over a five-year period at the end of the last century is estimated to be –25 km3/a of ice, which corresponds to a global sea-level rise of 0.064 mm/a (Abdalati et al., 2004). Although this is significant, more pronounced ablation has been recorded for the Yukon-Alaska glacier network, where accelerated melting of 1.5 ± 0.5 mm/a has contributed almost 9% of the observed global sea-level rise during the past 50 years, and possibly as much as 3.2 mm/a during the past decade or so (Arendt et al., 2002). From the mid-1990s to 2000 –2001, enhanced thinning of Yukon-Alaska glaciers likely equates to a sea-level rise almost double that estimated for the Greenland Ice Sheet during the same period (Rignot and Thomas, 2002).
Over the long term, the Greenland Ice Sheet is projected to make the largest contribution to future sea-level changes, but meltwater from glaciers in Alaska-Yukon are also projected to make a significant addition (Arendt et al., 2002; Meier and Dyurgerov, 2002). Future contributions from the high Arctic remain to be quantified but could also be significant (Abdalati et al., 2004). Glacier ablation also affects the magnitude and timing of river flows and drainage patterns (e.g. Clague et al., 2006).
3.4 PERMAFROST
Active layer and permafrost thermal-monitoring activities during the last two to three decades indicate that recent warming of permafrost has occurred in many regions of the Canadian permafrost zone (e.g. Broll et al., 2003; Couture et al., 2003; Kershaw, 2003; Smith et al., 2003, 2005), and that summer thaw penetration has increased in the 1990s (e.g. Smith et al., 2001b, 2005; Mackay and Burn, 2002; Nixon et al., 2003; Tarnocai et al., 2004). The magnitude of permafrost warming has varied both regionally (Smith et al., 2005) and temporally, with generally greater warming occurring in the western Arctic and later warming occurring in the eastern and high Arctic (Brown et al., 2000; Smith et al., 2005). The response of the active layer to extreme warm conditions, such as those of 1998 (e.g. Smith et al., 2001b), is consistent with that observed for other components of the cryosphere (Atkinson et al., 2006).
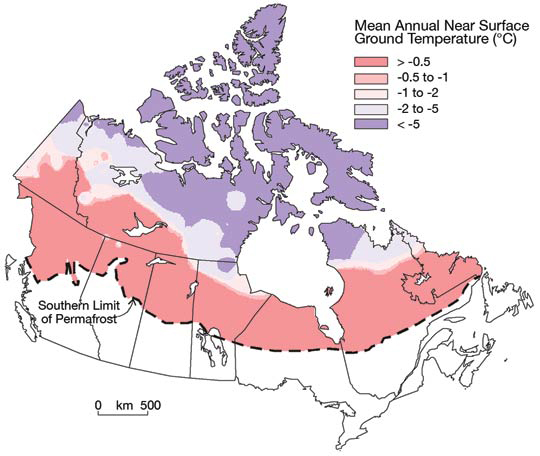
FIGURE 12. Variation in mean annual near surface ground temperature for the Canadian permafrost zone (Smith and Burgess, 2004).<
Figure 12 - Text Version
Map of Canada depicting mean annual near surface ground temperature for the Canadian permafrost zone in °C. Colour coding begins north of the southern limit of permafrost which is approximately midway through the provinces. Most of the provinces fall within the >-0.5 while the progression to -2 to -5 occurs quickly with very limited areas of -0.5 to -1 and -1 to -2 ground temperatures. The Canadian Arctic, that is the northern mainland areas along with the islands have <-5 mean annual near surface ground temperatures.
Approximately half of the area underlain by permafrost in Canada contains permafrost warmer than –2°C that could ultimately disappear under projected climate warming (Smith and Burgess, 2004; Figure 12). Where permafrost is thicker and colder, thickening of the active layer and warming and thinning of permafrost will likely occur. Projections of increases in the active-layer depth range from 0% to more than 50% during the next 50 years (Walsh et al., 2005). The largest percentage increases in Canada are projected for the Yukon. Degradation of continuous permafrost to discontinuous permafrost, and disappearance of discontinuous permafrost, are projected to occur at the southern boundaries of these permafrost zones. Thawing of permafrost has the potential to release large pools of carbon, which can act as feedback to the climate system (e.g. Tarnocai, 2006; Callaghan et al., 2005; Zimov et al., 2006).
Thaw sensitivity and settlement of permafrost have important implications for landscape stability and the performance of any overlying infrastructure. National-scale mapping by Smith and Burgess (2004; Figure 13) demonstrated that thaw sensitivity is moderate to high in about 50% of the present permafrost zones (excluding areas where massive ice is present and where thaw sensitivity may be higher than indicated). Regions where frozen soils are thaw sensitive include the silty clay and organic terrain in the Mackenzie region and the peatlands of the northern Prairies and Hudson Bay Lowlands.
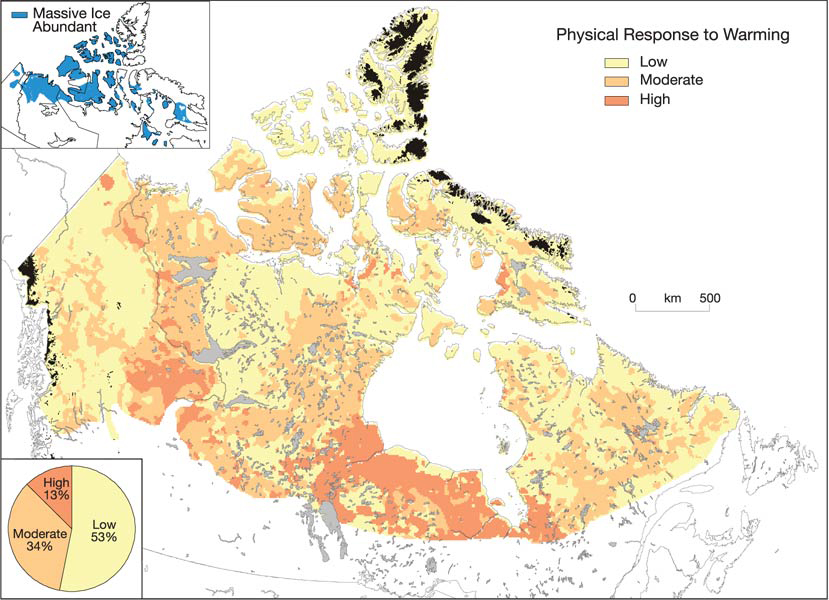
FIGURE 13. The relative physical response (thaw sensitivity) of permafrost to climate warming (Smith and Burgess, 2004).
Figure 13 - Text Version
Map of Northern Canada colour coded to depict relative physical responses to warming, defining them as low, moderate or high. The highest response to warming occurs in Northern Ontario and Manitoba, whereas moderate and low responses are integrated throughout remaining areas of northern Canada. A pie chart depicts percentages of each level of physical response to warming with 13% high, 34% moderate and 53% low. A small map of massive ice abundant areas, primarily in the Northern Northwest Territories and Nunavut accompanies the Physical Response Map.
Frozen ground plays an important role in northern hydrology through its influence on infiltration, runoff and groundwater storage and flow. The implications of climate-induced changes in permafrost for northern hydrology have been summarized by Woo et al. (1992), Michel and van Everdingen (1994), Brown et al. (2004), Mackenzie River Basin Board (2004) and Smith and Burgess (2004). Active-layer thickening and permafrost degradation in response to climate warming can lead to increased infiltration, greater groundwater storage, lower spring runoff and increase in base flow (Woo et al., 1992). As a result, groundwater will play a greater role in future streamflow, with implications for surface-water quality (Michel and van Everdingen, 1994). As ground ice thaws, differential settlement and ponding may occur, leading to changes in drainage and the distribution of surface water. Thawing of ice-rich permafrost may also cause some lakes and wetlands to drain, leading to loss of fish and wildlife habitat (Labrecque and Duguay, 2001; Marsh and Neumann, 2001).
3.5 RIVER AND LAKE ICE
Freshwater ice is responsible for the timing and severity of many hydrological extremes in northern systems, such as low flows and floods that are experienced during freeze-up and break-up periods (e.g. Beltaos and Prowse, 2001; Prowse and Carter, 2002). River ice is also a major factor in river ecology (Prowse and Culp, 2003), particularly in the Mackenzie Delta (Marsh and Lesack, 1996).
From 1846 to 1995, freeze-up and break-up trends for lakes and rivers in the Northern Hemisphere, including a long-term site on the Mackenzie River, show an average delay of 5.8 days per century in freeze-up dates and an average advance of 6.3 days per century in break-up dates (Magnuson et al., 2000). Canadian data for the period 1947 –1996 show that western sites have a predominant trend towards earlier break-up dates, and that there has been a nationwide trend towards earlier freeze-up dates (Zhang et al., 2001a). Break-up –freeze-up trends are complex, however, and depend on the interval considered, but generally reflect trends in fall and spring air temperatures (e.g., Lacroix et al., 2005; Duguay et al., 2006).
Prowse and Beltaos (2002) outlined the complexities of freshwater-ice responses to changing climate. Although changes are difficult to predict (Bonsal and Prowse, 2003), future warming will likely lead to a shortened ice season and thinner lake- and river-ice covers, and cover composition (i.e. proportion of white ice) might be altered by increases in winter snowfall. Changes in winter snowfall will be a major factor in determining whether the severity of river-ice events, such as ice-jam flooding, increase or decrease (Walsh et al., 2005).
3.6 FRESHWATER DISCHARGE
Rivers flowing into the Arctic Ocean have low winter runoff, high spring flow rates (driven by snowmelt) and rain-induced floods in the summer and autumn. Snowmelt accounts for most of the flow in high-Arctic rivers and streams (Woo, 1990). Flow of large rivers, such as the Mackenzie, is strongly influenced by the hydrological regimes in their non-Arctic southern headwaters (Prowse et al., 2006).
Observed trends in river discharge vary regionally, with studies documenting both increases and decreases in flow since the 1960s. From 1964 to 2003, the total annual river discharge for 64 rivers draining into the Labrador Sea, Hudson Bay, Arctic Ocean and Bering Strait decreased by 10% (Dery et al., 2005). Between 1967 and 1996, Zhang et al. (2001a) found a trend towards increasing streamflow discharge for Chesterfield Inlet, whereas rivers in northern Ontario and Quebec showed a decrease in discharge. No significant trend was found in discharge from the Yukon River for the period 1964 –2000 (McClelland et al., 2006).
Future projections, based on model scenarios for 2050, suggest increases in discharge. For example, Arnell (1999) concluded that annual discharge could increase between 12 and 20% relative to the 1961 –1990 baseline for the Mackenzie River, and between 20 and 30% for the Yukon River. Broadly speaking, projections of future climate suggest that total annual discharge to the Arctic Ocean from Arctic land areas could increase between 10 and 20% by about 2050, with winter discharge likely to increase between 50 and 80%. It is also expected that 55 to 60% of annual discharge will enter the Arctic Ocean between April and July (peak runoff season; Arnell, 1999; Arora and Boer, 2001).
3.7 SEA-LEVEL RISE AND COASTAL STABILITY
Climate change will lead to rising sea levels in the Arctic Ocean (Proshutinsky et al., 2001) and other northern seas. Climate warming affects global sea level through ocean thermal expansion and additional water transfers to the ocean basins from melting glaciers and ice sheets. The Fourth Assessment Report of the Intergovernmental Panel on Climate Change (2007a) has projected a rise in global mean sea level (MSL) of between 0.18 and 0.59 m by 2100 (2090 –2099 MSL relative to 1980–1999 MSL). The rise in sea level will not be uniform throughout the globe and some areas, including parts of the Arctic, may be subject to more rapid rates. In addition, the relative sea-level change along any coast (the trend measured by a tide gauge) is a combination of sea-level change and any vertical motion of the land surface. Vertical motion in the Arctic is dominated by ongoing postglacial isostatic rebound, with uplift in some places being as high as about 1 m per century. Other areas around the margins of the former ice sheets (the Beaufort Sea coast, the western margin of the Canadian Arctic Archipelago and a narrow band on eastern Devon Island and the east coast of Baffin Island) are subsiding (Forbes et al., 2004).
Sea-level rise increases the risk of flooding and erosion on Arctic coasts and may exacerbate other coastal hazards, such as ice ride-up and pile-up. In the western Arctic, sea-level rise and coastal erosion threaten cultural heritage sites (e.g. former habitations and burial sites) on the Yukon coast (e.g. Herschel Island), seasonal settlements (e.g. Shingle Point, YT) and coastal communities (e.g. Tuktoyaktuk, NT; e.g. Colette, 2007). Coastal erosion is a concern at other communities in the western Arctic, including Sachs Harbour and, to a lesser extent, Ulukhaktok, NT (Manson et al., 2005), while high water levels have been noted as an issue in Cambridge Bay, NU (Shirley, 2006). In the eastern Arctic, high-water and erosion concerns have been noted at Hall Beach, Iqaluit, Pond Inlet and Arctic Bay, NU, prompting discussions about adaptation options (Shirley, 2006; Ford et al., 2006a; Bhabesh Roy, Regional Engineer, Government of Nunavut, pers. comm., March 14, 2007). With the exception of Hall Beach, the affected communities are in areas of nearly stable or subsiding crust, where sea-level rise may overwhelm residual uplift or add to the rate of subsidence. Reduced sea ice, more open water and more energetic waves may be important in a number of places, including Hall Beach, where postglacial uplift and coastal emergence are ongoing.
The most severe flooding risks in low-lying communities, such as Tuktoyaktuk, are associated with large storm surges, which may reach more than 2 m above MSL (Manson et al., 2005). Storm waves during severe surges can cause rapid coastal retreat of 10 m or more in a single event. Sea-level rise will increase the upper limit of potential storm-surge flooding, and also increase the frequency of flooding at lower levels. Storm frequency in the Canadian Arctic shows no clear trends during the past 50 years (Atkinson, 2005). Erosion rates may be accentuated by warmer ground temperatures, deeper summer thaw and volume loss on melting of excess and massive ground ice where exposed in coastal cliffs (Forbes, 2005). Despite some suggestions of increased erosion rates in the western Arctic, including the Yukon and Alaska coast, a regional analysis for the southern Beaufort Sea detected no significant trend in areas of rapid erosion for the 1972 –2000 time interval (Solomon, 2005). However, further warming, combined with sea-level rise and reduced sea ice, can be expected to maintain or increase the already rapid rates of coastal retreat along this coast.
3.8 TERRESTRIAL VEGETATION ZONES AND BIODIVERSITY
The extreme temperature gradients of the Arctic mean that plant communities will likely show a quick and strong response to temperature change. For currently widespread grass, sedge and flowering species, such as Carex bigelowii/arctisibirica, C. stans, Dryas octopetala/punctata, Cassiope tetragonal and the moss Tomentypnum nitens, continued temperature increase will result in higher productivity and abundance, and an expansion in range to the north. Other species found exclusively (hyperarctic; e.g. grasses — Poa abbreviate) or primarily (euarctic; e.g. polar willow — Salix polaris) at high northern latitudes, on the other hand, will likely respond to climate warming with a narrowing of their ecological niche (Callaghan et al., 2005).
Latitude and light regimes currently limit the distribution of some plant species, so these will not be able to migrate northward in response to increasing temperatures. Other important factors to be considered when projecting a whole-system response to climate change include: 1) the importance of carbon-nutrient interactions; 2) the interactions of carbon and nutrient cycles with temperature, water and snow cover; 3) the magnitude of dissolved organic and inorganic carbon losses in soil water; and 4) the magnitude and role of wintertime processes. The cumulative impacts of climate change on these factors will likely result in new communities, with different structures and species composition (Callaghan et al., 2005).
Vegetation-model projections for the present century indicate that, depending on location, the boreal forest will displace between 11 and 50% of all Arctic tundra (Harding et al., 2002; Skre et al., 2002). However, recent observations of the latitudinal treeline show a southward displacement, suggesting that a northward displacement, projected on the basis of changing climatic conditions alone, is unlikely (Callaghan et al., 2005). Increased disturbances, such as pest outbreaks and fire, will locally affect the direction of treeline response. In general, the treeline will show many different responses depending on the magnitude of temperature change, as well as changes in precipitation, permafrost conditions, forest composition and land use.
3.9 FRESHWATER ECOSYSTEMS
Climate change will affect the structure and function of Arctic freshwater ecosystems. Community and ecosystem attributes, including species richness, biodiversity, range and distribution, will be affected by changes in physical and chemical environmental parameters, and will consequently affect food-web structures and production levels (Rouse et al., 1997; Vincent and Hobbie, 2000; Poff et al., 2002; Wrona et al., 2006a).
The northern freshwater fish fauna of Canada consist of approximately 35 species, with another 15 anadromous species present (Richardson et al., 2001; Evans et al., 2002; Coad and Reist, 2004; Reist et al., 2006b). Relative to the South, low biological productivity is pervasive in aquatic ecosystems of the North, which is partly a result of low energy inputs. General knowledge of the biology of aquatic biota is low, particularly with respect to understanding potential connections with climate drivers and ecosystem structural and functional responses (Wrona et al., 2006a). Although large uncertainties remain in projecting species- and system-specific responses, it is likely that locally adapted Arctic species will disappear from certain areas when environmental conditions begin to exceed their physiological tolerances and/or ecological optima. The most vulnerable species are those with limited climatic ranges. Extinctions of Arctic species across their entire range are not expected, although some species will be marginalized geographically and/or ecologically (Wrona et al., 2006b).
Changing climate will also result in alterations to the geographic ranges of freshwater species due to loss of optimal habitat for ‘native’ Arctic species and the northward expansion of more southerly species (Wrona et al., 2006b). Ecological observations by trappers on the Peace-Athabasca Delta of the Mackenzie River system indicate that muskrat abundance is likely to increase in high-latitude lakes, ponds and wetlands due to the expected increases in the abundance of aquatic vegetation (Thorpe, 1986). Projected impacts and changes among marine species are discussed in Section 4.8.
Page details
- Date modified: