
Regional Climate and Socioeconomic Characteristics
2.1 DEMOGRAPHICS
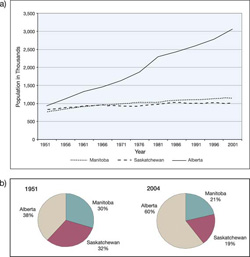
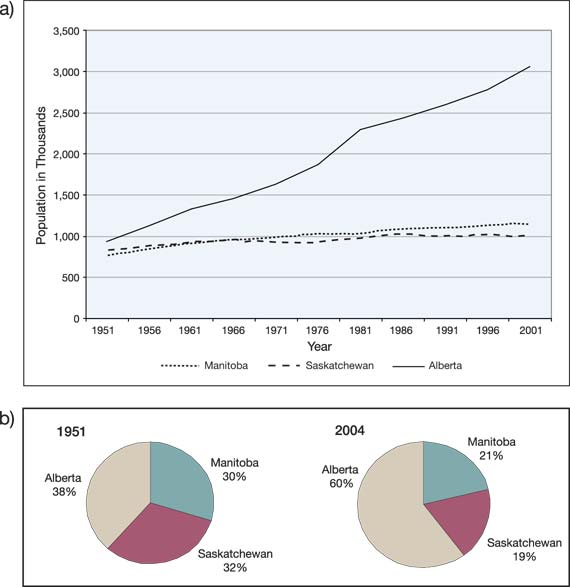
This demographic profile of the Prairies was assembled from reports by Statistics Canada (2001a, 2005a, b, d –g) and the Canada West Foundation (Azmier, 2002; Hirsch, 2005a, b). The number of people in the Prairies has doubled during the past 50 years to more than 5 million. Population growth, however, is not shared equally among the provinces (Figure 6). Alberta now has slightly less than two-thirds of the population of the region, compared to slightly more than a third in 1951 (Figure 6). Alberta ’s population is the youngest of the three provinces and it has the largest working-age population (aged 20 –64), at 61.4% of its total population. A decline in Saskatchewan’s population has resulted from net interprovincial out-migration exceeding the small increases through natural population growth and net international immigration, whereas Alberta has experienced increases in all three population growth components (Table 5). In all three provinces, urban populations dominate, making up 64.3 % (Saskatchewan) to 80.9% (Alberta) of the total population (Table 6). In 2001, Alberta had the largest Aboriginal population (168 000); at 5.5%, however, Aboriginal people represented a smaller proportion of the general population than in Manitoba and Saskatchewan, where 14% of the residents are of Aboriginal ancestry.
| Total change (in thousands; three-year totals) | |||||
|---|---|---|---|---|---|
| Province | Natural growth | Net international migration | Net interprovincial migration | Total | Average annual increase (%) |
| Manitoba | 11.7 | 16.6 | -9.3 | 19.0 | 0.5% |
| Saskatchewan | 8.7 | 3.4 | -16.9 | -4.7 | -0.2% |
| Alberta | 59.6 | 36.5 | 49.0 | 145.2 | 1.6% |
| Province | Rural | Urban |
|---|---|---|
| Alberta | 19.1% | 80.9% |
| Manitoba | 28.1% | 71.9% |
| Saskatchewan | 35.7% | 64.3% |
2.2 ECONOMIC ACTIVITIES AND EMPLOYMENT
In 2004, the Prairies contributed $202 billion in value-added activities to the Canadian gross domestic product (GDP). Alberta had the highest per capita GDP at $41 952 in 2004, with lower values in Saskatchewan ($33 282) and Manitoba ($30 054). The per capita average for all of Canada in 2004 was $40 386.
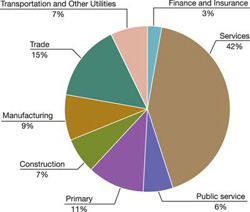
Primary resource sectors are the largest contributors to GDP in the region, with about 25% of the total value added (Table 7). These data are for 2001, a drought year for much of Alberta and Saskatchewan, when contributions from agriculture were lower than normal. The Prairies share dependence on primary resource production, specifically agriculture, forestry and mining, and have relatively small manufacturing sectors compared to the rest of Canada, although the nature of primary production differs among the three provinces (see Table 7). Service industries are the largest source of employment in the region and a major growth sector. Next are trade industries, contributing around 15% of total employment, whereas the primary resources sector represents only 11% of employment (Figure 7). These primary resource industries, particularly agriculture, were the major employer in the past, but technological change has lowered the demand for labour.
| Percentage of total gross domestic product | ||||
|---|---|---|---|---|
| Industry | Manitoba | Saskatchewan | Alberta | Prairies |
| Crop and animal production | 3.5 | 3.9 | 1.4 | 2.1 |
| Mining | 1.8 | 17.9 | 26.5 | 21.5 |
| Other primary goods-producing industries | 0.3 | 0.4 | 0.2 | 0.3 |
| Manufacturing | 13.6 | 7.9 | 9.1 | 9.6 |
| Construction | 4.6 | 5.9 | 7.5 | 6.8 |
| Trade | 12.0 | 10.7 | 8.8 | 9.5 |
| Utilities | 14.1 | 11.2 | 9.2 | 10.0 |
| Public administration | 18.8 | 17.4 | 10.2 | 12.6 |
| Other services | 31.3 | 24.7 | 27.1 | 27.4 |
| Total | 100.0 | 100.0 | 100.0 | 100.0 |
Manitoba has shown continued growth in population and employment in a diversified economy. In 2000, manufacturing accounted for almost half of the GDP from all goods-producing industries. Manitoba real GDP grew by 2.9% in 2005, equal to that of Canada and the strongest since 2000. Saskatchewan’s economy has shown promising signs of diversification, despite a continued dominance of farming and resources (Hirsch, 2005a). Manufacturing shipments have increased by 55% during the last decade. The economy is export oriented, with exports including crude petroleum oil, potassium chloride, spring and durum wheat, and canola. Alberta ’s economy has been booming during the past decade, sparked by high prices for oil and natural gas (Hirsch, 2005b). Other growing sectors of the Alberta economy include manufacturing, construction, services and public finance.
2.3 ECONOMIC AND SOCIAL TRENDS AND PROJECTIONS
Recent regional climate change assessments elsewhere in the world (e.g. Holman et al., 2005a, b; Schr öter et al., 2005) have shown that socioeconomic scenarios can often be more important than climate scenarios in impact assessments, particularly in determining economic impacts and adaptive capacity. However, predicting economic and social trends is problematic for a region that is as dependent on export markets and as heterogeneous as the Prairies.
Population projections are available for the region (Azmier, 2002; Sauvé, 2003; Statistics Canada, 2005e, f, g). By 2031, the population of the Prairies could be as high as 7 million, an increase of almost 30%. This projected growth ranges from less than 3% in Saskatchewan to almost 40% in Alberta (Table 8). Aboriginals, visible minorities and seniors are at the core of the demographic changes expected in the coming decades (Statistics Canada, 2005e, g).
| 2031 Population (Thousands) | |||||||
|---|---|---|---|---|---|---|---|
| Province/ region |
2005 population (Thousands) |
Low Growth |
Medium Growth (Recent migration) |
Medium Growth (Medium migration) |
Medium Growth (West coast migration) |
Medium Growth (Central- west migration) |
High Growth |
| Manitoba | 1 178 | 1 259 | 1 375 | 1 356 | 1 335 | 1 378 | 1 447 |
| Saskatchewan | 994 | 937 | 967 | 976 | 981 | 1 064 | 1 023 |
| Alberta | 3 257 | 3 925 | 4 391 | 4 145 | 3 892 | 4 543 | 4 403 |
| Prairies | 5 429 | 6 121 | 6 733 | 6 477 | 6 208 | 6 985 | 6 873 |
| Canada | 32 271 | 36 261 | 39 045 | 39 029 | 39 015 | 39 052 | 41 811 |
| Prairies as a percentage of Canada | 17% | 17% | 17% | 17% | 16% | 18% | 16% |
Alberta, with its booming energy-based economy, is where most of the population increase for the region has occurred during the past 50 years (as evident in Figure 6), and this trend is likely to continue for the next 30 years (based on the data presented in Table 8). Manitoba and Saskatchewan will face the challenges associated with growth of the major cities at the expense of the rural population. In Manitoba, urban population growth will come mainly from immigration (Azmier, 2002); for Saskatchewan, it will come mostly from a rise in the Aboriginal population. A developing trend is worker shortages (Sauvé, 2003), which might be alleviated somewhat with immigration. Change in the Prairie economy over the last few decades has been driven by advances in oil sands recovery techniques, improved forest management and productivity, growth in the film industry, increased agricultural productivity, widespread adoption of computer technology, consolidation of warehousing and industrial production, and increased tourism (Roach, 2005).
These trends and projections suggest potential for differing levels of vulnerability in the various Prairie provinces. Population and wealth are expected to continue to be concentrated in Alberta, leaving the other provinces with relatively fewer resources to address adaptation needs. Differential impacts of climate change among regions and sectors will interact with uneven economic growth, causing population shifts and putting more strain on the socioeconomic fabric of the region. The migration from rural to urban areas undermines the viability of rural communities, which have more limited resources than cities to address climate change and are also more dependent on climate-sensitive resources, such as agriculture and forestry.
2.4 PAST CLIMATE
Most weather records in the Prairies are less than 110 years in length. A longer perspective from geological and biological archives provides information on low-frequency (decades or longer) variability, gradual responses to climate forcing and a larger range of climate variability than is contained in the instrumental climate record, and can potentially provide historical analogues of future climate. In the Prairies, variations in climate are reflected in the shifting of vegetation, fluctuations in the level and salinity of lakes, patterns in tree rings, and the age and history of sand dunes (Lemmen and Vance, 1999). Temperatures inferred from boreholes on the Canadian Plains (Majorowicz et al., 2002) and from tree rings at high elevations in the Rocky Mountains (Luckman and Wilson, 2005) show that the warmest climate of the past millennium was during the twentieth century.
Soil moisture inferred from tree rings, and lake salinity inferred from diatoms, indicate that the climate of the twentieth century was relatively favourable for the settlement of the Prairies, as it lacked the sustained droughts of preceding centuries that affected sand dune activity, the fur trade and the health of Aboriginal people (Sauchyn et al., 2002a, 2003). The short duration of drought since the 1940s may be more linked to multi-decadal climate variability than to climate change, which is expected to cause increased aridity and more frequent drought (Wetherald and Manabe, 1999; Kharin and Zwiers, 2000). High-resolution lake sediment records reveal multi-centennial shifts in moisture regime (Michels et al., 2007), and tree rings suggest repeated multi-decadal wet and dry cycles (St. George and Sauchyn, 2006; Watson and Luckman, 2006) across the region. These natural cycles will underlie the trend of climate change. Tree-ring and archival records from Manitoba (Blair and Rannie, 1994; St. George and Nielsen, 2003; Rannie 2006) have highlighted the recurrence of wet years and flooding, and point to a contrast in climate between the western and eastern Prairies.
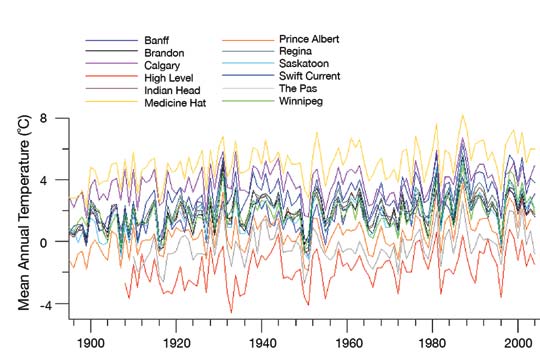
During the period of instrumental record, there was an average increase in temperature of 1.6 °C for 12 stations on the Prairies, most with data since 1895 (Figure 1). Spring shows the greatest warming, a trend that extends from Manitoba to northern British Columbia (Zhang et al., 2000). More extensive regional warming has been experienced over the past 50 years, with significant trends in January, March, April and June (Gan, 1998). Precipitation data indicate a generally declining trend during the months of November to February, with 30% of the monthly data from 37 stations showing a significant decrease during the period 1949 –1989 (Gan, 1998). Only one of the 37 stations showed a significant positive trend (Gan, 1998). Although the number of days with precipitation has increased on the Canadian Prairies during the last 75 years (Akinremi et al., 1999), more than half of those precipitation days had total amounts of less than 5 mm.
2.5 SCENARIOS OF FUTURE CLIMATE
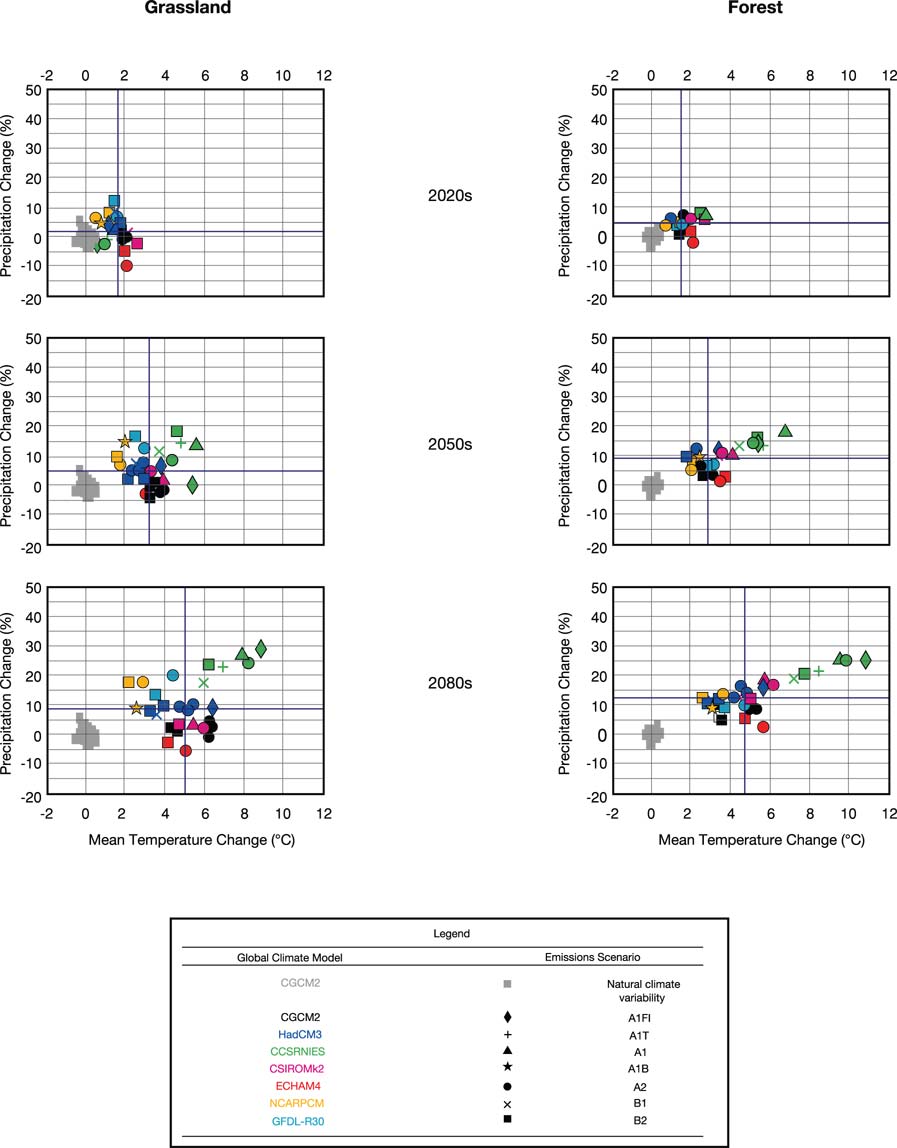
Climate scenarios were derived from climate change experiments based on seven global climate models (GCMs) and the Intergovernmental Panel on Climate Change Special Report on Emissions Scenarios. Maps and scatterplots illustrate the scenarios of projected climate change from 1961 –1990 to the 2020s (2010–2039), 2050s (2040–2069) and 2080s (2070–2099).
Scatterplots
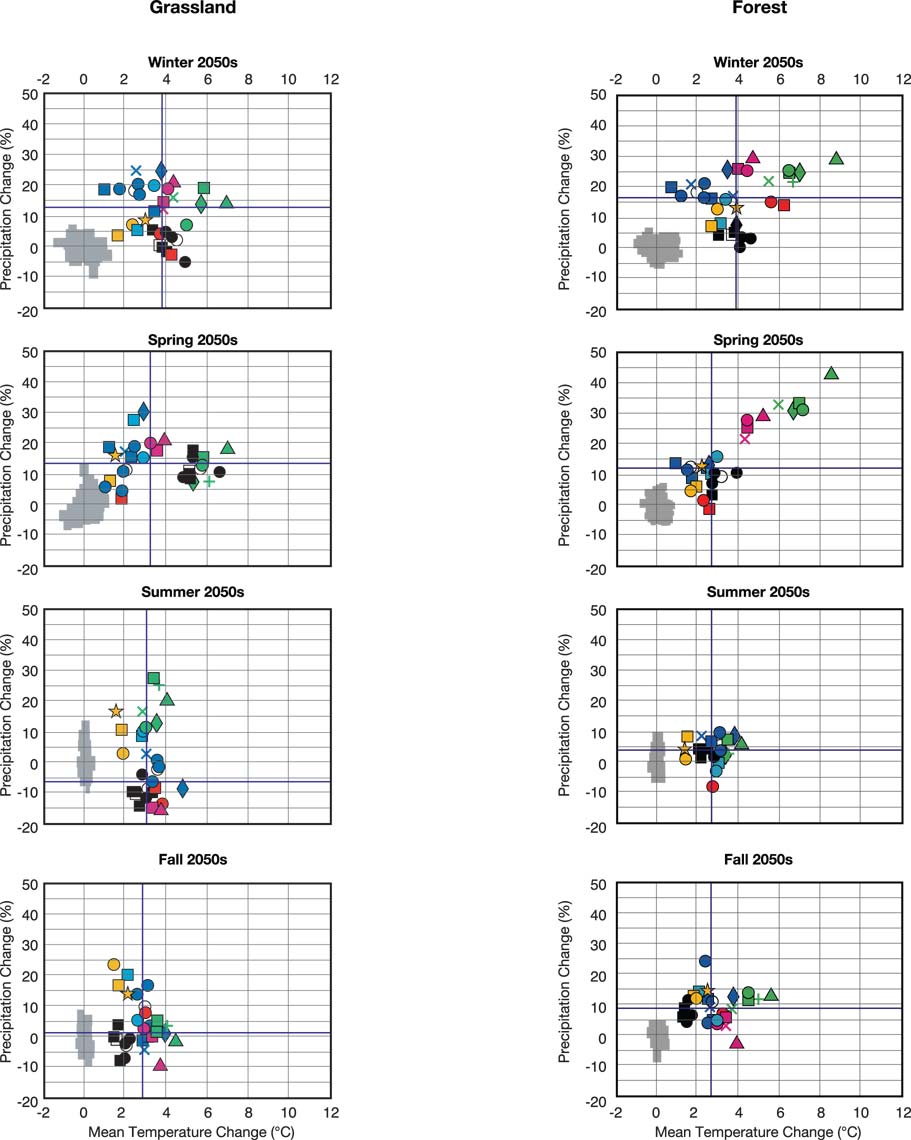
Scatterplots (see Appendix 1 of Chapter 2) for the Prairies present change fields averaged over two regions, the southern grassland zone and the northern forest zone. The scatterplots show the modelled changes in mean annual (Figure 8a) and mean seasonal (Figure 8b) temperature and precipitation for the forest and grassland regions for the 2020s, 2050s and 2080s.
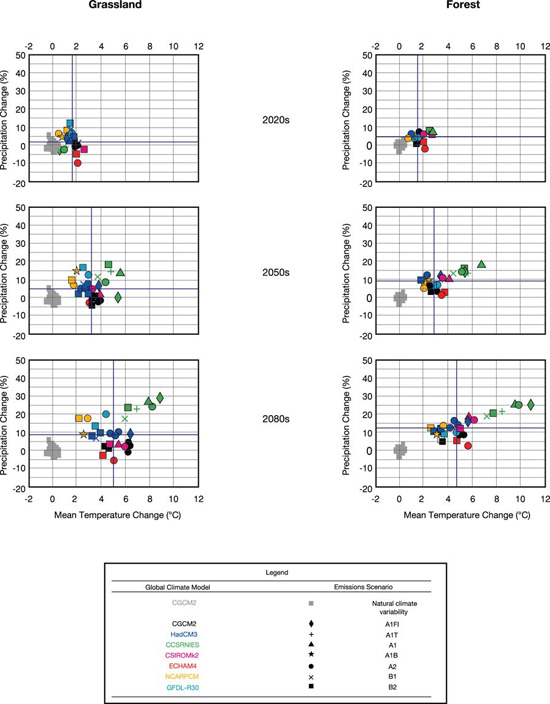
FIGURE 8a: Scatterplots of projected changes for the forest and grassland regions of the Prairies for the 2020s, 2050s and 2080s in mean annual temperature and precipitation. The grey squares indicate the 'natural' climate variability simulated by a long control run of the Canadian Coupled GlobalClimate Model 2 (CGCM2), in which there is no change in forcing over time. Blue lines represent median changes in mean temperature and precipitation derived from suite of scenarios on plot.
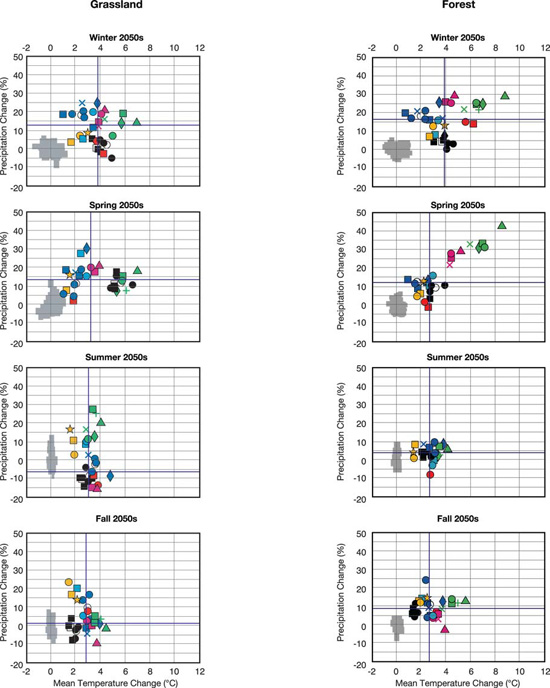
With the exception of a few scenarios for the 2020s, all models forecast climates that lie outside the range of natural variability. Temperature scenarios are similar for the forest and grassland regions, but increases in precipitation are larger for the northern forest. The scatter of data increases over time, reflecting the greater uncertainly in the modelling of climate change later in the twenty-first century. Much of the projected increase in temperature and precipitation will occur in winter and spring for both forest and grassland regions.
Scenario Maps
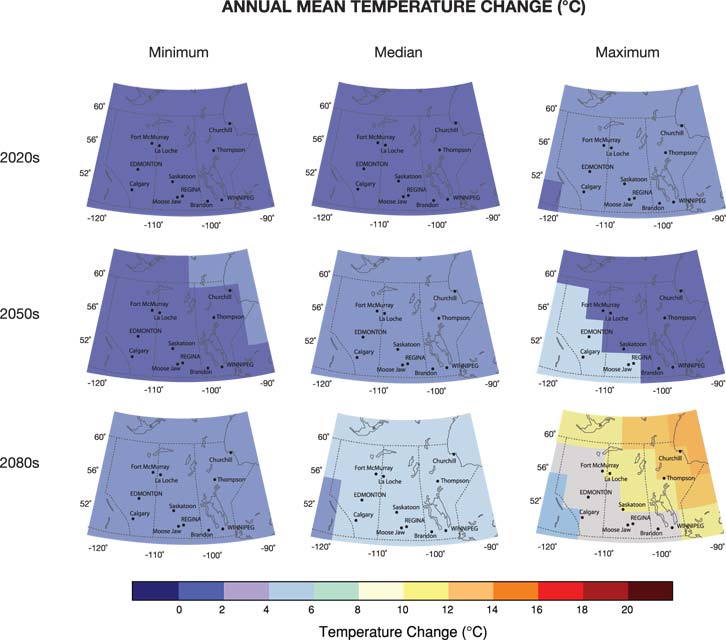
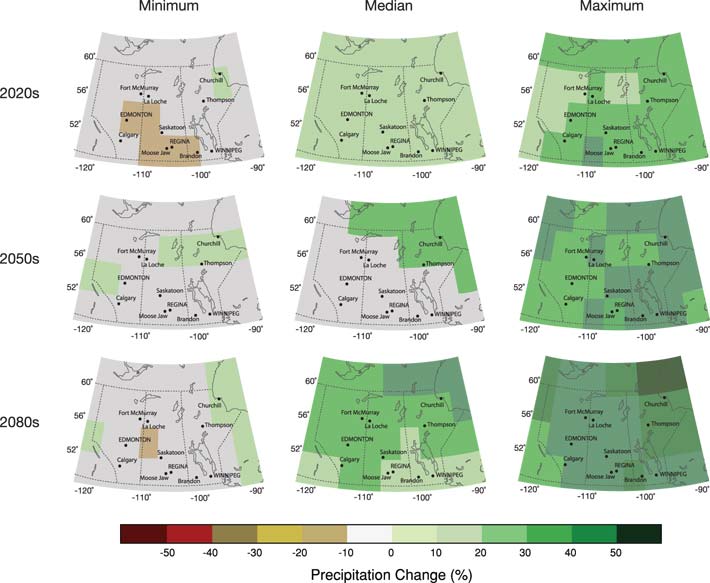
The scenario maps present a geographic summary of the GCM-derived climate changes illustrated on the scatterplots (see Appendix 1 of Chapter 2). The minimum, median and maximum projections of changes in temperature and precipitation have been plotted using the Canadian Coupled Global Climate Model 2 (CGCM2) grid. Temperature scenarios are mapped for the 2020s, 2050s and 2080s in Figure 9a and by season for the 2050s in Figure 10a, while corresponding precipitation scenarios are shown in Figures 9b and 10b. Besides illustrating the extreme scenarios and seasonal contrasts, the maps show that greatest warming is projected to occur in the north and east. These regions are also projected to have the largest increases in precipitation, with smaller increases, and even decreased precipitation in summer for the worst-case (minimum) scenarios, to the west and south.

FIGURE 9a: Climate change scenario maps for the Prairies in the 2020s, 2050s and 2080s, showing minimum, median and maximum projections of changes in mean seasonal temperatures.
Larger image
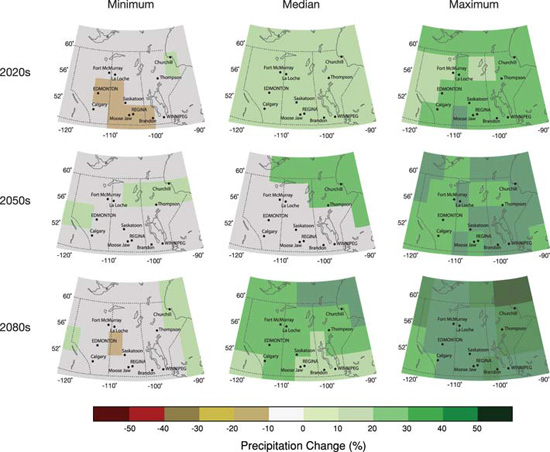
FIGURE 9b: Climate change scenario maps for the Prairies in the 2050s, showing minimum, median and maximum projections of changes in mean annual precipitation. Note that maximum and minimum changes for precipitation refer to wettest and driest scenarios, respectively (see Appendix 1 of Chapter 2).
Larger image

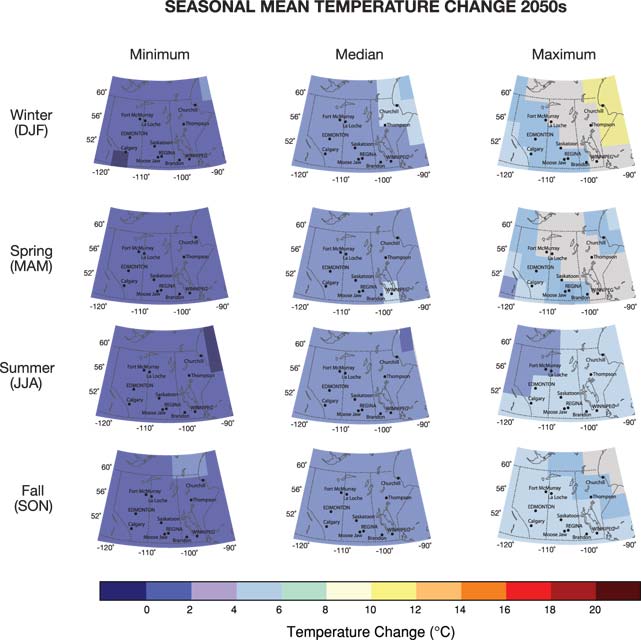
FIGURE 10a: Climate change scenario maps for the Prairies in the 2050s, showing minimum, median and maximum projections of changes in a) mean seasonal temperatures.
Larger image

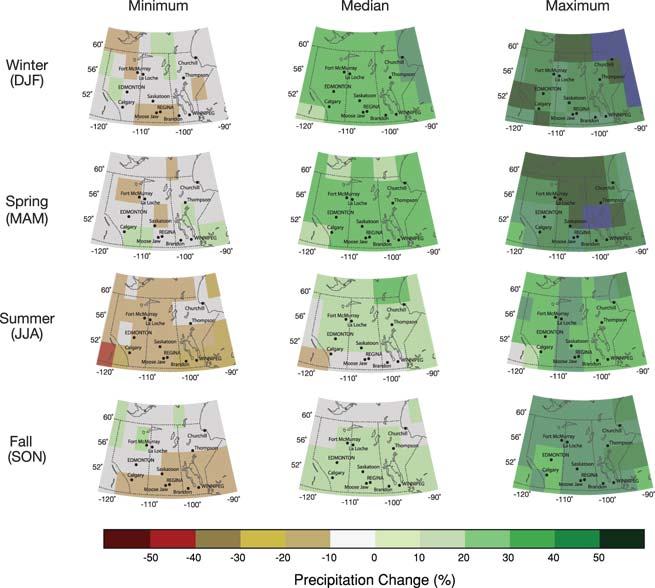
FIGURE 10b: Climate change scenario maps for the Prairies in the 2050s, showing minimum, median and maximum projections of changes in b) mean seasonal precipitation. Upper-case letters in parentheses after each season represent the months in that season. Note that maximum and minimum changes for precipitation refer to wettest and driest scenarios, respectively (see Appendix 1 of Chapter 2).
Larger image
Page details
- Date modified: