
How is the forest sector changing?

Canada’s forest sector is changing in ways likely never conceived when economist Harold Innis described the Canadian economy as dependent on resource production when he said we were, “…hewers of wood and drawers of water.” Resource production continues to this day, and yet so much has changed and continues to change into a circular bioeconomy.
The circular forest bioeconomy designs out the notion of waste. Under this approach, trees are harvested based on sustainable forest management principles, and all parts of a tree are used. For example, logs may be used to produce lumber; by-products of lumber production and harvest residuals (e.g., tree tops, branches, etc.) are directed to making other products.
Canadians remain hewers of wood but are also now creators of innovative solutions and shapers of advanced products. Adaptation is key to ensure strong industry performance that contributes to a sustainable economy. The marketplace has shifted in recent years toward the use of advanced wood products and other circular bioproducts. The forest sector is meeting high demand for lumber and engineered wood building systems. It is also using wood waste, called residuals, to increase the development of biochemicals that can be used to produce bio-based pharmaceuticals, compostable bioplastics and industrial chemicals. When higher value uses are not an option, residuals are converted into bioenergy (including for bioheat and biofuels), which are important for Canada’s path to net zero emissions by 2050.
Key sustainability indicators
Explore the report to find information on the key sustainability indicators:
- Forest sector financial performance: Annual financial performance of Canada’s forest sector. Monitoring the financial performance of the forest sector indicates whether Canada’s forest sector can attract investment and continue generating economic benefits for Canadians.
- Forest sector secondary manufacturing: Annual gross domestic product (GDP) for primary and secondary wood and paper product subsectors. This indicator provides information on additional employment and revenue for the forest sector, providing a better idea of the forest sector’s overall contribution to the Canadian economy.
- Forest sector carbon emissions: Annual trends in fossil fuel greenhouse gas (GHG) emissions and total energy use. Monitoring emissions and energy use provides data on how the forest sector can become more sustainable and provide climate solutions.
Download the report
(PDF, 17.8 MB)
Forest sector financial performance
Key information
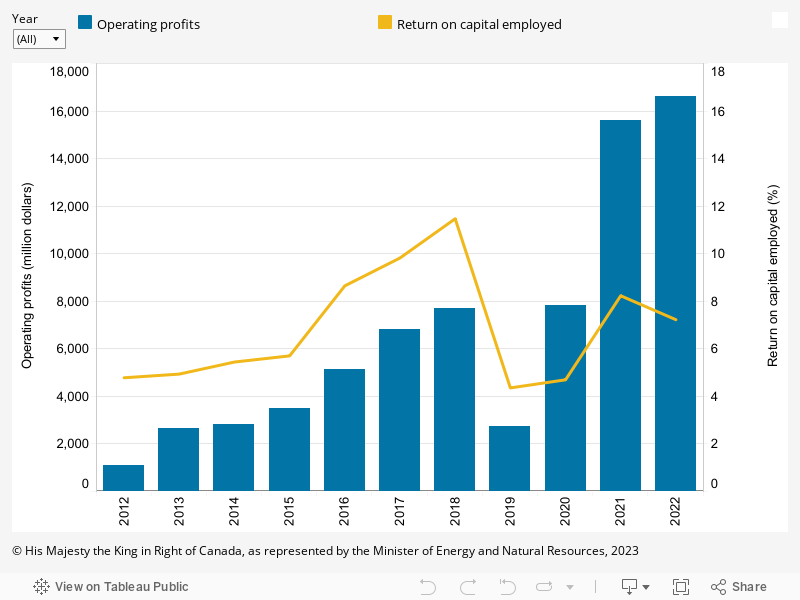
Both operating profits and the return on capital employed indicate the economic competitiveness of the forest sector. Operating profit measures the difference between operating revenues and operating expenses. Return on capital employed measures the efficiency of capital in the sector.
Financial performance in the forest sector remained at a record high in 2022 despite emerging challenges. In 2022, operating profits increased 6% from 2021, more than double the 2018 pre-pandemic record high. The forest sector is a capital-intensive industry and generated a return on capital employed of 7.2% in 2022. This was slightly lower than last year (-1%), but high enough that capital resources continued to generate strong economic value.
- Commodity panel and lumber prices fell from their 2021 peaks but remained above pre-pandemic averages over most of the year, while pulp prices surged to record highs (albeit temporarily), helping companies generate strong profits in 2022.
- High prices compensated for rising operating and investment costs resulting from inflation, increasing interest rates and supply chain disruptions, as well as labour and fibre shortages, allowing firms to keep generating a good return on their investments.
Why is this indicator important?
- Strong financial performance is essential for the continued economic competitiveness of Canada’s forest sector.
- Both operating profits and return on capital employed are indicative of the ability of the forest sector to attract investment and generate economic benefits for Canadians.
Financial performance by Canada’s forest sector, 2012–2022
Graph summary
The operating profits and return on capital employed in the forest sector for each year between 2012 and 2022.
Graph data
Financial performance by Canada’s forest sector, 2012–2022
| Year | Operating profits (million dollars) | Return on capital employed (%) |
|---|---|---|
| 2012 | 1,082 | 4.8 |
| 2013 | 2,633 | 4.9 |
| 2014 | 2,811 | 5.4 |
| 2015 | 3,508 | 5.7 |
| 2016 | 5,121 | 8.6 |
| 2017 | 6,816 | 9.8 |
| 2018 | 7,698 | 11.5 |
| 2019 | 2,743 | 4.4 |
| 2020 | 7,834 | 4.7 |
| 2021 | 15,616 | 8.2 |
| 2022 | 16,605 | 7.2 |
Forest sector secondary manufacturing
Key information
Secondary wood and paper product manufacturing is the further processing of primary mill lumber and bulk pulp and paper products into hundreds of intermediate and final products, from furniture and sheds to cardboard boxes and tissue paper.
The industry GDP shows its contribution to the Canadian economy. It measures the value that the industry adds in terms of employee compensation, operating surplus, plus taxes, less subsidies.
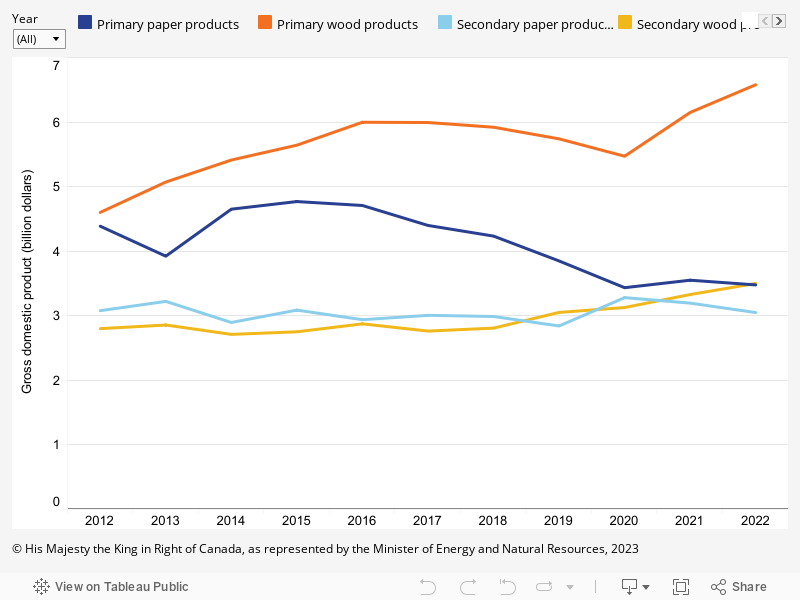
The secondary wood and paper product manufacturing industries in Canada generated $6.55 billion in real gross domestic product (GDP) in 2022. Growth in real GDP decelerated, edging up 0.4% over 2021. However, real GDP from forest sector secondary manufacturing has grown 11.4% since 2012.
- Secondary wood manufacturing real GDP increased 5.2% over 2021 levels, while secondary paper manufacturing real GDP decreased 4.6% below 2021 levels.
- Secondary wood manufacturing was supported by strong domestic and export sales. The continuous decrease in secondary paper manufacturing real GDP was largely due to the growth of competing imports and diminishing pandemic-induced demand for hygiene products and packaging products.
Why is this indicator important?
- Secondary manufacturing of forest products generates additional employment and revenue from Canada’s forest resources and helps mitigate risks related to timber supply shocks.
- Secondary manufacturing is domestic market-focused, which is more stable than the international market toward which primary products are geared. It helps diversify forestry-dependent economic regions and mitigate risks related to export markets.
Gross domestic product from primary and secondary wood and paper product subsectors, 2012–2022
Graph summary
Comparison of the gross domestic product from primary and secondary wood and paper products in Canada for each year between 2012 and 2022.
Graph data
Gross domestic product from primary and secondary wood and paper product subsectors, 2012–2022
| Year | Gross domestic product (billion dollars) | |||
|---|---|---|---|---|
| Primary paper products | Primary wood products | Secondary paper products | Secondary wood products | |
| 2012 | 4.4 | 4.6 | 3.1 | 2.8 |
| 2013 | 3.9 | 5.1 | 3.2 | 2.9 |
| 2014 | 4.7 | 5.4 | 2.9 | 2.7 |
| 2015 | 4.8 | 5.6 | 3.1 | 2.8 |
| 2016 | 4.7 | 6.0 | 2.9 | 2.9 |
| 2017 | 4.4 | 6.0 | 3.0 | 2.8 |
| 2018 | 4.2 | 5.9 | 3.0 | 2.8 |
| 2019 | 3.8 | 5.7 | 2.8 | 3.1 |
| 2020 | 3.4 | 5.5 | 3.3 | 3.1 |
| 2021 | 3.6 | 6.1 | 3.2 | 3.3 |
| 2022 | 3.5 | 6.6 | 3.1 | 3.5 |
Forest sector carbon emissions
Key information
Trends in forest sector energy use and GHG emissions are affected by:
- structural decline in the newsprint and publishing industries
- related closures of pulp and paper mills
- investments in improving environmental performance
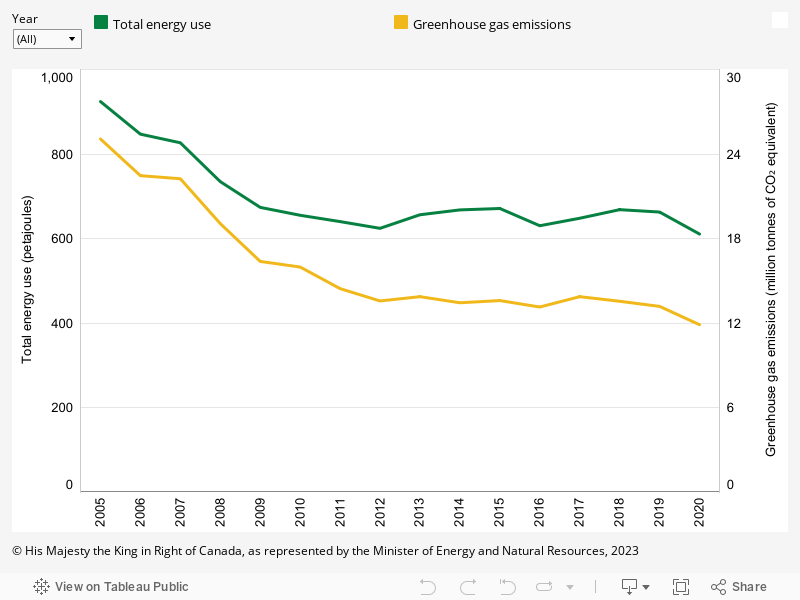
In 2020, the COVID-19 pandemic disrupted global economic activity, resulting in reduced emissions and energy use from Canada’s forest sector.
Following a pronounced decline between 2005 and 2010, greenhouse gas (GHG) emissions from the use of fossil fuels at forest sector facilities have since been relatively stable. Reductions in GHG emissions were due to improvements in energy efficiency and an increasing use of forest biomass for heat and power generation.
- Bioenergy meets 55% of the total annual energy demand from the forest sector and has reduced forest product facilities’ GHG emissions from fossil fuels (direct and indirect emissions) by 53% between 2005 and 2020.
- Direct emissions come from sources that are owned or controlled by the reporting entity. Indirect emissions are emissions that are a consequence of the activities of the reporting entity but that occur at sources owned or controlled by another entity. For this indicator, indirect emissions reported only include emissions from electricity generation.
- Energy efficiency improvements have helped reduce the total energy demand for the sector by 24% between 2005 and 2020.
Why is this indicator important?
GHG emissions are expressed as carbon dioxide equivalents (CO2e) to facilitate comparison of different gases based on their relative global warming potentials.
- Tracking annual emissions from fossil fuels is important for ensuring the forest sector continues to transition to net-zero while providing low-carbon forest products to Canada and the world.
- The substitution of fossil fuels with biomass results in net climate benefits. Emissions from biomass are part of the natural carbon cycle, in which carbon removals from forest regrowth occur in parallel with the emissions from bioenergy, unlike GHG emissions from fossil fuels.
Fossil fuel greenhouse gas emissions and total energy use in Canada’s forest sector, 2005–2020
Graph summary
The total energy use and the greenhouse gas emissions from Canada’s forest sector for each year between 2005 and 2020.
Graph data
Fossil fuel greenhouse gas emissions and total energy use in Canada’s forest sector, 2005–2020
| Year | Total energy use (petajoules) | GHG emissions (million tonnes of CO₂ equivalent) |
|---|---|---|
| 2005 | 924 | 25.1 |
| 2006 | 847 | 22.5 |
| 2007 | 827 | 22.3 |
| 2008 | 735 | 19.1 |
| 2009 | 674 | 16.4 |
| 2010 | 655 | 16.0 |
| 2011 | 640 | 14.5 |
| 2012 | 625 | 13.6 |
| 2013 | 657 | 13.9 |
| 2014 | 668 | 13.5 |
| 2015 | 671 | 13.6 |
| 2016 | 631 | 13.2 |
| 2017 | 648 | 13.9 |
| 2018 | 669 | 13.6 |
| 2019 | 663 | 13.2 |
| 2020 | 611 | 11.9 |
Sources and information
See Sources and information in the downloadable report for detailed sources.
Page details
- Date modified: