
Comparison of Corrosivity of Crude Oils Using Rotating Cage Method
NACE 2012 Northern Area Eastern Conference, Toronto, Canada
October 28-31, 2012
Presented at the Symposium on Crude Oil Corrosivity
Paper Number: 2012-06
Jennifer Collier
CanmetMATERIALS
183 Longwood Rd South
Hamilton, ON Canada
Sankara Papavinasam
CanmetMATERIALS
183 Longwood Rd South
Hamilton, ON Canada
Jian Li
CanmetMATERIALS
183 Longwood Rd South
Hamilton, ON Canada
Chao Shi
CanmetMATERIALS
183 Longwood Rd South
Hamilton, ON Canada
Pei Liu
CanmetMATERIALS
183 Longwood Rd South
Hamilton, ON Canada
Maciej Podlesny
CanmetMATERIALS
183 Longwood Rd South
Hamilton, ON Canada
ABSTRACT
In order to completely understand the corrosivity of crude oil, four properties should be evaluated: locations where water accumulates in a pipeline, type of emulsion, wettability and change in the corrosion rate of the aqueous phase in the presence of crude oil. The corrosivities of conventional and bitumen-derived crude oils were evaluated using the atmospheric rotating cage method. The maximum average corrosion rate of carbon steel in brine with crude oil was found to be 2.1 ± 1.9 mpy, compared to 19 ± 2.8 mpy for the brine alone. Based on their effect on the corrosivity of the brine solution, the crude oils were classified as inhibitive hydrocarbons according to the guidelines set out in ASTM Standard Guide G205: Standard Guide for Determining Corrosivity of Crude Oils.
KEYWORDS
Crude oil, bitumen, dilbit, rotating cage, corrosivity, carbon steel, brine.
INTRODUCTION
Characterization of the corrosivity of petroleum crude oils is of great interest to producers, transmission pipeline operators and regulatory authorities because of the potential consequences of a pipeline failure due to corrosion. In order to completely understand the corrosivity of crude oil, four properties should be evaluated: locations where water accumulates in a pipeline, type of emulsion, wettability and change in the corrosion rate of the aqueous phase in the presence of crude oil.
NACE SP0208: “Internal Corrosion Direct Assessment Methodology for Liquid Petroleum Pipelines” provides guidelines for predicting locations where water may accumulate, while ASTM Standard Guide G205: Standard Guide for Determining Corrosivity of Crude Oils provides guidelines to evaluate the emulsion, wettability, and change in corrosion rate of an aqueous phase in the presence of crude oil. ASTM G205 further provides a guideline for classifying crude oils into four categories based on the effect of the oil on the corrosivity of water: corrosive hydrocarbons, neutral hydrocarbons, inhibitive hydrocarbons and preventative hydrocarbonsReferences 1.
The rotating cage test has been established as a good laboratory methodology to simulate pipeline operating conditions using a relatively simple procedure References 1,References 2,References 3. It was the top-ranked laboratory methodology in a study that investigated the use of eight common laboratory methodologies to simulate corrosion in operating pipelinesReferences 4. In this method average corrosion rate is calculated from the mass loss of test coupons that have been rotated within the test environment. Recently ASTM International coordinated an inter-laboratory program of round robin tests that established a bench-mark average corrosion rate of 23 ± 2 mpy for carbon steel in an aqueous water phase in the absence of crude oilReferences 5.
This paper focuses on determining the change in the corrosivity of an aqueous phase in the presence of crude oil using the rotating cage method. The experiments were carried out at an oil-water ratio of 25:75. Such high water content may not exist in a properly maintained oil transmission pipeline, but the objective of the work was to evaluate the corrosivity of crude oil under worst-case conditions. Crude oils that do not exhibit corrosivity at these extreme conditions would not be expected to exhibit corrosivity under normal oil transmission pipeline operating conditions.
To date the corrosivities of 11 conventional and bitumen-derived crude oils have been evaluated by atmospheric pressure rotating cage and classified as corrosive, neutral, inhibitive or preventative hydrocarbons according to the guidelines set out in ASTM G205-10 by comparing the corrosivity of a brine solution in the presence of each crude oil to the corrosivity of the brine alone and the bench-mark aqueous phase corrosivity.
EXPERIMENTAL PROCEDURE
Test Specimens
Carbon steel test coupons with nominal dimensions of 75 mm x 19 mm x 3 mm were prepared by grinding all surfaces to 600 grit with silicon carbide paper, rinsing with distilled water, degreasing with acetone in an ultrasonic cleaner for 1 minute and drying. Following cleaning the coupons were weighed to the nearest 0.1 mg and the dimensions of the coupons were measured to the nearest 0.1 mm. Eight freshly prepared coupons were installed into the rotating cage for each test, and if the test was not started within 4 hours of coupon preparation the rotating cage was stored in a desiccator to prevent pre-rusting of the coupons. The composition of the carbon steel coupons, as provided by the supplier, is given in Table 1.
Test Solutions
Test solutions were prepared by mixing 1 L of crude oil with 3 L of 5 wt% NaCl solution to form a 25% oil-75% brine mixture. The test solutions were pre-saturated with CO2 gas for 24 hours prior to starting the rotating cage test. Of the crude oils obtained for testing, 9 samples had been processed to remove acid gases and then stored for 4 years before testing. The other samples were tested as-received from the field within 1 to 4 months of sampling.
Density Characterization
The densities of the crude oil samples were calculated by weighing 10 mL of each crude oil and dividing the mass of the sample by its volume.
Rotating Cage Test
The rotating cage tests were conducted under ambient temperature and pressure conditions according to the method described in ASTM G202-09References 6. 8 test coupons were mounted in the rotating cage and the cage was installed into the empty test apparatus. The apparatus was purged with CO2 gas for a minimum of 8 hours prior to testing. The pre-saturated test solution was then transferred to the test apparatus using a pump and the rotating cage motor was switched on to rotate the cage at a speed of 500 rpm. Throughout the test the head space above the test solution was purged with CO2 gas. The height of the vortex was measured and recorded. After 100-136 hours of testing the motor was switched off and the test solution was drained from the apparatus to end the test. The rotating cage with the test coupons was immediately soaked in toluene for 3-5 minutes followed by immersion in acetone in an ultrasonic cleaner for 3-5 minutes to remove most of the crude oil. The test coupons were then removed from the rotating cage and soaked in a detergent solution for 30 minutes to remove any remaining residual crude oil. Six of the eight coupons were analyzed for mass loss and two coupons were prepared for surface analysis.
Mass Loss Analysis for Average Corrosion Rate
The mass loss coupons were first scrubbed with a brass brush to remove any visible corrosion product, rinsed with distilled water and then immersed in 10% HCl in an ultrasonic cleaner for 2 minutes. The coupons were then rinsed with distilled water to remove any remaining acid, followed by rinsing with acetone to remove excess water and then drying with hot air. The coupons were placed in a desiccator for one hour and then weighed, and their masses were recorded to the nearest 0.1 mg. The dimensions of the coupons were measured to the nearest 0.1 mm. Three untested control coupons were subjected to the cleaning process in order to determine the mass loss due to cleaning. Following the mass loss analysis the test coupons were ground to 600 grit for reuse in the next rotating cage test.
Average corrosion rate in mils per year (mpy) was calculated from the mass loss according to Formula 1:
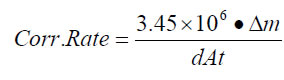 , [1]
, [1]
where Δm is the mass loss in grams after correction for mass loss due to cleaning,
d is the density of iron, 7.86 g/cm3,
A is the average surface area of the coupons, 34.826 cm2, and
t is the test duration in hours.
Surface Analysis
After removal from the detergent solution the surface analysis coupons were rinsed with distilled water, rinsed with alcohol and dried with hot air. The coupons were then stored in a desiccator for subsequent surface analysis using a scanning electron microscope (SEM) equipped with a light element energy dispersive spectrometer (EDS).
RESULTS AND DISCUSSION
The results of the density and average corrosion rate analyses of the crude oil samples are summarized in Table 2. The average corrosion rate of the carbon steel coupons in 5% NaCl brine in the presence each crude oil is shown in Figure 1.
The average corrosion rate of the carbon steel coupons was between 0.057 ± 0.093 and 2.1 ± 1.9 mpy for all of the crude oils, compared to the average corrosion rate of 19 ± 2.8 mpy found for the 5% NaCl brine alone and the bench-mark aqueous phase corrosion rate of 23 ± 2 mpy established by round-robin testing. Thus, all the tested crude oils can be classified as inhibitive hydrocarbons according to ASTM G205, as the corrosivity of brine was lowered in their presence. The crude oils inhibited the corrosion of carbon steel in brine by 88-99% under the conditions of this study.
While the average corrosion rates for all of the crude oil-brine mixtures were found to be lower than the average corrosion rate for brine alone, no trend in average corrosion rate was observed with density.
The standard deviations of the measured average corrosion rate values were fairly high, in several cases approaching or exceeding the magnitude of the value itself. This variation is attributed in part to the small magnitude of the observed changes in mass, which in many cases approached the limit of resolution of the balance used to weigh the samples. It was not possible to increase the number of replicate tests because of the limited volume of each crude oil sample. However, even when the relatively large standard deviations are considered the corrosivity of 5% NaCl brine in the presence of each of the crude oils was significantly lower than the corrosivity of the brine alone (p<10-11 in a Student’s t-Test).
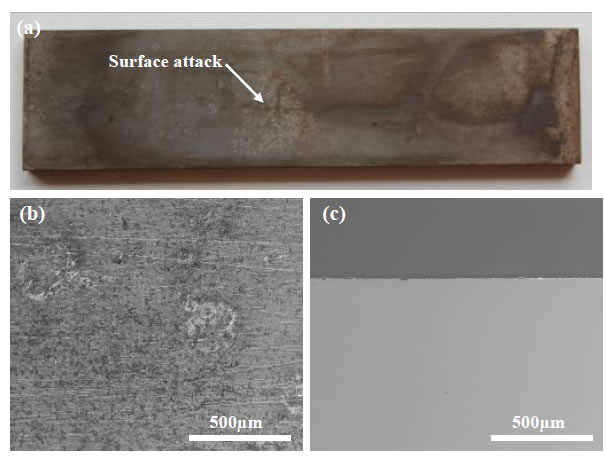
Representative plan view SEM images of the carbon steel coupons exposed to the crude oil-brine mixtures are shown in Figure 2 for the crude oils that had been processed and stored prior to testing. The surfaces of all coupons exhibited characteristics of general corrosion to some extent, including surface layers of corrosion product and loss of surface metal. EDS spectra taken from the surface of each sample (not shown) include mostly iron and oxygen consistent with oxide patches. Some of the EDS spectra showed carbon, the source of which was likely the steel itself. Some samples showed mild surface pitting, but when cross sections were examined the pits did not penetrate below the level of general surface attack. The pit-like morphology may be the result of the initial stages of general corrosion rather than the initiation of pitting corrosion. Extending the duration of the tests to permit pit growth beyond the depth of general surface attack would permit further investigation into the nature of the pit-like features in this study, but based on the current results it is difficult to conclude that pitting attack occurred. A representative cross section is shown in Figure 3.
The data available from testing completed to date do not indicate a significant difference in corrosivity between the crude oils that had been processed and stored prior to testing and the crude oils that were tested as-received from the field, as the average corrosion rates for the two as-received crude oils fell within the range observed for the crude oils that had been stored. Testing of additional as-received crude oil samples including surface analysis is ongoing in order to increase the sample size and permit a more detailed investigation of the corrosivity of crude oil samples tested in the as-received condition.
SUMMARY
The corrosivities of conventional and bitumen-derived crude oils were evaluated using the atmospheric rotating cage method after pre-saturation with CO2 gas. Nine oils had been processed to remove acid gases and stored for four years prior to testing, while two oils were tested as-received from the field within 1 to 4 months of sampling. All of the tested crude oils were found to inhibit the corrosivity of brine by 88-99%. The maximum average corrosion rate of carbon steel in brine with crude oil was found to be 2.1 ± 1.9 mpy, compared to 19 ± 2.8 mpy for the brine used in the study and the bench-mark aqueous phase corrosion rate of 23 ± 2 mpy. The nine stored crude oils and two as-received crude oils were classified as inhibitive hydrocarbons according to ASTM Standard Guide G205 based on their effect on the corrosivity of the brine solution. Analysis by SEM and EDS showed varying extents of general corrosion and the presence of surface oxides but no significant pitting corrosion.
ACKNOWLEDGEMENTS
Funding for this work was provided by the Program on Energy Research and Development of Natural Resources Canada. The authors would like to thank Bill Santos and Trevor Place for their helpful discussion and technical review.
Figure 1: Average Corrosion Rate of Carbon Steel in Brine in the Presence of Crude Oils. Each mixture is identified by the density of the crude oil component.
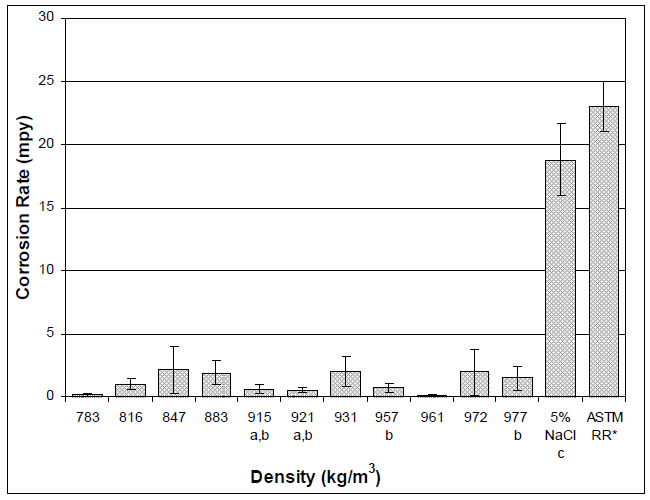
a Indicates samples tested as-received from the field. All other samples had been processed to remove acid gases and then stored for 4 years before testing.
b Indicates a diluted bitumen (dilbit or dilsynbit).
c The reproducibility of the baseline tests is being established for multiple operators with varying levels of experience.
* Bench-mark aqueous phase corrosion rate established by round-robin testing coordinated by ASTM International5.
Figure 2: SEM Images of Carbon Steel Exposed to Brine in the Presence of Crude Oils (Stored Crude Oils). Each mixture is identified by the density of the crude oil component in kg/m3: 783 (a), 816 (b), 847 (c), 883 (d), 931 (e), 957 (f), 961 (g), 972 (h) and 977 (i). Original magnification for all images: 2000x.
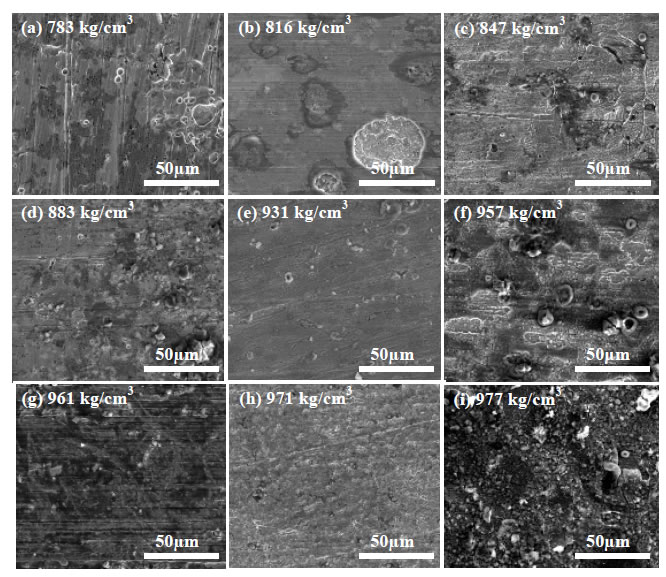
Figure 3: Cross Section SEM Image of Carbon Steel Exposed to Brine in the Presence of Crude Oil with Density of 977 kg/cm3 (Stored). Digital image (a), plan view SEM image (b) and cross section SEM image (c). Original magnification for (b) and (c): 200x.
| C | Mn | P | S | Si | Cu | Ni | Cr | Sn |
|---|---|---|---|---|---|---|---|---|
| 0.03 | 0.21 | 0.012 | 0.008 | 0.008 | 0.04 | 0.02 | 0.05 | 0.002 |
| Mo | Al | Co | V | Ti | Ca | N | B | Fe |
| 0.004 | 0.043 | 0.005 | 0.001 | 0.0006 | 0.0001 | 0.036 | 0.0001 | Balance |
| Oil | Density,kg/m3 | Test Duration,hours | Corrosion Rate,mpy | No. of Coupons |
|---|---|---|---|---|
| 9 | 783 | 113,113 | 0.16±0.14 | 12 |
| 4 | 816 | 112‡,120‡ | 1.0±0.38 | 12 |
| 3 | 847† | 100‡,113*‡,112*‡ | 2.1±1.9 | 18 |
| 6 | 883 | 112.5,112.5‡ | 1.9±0.93 | 12 |
| 13a,b | 915 | 115,115 | 0.60±0.36 | 12 |
| 11a,b | 921 | 114,136 | 0.54±0.21 | 12 |
| 5 | 931 | 112,112 | 2.0±1.2 | 12 |
| 8b | 957 | 113,112.5 | 0.73±0.34 | 12 |
| 1 | 961 | 100 | 0.057±0.093 | 6 |
| 2 | 972 | 112,113,100‡ | 2.0±1.8 | 18 |
| 7b | 977 | 114,112.5 | 1.5±0.92 | 12 |
| 5% NaCl | 112,100 | 19±2.8c | 30 | |
† Due to an insufficient quantity of sample the density of this crude oil could not be measured. Field data values were provided by the donor company.
‡ No vortex present during test.
* Test solution made up of 0.7 L crude oil and 2.1 L brine solution.
a Indicates samples tested as-received from the field. All other samples had been processed to remove acid gases and then stored for 4 years before testing.
b Indicates a diluted bitumen (dilbit or dilsynbit).
c The reproducibility of the baseline tests is being established for multiple operators with varying levels of experience.
Page details
- Date modified: