
Section I: Organizational Expenditure Overview
Organizational Profile
Appropriate Minister: The Honourable Greg Rickford, P.C., M.P.
Institutional Head: Bob Hamilton
Ministerial Portfolio:
- Atomic Energy of Canada LimitedFootnote [i] (AECL);
- National Energy BoardFootnote [ii] (NEB);
- Canadian Nuclear Safety CommissionFootnote [iii] (CNSC);
- Canada-Newfoundland and Labrador Offshore Petroleum BoardFootnote [iv] (CNLOPB);
- Canada-Nova Scotia Offshore Petroleum BoardFootnote [v] (CNSOPB);
- Northern Pipeline AgencyFootnote [vi] (NPA);
- Sustainable Development Technology CanadaFootnote [vii] (SDTC); and
- Energy Supplies Allocation Board (ESAB) (inactive).
Enabling Instrument(s):
- Department of Natural Resources ActFootnote [viii], S.C. 1994, c. 41
- Forestry ActFootnote [ix], R.S.C., 1985, c. F-30
- Resources and Technical Surveys ActFootnote [x], R.S.C., 1985, c. R-7
Year of Incorporation / Commencement: 1994
Organizational Context
Raison d’être
The vision of Natural Resources Canada (NRCan) is to improve the quality of life of Canadians by creating a sustainable resource advantage. It seeks to achieve this vision by working to improve the competitiveness of the natural resource sectors and to grow their contribution to Canada’s economy, by supporting the responsible development of Canada’s resources in a manner that advances the country’s global standing as a leader on the environment, and by using its knowledge and expertise of Canada’s landmass to support the safety and security of citizens.
Responsibilities
The Minister of Natural Resources is specifically responsible for, or has responsibilities under, more than 30 acts of Parliament. The Minister’s core powers, duties and functions are set forth in the Department of Natural Resources Act, the Resources and Technical Surveys Act and the Forestry Act. NRCan also works in areas of shared responsibilities with provinces.
To deliver on its responsibilities, NRCan relies on a number of instruments. It uses science and technology (S&T) to help address priorities and to plan for the future. It develops policies, programs, and regulations that help create a sustainable resource advantage, supporting strong, competitive natural resource sectors that are environmentally and socially responsible. And it uses partnerships and international collaboration to help drive progress on natural resource issues important to Canadians. More broadly, the Department plays a critical role in Canada’s future, contributing to high-paying jobs, business investment and overall economic growth in Canada’s natural resource sectors.
NRCan has offices and laboratories from coast to coast to coast. About half of its occupied facilities are in the National Capital Region, with the remainder being distributed from Atlantic Canada, through Québec and Ontario, to the Western and Pacific Regions and Northern Canada.
Strategic Outcome(s) and Program Alignment Architecture
- Strategic Outcome 1: Canada’s Natural Resource Sectors are Globally Competitive
- Program 1.1: Market Access and Diversification
- Sub-Program 1.1.1: Mineral and Metal Markets Access and Development
- Sub-Program 1.1.2: Forest Products Market Access and Development
- Sub-Program 1.1.3: Energy Market Regulation and Information
- Program 1.2: Innovation for New Products and Processes
- Sub-Program 1.2.1: Mining Innovation
- Sub-Program 1.2.2: Forest Sector Innovation
- Sub-Program 1.2.3: Geomatics Innovation
- Program 1.3: Investment in Natural Resource Sectors
- Sub-Program 1.3.1: Mineral Investment
- Sub-Program 1.3.2: Forest-based Community Partnerships
- Sub-Program 1.3.3: Targeted Geoscience Initiative 4 (TGI-4)
- Sub-Program 1.3.4: Geo-mapping for Energy and Minerals
- Sub-Program 1.3.5: New Energy Supply
- Sub-Program 1.3.6: Major Projects Management Office Initiative
- Program 1.4: Statutory Programs –Atlantic Offshore
- Program 1.1: Market Access and Diversification
- Strategic Outcome 2: Natural Resource Sectors and Consumers are Environmentally Responsible
- Program 2.1: Energy-efficient Practices and Lower-carbon Energy Sources
- Sub-Program 2.1.1: Renewable Energy Deployment
- Sub-Program 2.1.2: Support for Clean Energy Decision-making
- Sub-Program 2.1.3: Alternative Transportation Fuels
- Sub-Program 2.1.4: Energy Efficiency
- Program 2.2: Technology Innovation
- Sub-Program 2.2.1: Materials for Energy
- Sub-Program 2.2.2: Green Mining
- Sub-Program 2.2.3: Clean Energy Science and Technology
- Program 2.3: Responsible Natural Resource Management
- Sub-Program 2.3.1: Forest Ecosystem Science and Application
- Sub-Program 2.3.2: Groundwater Geoscience
- Sub-Program 2.3.3: Environmental Studies and Assessments
- Sub-Program 2.3.4: Radioactive Waste Management
- Sub-Program 2.3.5: Earth Observations for Responsible Development of Natural Resources
- Program 2.1: Energy-efficient Practices and Lower-carbon Energy Sources
- Strategic Outcome 3: Canadians have Information to Manage their Lands and Natural Resources, and are Protected from Related Risks
- Program 3.1: Protection for Canadians and Natural Resources
- Sub-Program 3.1.1: Explosives Safety and Security
- Sub-Program 3.1.2: Materials and Certification for Safety and Security
- Sub-Program 3.1.3: Forest Disturbances Science and Application
- Sub-Program 3.1.4: Climate Change Adaptation
- Sub-Program 3.1.5: Geohazards and Public Safety
- Program 3.2: Landmass Information
- Sub-Program 3.2.1: Essential Geographic Information
- Sub-Program 3.2.2: Canada’s Legal Boundaries
- Sub-Program 3.2.3: Polar Continental Shelf Logistics Support
- Program 4.1: Internal Services
- Program 3.1: Protection for Canadians and Natural Resources
Organizational Priorities
In 2013-14, NRCan supported key government priorities. The Department played a lead role in 1) diversifying markets for Canada’s natural resources, 2) implementing responsible resource development, 3) conducting science and innovation for competitiveness and environmental protection, and 4) making use of science and technology to ensure the safety and security of Canadians and public confidence. It also continued to enhance the effectiveness and efficiency of its internal operations. Work on these priorities helped guide the Department in its efforts to follow through on its Strategic Outcomes and support broader Government of Canada priorities.
Details on each of the priorities and how NRCan achieved them are presented below.
Organizational Priorities
| Priority | Type1 | Strategic Outcome(s) [and/or] Program(s) |
| Expand markets and global partnerships | Previously Committed to | P 1.1 – Market Access and Diversification P 1.2 – Innovation for New Products and Processes |
| Summary of Progress | ||
|
NRCan worked to expand existing markets, open new markets, address market access barriers and promote investment in Canada as well as Canadian investment abroad by engaging with key foreign governments, both bilaterally and multilaterally.
|
||
1Type is defined as follows: previously committed to—committed to in the first or second fiscal year prior to the subject year of the report; ongoing—committed to at least three fiscal years prior to the subject year of the report; and new—newly committed to in the reporting year of the RPP or DPR. If another type that is specific to the department is introduced, an explanation of its meaning must be provided.
| Priority | Type | Strategic Outcome(s) [and/or] Program(s) |
| Unlock resource potential through responsible development | Previously Committed to | P 1.1 – Market Access and Diversification P 1.3 – Investment in Natural Resource Sectors P 2.1 – Energy-Efficient Practices and Lower-Carbon Energy Sources P 2.3 – Responsible Natural Resource Management P 3.2 – Landmass Information |
| Summary of Progress | ||
|
To achieve this priority, NRCan provided federal leadership by working with federal regulatory departments and agencies to implement the Government’s plan for Responsible Resource Development, and disseminated scientific knowledge necessary to understand and identify areas that hold the most resource development potential.
|
||
| Priority | Type | Strategic Outcome(s) [and/or] Program(s) |
| Innovate for competitiveness and environmental performance | Previously Committed to | P 1.1 – Market Access and Diversification P 1.2 – Innovation for New Products and Processes P 2.1 – Energy-efficient Practices and Lower-Carbon Energy Sources P 2.2 – Technology Innovation P 2.3 – Responsible Natural Resource Management |
| Summary of Progress | ||
|
NRCan continued its work to enhance energy efficiency in the residential, commercial and institutional, industrial and transportation sectors, pursue S&T projects on unconventional oil and gas, promote the development and use of innovative energy technology, support the production and use of alternative transportation fuels, and advance innovation in green mining.
|
||
| Priority | Type | Strategic Outcome(s) [and/or] Program(s) |
| Leverage S&T knowledge for safety and security risk management | Previously Committed to | P 2.3 – Responsible Natural Resource Development P 3.1 – Protection for Canadians and Natural Resources P 3.2 – Landmass Information |
| Summary of Progress | ||
|
Through collaboration with federal, provincial and territorial partners as well as academia, industry stakeholders and key international organizations, NRCan continued to drive innovation of the Canadian Geospatial Data Infrastructure, ensuring that high-value, open, standards-based geodata, such as topographic and geoscience maps, were available to Canadians. Additionally, the Department delivered reusable open data applications (e.g., Canadian digital elevation data, GeoGratis) and tools, leading to cost-effectiveness in technology use. NRCan also continued to prepare for and manage risks and emergencies as they related to its mandate.
|
||
| Priority | Type | Strategic Outcome(s) [and/or] Program(s) |
| Increase the effectiveness and efficiency in NRCan operations | Previously Committed to | P 4.1 – Internal Services |
| Summary of Progress | ||
|
NRCan focused on transforming the way it delivers internal services such as human resources, information management, and capital investments. In so doing, the Department increased efficiency and effectiveness of its operations.
|
||
Risk Analysis
As a large and diverse organization, NRCan prepares for and manages a wide range of risks. The Department’s approach to risk management is based on the recognition that a solid understanding of the risk environment is fundamental to achieving its Strategic Outcomes. Risk identification is a key part of NRCan’s planning process, and risks are important drivers in the establishment of priorities for the Department.
High-level strategic and operational risks are presented in NRCan’s Corporate Risk Profile, which is monitored and updated regularly. Operationally, one of the Department’s primary ongoing focuses continues to be the prudent and efficient management of its financial resources. From a strategic perspective, NRCan manages risks to support Canadians and the natural resource sectors
Two of these risks — Market Access and Investment Climate, and Hazards and Emergency Management, — are discussed here.
Resource context
Canada has vast energy, mineral and forest resources, which are critical to its economic prosperity. This resource wealth indirectly and directly contributes to almost one-fifth of the country’s nominal Gross Domestic Product and close to 1.8 million jobs. The importance of natural resources to the Canadian economy could grow further if, for example, the oil sands crude oil production more than doubles over the next 15 years, from 1.9 million barrels per day to 4.8 million barrels per day by 2030, as currently projected.
With a supply of natural resources far outpacing domestic demand, Canada must ensure that it can access foreign markets if it is to maintain and grow the economic benefits from its resource endowment. Canadian natural resources must have export destinations. As the United States is expected to be almost self-sufficient in energy, in net terms, by 2035, Canadian export destinations must increasingly be outside traditional markets. Countries such as China, which has already surpassed the United States as the world’s largest energy consumer, and India, slated to become the third largest energy consumer by 2030, represent important opportunities for Canada to expand markets. However, Canada has been keen to expand and strengthen existing markets too, in an effort to build resilience into its export strategy. In October 2013, for example, Canada and the European Union announced an agreement in principle on a Canada-European Comprehensive Economic and Trade Agreement (CETA), which will significantly boost two-way trade and investment. Once the CETA comes into force, it will immediately eliminate all tariffs on Canadian forest, minerals, metals and energy products, and will support bilateral dialogues in forestry and raw materials.
A number of factors influence the ability of natural resource sectors to get resources to market, and each of these contributed to the resource-based risks faced by Canada and managed, in part, by NRCan. These include Canada’s investment climate, the infrastructure to support harvesting resources and transporting them to market, and Canada’s international reputation in those potential markets. These risk drivers are discussed below, while NRCan’s strategy for managing them is addressed in the table following this section.
Canada needs to maintain an attractive business environment for natural resource projects as well as Canadian trade globally. A lack of critical infrastructure to bring resources to terminals or ports is a risk for the natural resource sectors. If pipelines, rail networks and roads – as well as the support to maintain them as safe and reliable transportation routes – are not sufficient, then the opportunities for the natural resource sectors will be diminished. Furthermore, if transportation infrastructure is not managed with the utmost regard to safety, the public confidence in the environmental safety of natural resource projects, or even in the entire industry, would erode, decreasing the support for projects by local First Nations. As well, Canada’s international reputation relating to its environmental performance could impact the access to foreign markets for Canadian natural resource exports.
Key Risks
| Risk | |
| Risk Response Strategy | Link to Program Alignment Architecture |
| Market Access and Investment Climate | |
|
NRCan will continue to manage this risk through working with several other federal departments, provincial and territorial governments and representatives from the private sector to 1) promote and brand Canada abroad as a reliable and environmentally responsible trade partner, including through focused, Ministerial missions; 2) engage with Aboriginal peoples and other Canadians on the potential benefits as well as on approaches to mitigate any environmental risks associated with resource development; 3) make the regulatory review process at home more predictable and efficient while ensuring sound environmental stewardship; and 4) develop appropriate regulations.
These and other commitments that helped mitigate this risk are described throughout the Departmental Performance Report in the sections identified under the links to the Program Alignment Architecture. |
1.1.2 – Forest Products Market Access and Development 1.1.3 – Energy Market Regulation and Information 1.3.1 – Mineral Investment 1.3.6 – Major Projects Management Office Initiative 2.2.1 – Materials for Energy 2.3.1 – Forest Ecosystems Science and Application |
| Hazards and Emergency Management | |
|
As a core part of NRCan’s mandate, the Emergency Management Act (EMA) outlines the accountabilities of federal ministers and their responsibilities relating to emergency management in Canada. In accordance with the EMA, and in relation to the Minister’s mandate, NRCan has specific accountabilities for contributing to the safety and security of Canadians and the international community.
These and other commitments that helped mitigate this risk are described throughout the Departmental Performance Report in the sections identified under the links to the Program Alignment Architecture. |
2.3.4 – Radioactive Waste Management 2.3.5 – Earth Observation for Responsible Resource Development 3.1.2 – Materials and Certification for Safety and Security 3.1.3 – Forest Disturbances Science and Application 3.1.5 – Geohazards and Public Safety 3.2.1 – Essential Geographic Information 4.1 – Internal Services |
Actual Expenditures
| 2013-14 Main Estimates |
2013-14 Planned Spending |
2013-14 Total Authorities Available for Use |
2013-14 Actual Spending (authorities used) |
Difference (actual minus planned) |
|---|---|---|---|---|
| 2,767,014,238 | 2,767,784,129 | 2,373,283,282 | 2,091,044,593 | (676,739,536) |
| 2013-14 Planned |
2013-14 Actual |
2013-14 Difference (actual minus planned) |
|---|---|---|
| 4,156 | 4,033 | (123) |
| Strategic Outcome(s), Program(s) and Internal Services | 2013-14 Main Estimates |
2013-14 Planned Spending |
2014-15 Planned Spending |
2015-16 Planned Spending |
2013-14 Total Authorities Available for Use | 2013-14 Actual Spending (authorities used) |
2012-13 Actual Spending (authorities used) |
2011-12 Actual Spending (authorities used) |
|---|---|---|---|---|---|---|---|---|
| Strategic Outcome 1: Canada’s Natural Resource Sectors are Globally Competitive | ||||||||
| Market Access and Diversification | 44,912,875 | 44,912,875 | 56,085,530 | 43,497,846 | 61,396,582 | 59,733,334 | 55,420,361 | * |
| Innovation for New Products and Processes | 102,524,720 | 102,524,720 | 67,598,586 | 66,175,755 | 105,039,435 | 94,093,063 | 93,948,144 | * |
| Investment in Natural Resource Sectors | 54,483,815 | 54,483,815 | 55,641,175 | 53,472,654 | 65,961,283 | 65,333,593 | 73,319,149 | * |
| Statutory Programs- Atlantic Offshore | 1,255,167,000 | 1,255,167,000 | 1,293,425,000 | 1,328,316,000 | 795,884,721 | 795,884,721 | 684,964,769 | * |
| Subtotal | 1,457,088,410 | 1,457,088,410 | 1,472,750,291 | 1,491,462,255 | 1,028,282,021 | 1,015,044,711 | 907,652,423 | * |
| Strategic Outcome 2: Natural Resource Sectors and Consumers are Environmentally Responsible | ||||||||
| Energy-efficient Practices & Lower-carbon Energy Sources | 444,317,619 | 444,317,619 | 464,018,045 | 255,596,149 | 430,276,325 | 314,652,883 | 342,424,547 | ** |
| Technology Innovation | 265,761,737 | 265,761,737 | 150,090,774 | 122,495,639 | 235,868,140 | 155,738,548 | 152,200,348 | ** |
| Responsible Natural Resource Management | 341,051,255 | 341,051,255 | 179,373,009 | 181,701,711 | 330,109,153 | 282,047,031 | 236,874,939 | ** |
| Subtotal | 1,051,130,611 | 1,051,130,611 | 793,481,828 | 559,793,499 | 996,253,618 | 752,438,462 | 731,499,834 | ** |
| Strategic Outcome 3: Canadians have information to Manage their Lands and Natural Resources, and are Protected from Related Risks | ||||||||
| Protection for Canadians and Natural Resources | 58,484,119 | 59,202,413 | 55,878,528 | 52,950,476 | 66,418,340 | 65,535,095 | 55,604,146 | *** |
| Landmass Information | 44,500,738 | 44,500,738 | 53,620,414 | 45,306,771 | 83,852,111 | 73,828,231 | 90,961,341 | *** |
| Subtotal | 102,984,857 | 103,703,151 | 109,498,941 | 98,257,247 | 150,270,451 | 139,363,326 | 146,565,487 | *** |
| Internal Services Subtotal | 155,810,360 | 155,861,957 | 158,919,551 | 140,907,322 | 198,477,192 | 184,198,094 | 181,093,220 | 251,745,618 |
| Total | 2,767,014,238 | 2,767,784,129 | 2,534,650,611 | 2,290,420,322 | 2,373,283,282 | 2,091,044,593 | 1,966,810,964 | 3,352,172,605 |
* NRCan changed its PAA from 2011-12 to 2012-13. Actual Spending for 2011-12 reflects that year’s PAA structure, for which there were two program activities under Strategic Outcome 1: 1.1 Economic Opportunities for Natural Resources (actual spending for 2011-12 of $1,439,492,491, which includes the Statutory Programs related to the Atlantic Offshore, with actual spending for 2011-12 of $1,222,730,140), and 1.2 Natural Resource-based Communities (actual spending for 2011-12 of $23,288).
** NRCan changed its PAA from 2011-12 to 2012-13. Actual Spending for 2011-12 reflects that year’s PAA structure, for which there were two program activities under Strategic Outcome 2: 2.1 Clean Energy (actual spending for 2011-12 of $1,323,313,646) and 2.2 Ecosystem Risk Management (actual spending for 2011-12 of $199,083,001).
*** NRCan changed its PAA from 2011-12 to 2012-13. Actual Spending for 2011-12 reflects that year’s PAA structure, for which there were three program activities under Strategic Outcome 3: 3.1 Adapting to a Changing Climate and Hazard Risk Management (actual spending for 2011-12 of $50,834,868), 3.2 Natural Resources and Landmass Knowledge and Systems (actual spending for 2011-12 of $87,235,443) and 3.3 Geomatics Canada Revolving Fund (actual spending for 2011-12 of $444,250).
NRCan’s Planned Spending of $2.768 billion was adjusted during the year to $2.373 billion to reflect changes in authorities granted in Budget 2013 and adjustments to statutory items. The overall reduction of $395 million is explained by a combination of increases and decreases.
Increases included funding for the Government Advertising Campaign, the Stakeholder Engagement and Outreach Campaign, the Restructuring of Atomic Energy of Canada Limited’s Nuclear Laboratories, Geo-Mapping for Energy and Minerals, United Nations Convention on the Law of the Sea (UNCLOS), Port Hope Area Initiative, transfer from the Department of National Defence for the Canadian Armed Forces Arctic Training Centre, the operating budget and capital budget carry forward, and collective bargaining.
Decreases included transfers to other departments, a reduction to the Clean Energy Fund (CEF), payments to the Newfoundland Offshore Petroleum Resource Revenue Fund (which were lower than initially forecasted due to decreases in production resulting from the shutdown of oil platforms), and payments to the Nova Scotia Offshore Revenue Account (which were lower due to decreases in production resulting from depressed natural gas prices and reduction in operating capacity).
NRCan’s Actual Spending of $2.091 billion compared to total authorities of $2.373 billion resulted in a lapse of $282 million, primarily due to lapses in the Grants and Contributions vote pertaining to the ecoENERGY for Biofuels program, the Grant to Sustainable Development Technology Canada, ecoENERGY Renewable Power (all resulting from claims being lower than allowed in the contribution agreements), Investments in Forest Industry Transformation program (as a result of a contribution agreement not being signed), as well as amounts frozen for the CEF, the Advertising Campaign, the transfer to Shared Services Canada, and the conversion factor (converting operating dollars into salary dollars), the reprofile of funding to future years for the Gunnar and Lorado Mine, the Port Hope Area Initiative, the Stakeholder Engagement and Outreach Campaign, and Incremental Land Claims, and a lapse in the Operating vote for the Port Hope Area Initiative, for which NRCan will seek a reprofile.
Alignment of Spending With the Whole-of-Government Framework
| Strategic Outcome | Program | Spending Area | Government of Canada Outcome | 2013-14 Actual Spending |
|---|---|---|---|---|
| 1 Canada’s Natural Resource Sectors are Globally Competitive | 1.1 Market Access and Diversification | Economic Affairs | Strong Economic Growth | 59,733,334 |
| 1.2 Innovation for New Products and Processes | Economic Affairs | Strong Economic Growth | 94,093,063 | |
| 1.3 Investment in Natural Resource Sectors | Economic Affairs | Strong Economic Growth | 65,333,593 | |
| 1.4 Statutory Programs- Atlantic Offshore | Economic Affairs | Strong Economic Growth | 795,884,721 | |
| 2 Natural Resource Sectors and Consumers are Environmentally Responsible | 2.1 Energy-efficient Practices & Lower-carbon Energy Sources | Economic Affairs | A Clean and Healthy Environment | 314,652,883 |
| 2.2 Technology Innovation | Economic Affairs | A Clean and Healthy Environment | 155,738,548 | |
| 2.3 Responsible Natural Resource Management | Economic Affairs | A Clean and Healthy Environment | 282,047,031 | |
| 3 Canadians have information to Manage their Lands and Natural Resources, and are Protected from Related Risks | 3.1 Protection for Canadians and Natural Resources | Social Affairs | A Safe and Secure Canada | 65,535,095 |
| 3.2 Landmass Information | Social Affairs | A Safe and Secure Canada | 73,828,231 |
| Spending Area | Total Planned Spending | Total Actual Spending |
|---|---|---|
| Economic Affairs | 2,508,219,021 | 1,767,483,173 |
| Social Affairs | 103,703,151 | 139,363,326 |
| International Affairs |
|
|
| Government Affairs |
|
|
Departmental Spending Trend
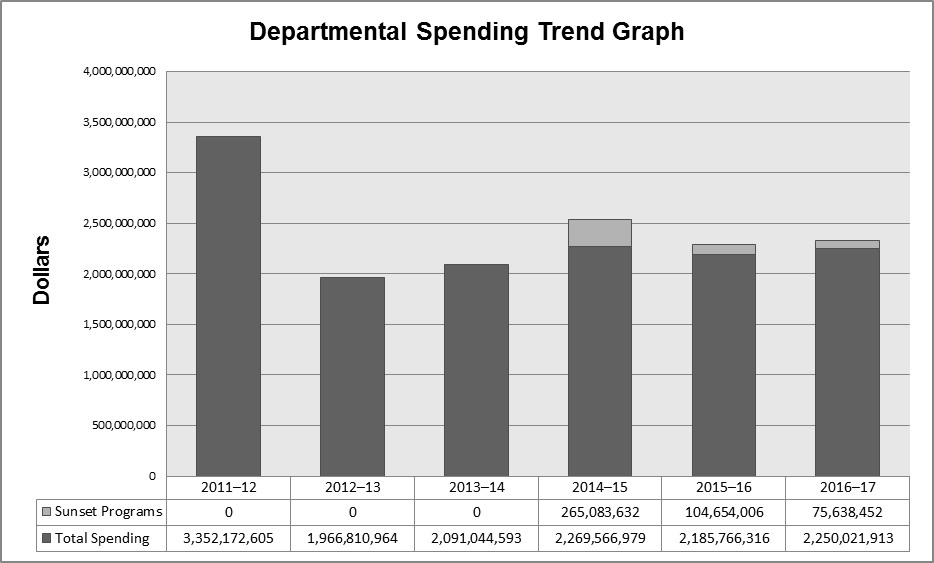
Departmental Spending Trend Graph
Text version
| 2011-12 | 2012-13 | 2013-14 | 2014-15 | 2015-16 | 2016-17 | |
|---|---|---|---|---|---|---|
| Sunset Programs | 0 | 0 | 0 | 265,083,632 | 104,654,006 | 75,638,452 |
| Total Spending | 3,352,172,605 | 1,966,810,964 | 2,091,044,593 | 2,269,566,979 | 2,185,766,316 | 2,250,021,913 |
For fiscal years 2011-12, 2012-13 and 2013-14, the figures represent the actual expenditures as reported in the Public Accounts.
NRCan’s spending profile shows a drop in expenditures after fiscal year 2011-12 as a result of sunsetting funding for Canada’s Economic Action Plan initiatives, specifically the Pulp and Paper Green Transformation Program, the ecoENERGY Retrofit – Homes Grant Program, and the ecoENERGY Technology Initiative. In addition to the sunsetting funding, there is a significant reduction to the statutory payments for the Atlantic Offshore Accords from 2011-12 to 2013-14.
For the period 2014-15 to 2016-17, the figures represent the total planned spending for the fiscal year, which reflects approved funding by Treasury Board to support the departmental strategic outcomes. The sunset amounts represent programs that are set to expire in that fiscal year, irrespective of a planned renewal. In 2014-15, a large portion ($195M) of the sunsetting programs is related to the Nuclear Legacy Liabilities Program. While total planned spending from 2014-15 to 2016-17 remains steady, the statutory planned spending for the Atlantic Offshore Accords increases from 2013-14 to 2016-17 and appropriated planned spending for sunset programs declines, effectively offsetting each other.
Major initiatives sunsetting in 2014-15 include:
- Nuclear Legacy Liabilities Program;
- Renewable Fuels – Conditional Grant to Sustainable Development Technology Corporation; and
- Stakeholder Engagement and Outreach Campaign.
Major initiatives sunsetting in 2015-16 include:
- ecoENERGY Innovation Initiative; and
- ecoENERGY Efficiency.
Major initiatives sunsetting in 2016-17 include:
- Forest Innovation and Expanding Market Opportunities;
- ecoENERGY for Biofuels; and
- Wind Power Production Incentive.
Estimates by Vote
For information on Natural Resources Canada’s organizational Votes and statutory expenditures, consult the Public Accounts of Canada 2014 Footnote xii on the Public Works and Government Services Canada website
Endnotes
- Footnote 1
- Footnote 2
- Footnote 3
- Footnote 4
- Footnote 5
- Footnote 6
- Footnote 7
- Footnote 8
- Footnote 9
- Footnote 10
- Footnote 11
-
Harmonisation des dépenses réelles pour 2013-2014 avec le cadre pangouvernemental
- Footnote 12
Page details
- Date modified: