
Section II: Expenditure Overview
Actual Expenditures
Budgetary Financial Resources (dollars)
|
2015–16 |
2015–16 |
2015–16 |
2015–16 |
Difference |
|---|---|---|---|---|
|
2,214,476,711 |
2,214,476,711 |
1,715,634,089 |
1,335,178,669 |
(879,298,042) |
Human Resources (Full-Time Equivalents [FTEs])
|
2015–16 |
2015–16 |
2015–16 |
|---|---|---|
|
3,832 |
3,936 |
104 |
Budgetary Performance Summary
|
Programs and Internal Services |
2015–16 |
2015–16 |
2016–17 |
2017–18 |
2015–16 |
2015–16 |
2014–15 |
2013–14 |
|---|---|---|---|---|---|---|---|---|
|
1.1 Market Access and Diversification |
48,685,006 |
48,685,006 |
43,993,476 |
28,361,877 |
90,964,090 |
75,927,073 |
61,566,240 |
59,733,334 |
|
1.2 Innovation for New Products and Processes |
83,438,001 |
83,438,001 |
96,074,981 |
55,536,596 |
92,394,682 |
93,375,233 |
71,707,214 |
94,093,063 |
|
1.3 Investments in Natural Resource Sectors |
54,230,114 |
54,230,114 |
62,900,219 |
65,272,906 |
67,692,074 |
68,270,162 |
60,589,504 |
65,333,593 |
|
1.4 Statutory Programs – Atlantic Offshore* |
1,181,938,140 |
1,181,938,140 |
743,336,158 |
761,960,697 |
347,989,273 |
347,989,273 |
837,746,067 |
795,884,721 |
|
2.1 Energy-Efficient Practices and Lower-Carbon Energy Sources |
253,978,461 |
253,978,461 |
183,336,817 |
133,361,992 |
258,837,128 |
211,012,423 |
291,745,439 |
314,652,883 |
|
2.2 Technology Innovation |
126,472,078 |
126,472,078 |
115,838,434 |
108,270,795 |
143,292,764 |
143,620,407 |
151,832,220 |
155,738,548 |
|
2.3 Responsible Natural Resource Management |
193,117,981 |
193,117,981 |
29,619,508 |
28,958,607 |
410,119,888 |
121,598,627 |
267,570,932 |
282,047,031 |
|
3.1 Protection for Canadians and Natural Resources |
58,672,639 |
58,672,639 |
57,808,743 |
49,858,500 |
73,440,885 |
73,709,947 |
65,692,439 |
65,535,095 |
|
3.2 Landmass Information |
71,155,143 |
71,155,143 |
75,092,662 |
51,156,481 |
83,529,098 |
74,110,670 |
78,469,116 |
73,828,231 |
|
Internal Services |
142,789,148 |
142,789,148 |
184,517,755 |
137,682,086 |
147,374,207 |
125,564,854 |
162,499,616 |
184,198,094 |
|
Total |
2,214,476,711 |
2,214,476,711 |
1,592,518,753 |
1,420,420,537 |
1,715,634,089 |
1,335,178,669 |
2,049,418,787 |
2,091,044,593 |
* Statutory Programs — Atlantic Offshore: As per the various Atlantic Offshore Accords, the Government of Canada receives royalties for offshore oil and gas production and subsequently pays an equal amount to the provinces of Nova Scotia and Newfoundland and Labrador.
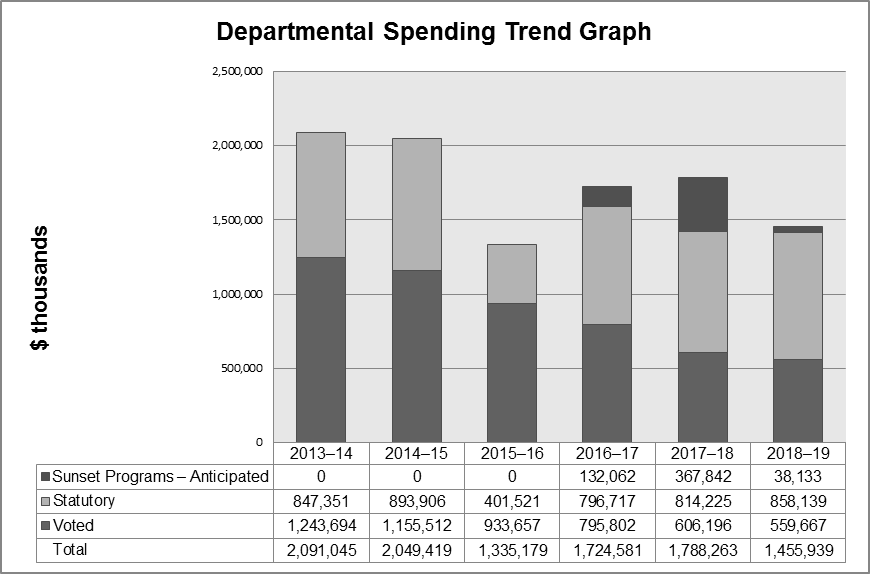
Departmental Spending Trend
The overall $879 million difference between the 2015-16 Planned Spending of $2,214 million and actual spending of $1,335 million is attributed to a $499 million reduction in authorities and $380 million in unspent funding.
The $499 million reduction in authorities is explained by the following:
Decreases due to:
- Reduced authority for statutory payments under the Atlantic Offshore Accord Acts due to reduced oil prices, lower currency exchange rate (CAD/USD) and, reduced commodity prices and production in the offshore area; and,
- Various transfers to other government departments.
Increases due to:
- Additional funding received through Supplementary Estimates for the Nuclear Legacy Liabilities Program (NLLP), the Federal Infrastructure Initiative, the renewal of the Targeted Geoscience Initiative, the Soldier Settlement Board mineral rights, defining the outer limits of Canada’s continental shelf in the Arctic Ocean, and the renewal of the Major Project Management Office (MPMO) horizontal initiative;
- Various transfers from other government departments; and,
- The receipt of the operating budget carry forward.
The $380 million in unspent funding is explained by the following:
- Funds frozen and not available for spending as a result of a government decision to implement the restructuring of AECL’s nuclear laboratories by transferring the funding and responsibilities related to NLLP and the Port Hope Area Initiative (PHAI) from NRCan to AECL;
- Funding being moved into future years for the Gunnar Mine Remediation;
- Unspent funds in the Operating vote being carried forward to next year, mainly to cover unfunded collective bargaining increases;
- Unspent funds in the Capital vote being carried forward to next year, mainly for the Federal Infrastructure Initiative; and
- Unspent funds in the Grants and Contributions vote, mainly pertaining to the ecoENERGY for Biofuels program (due to lower than anticipated production by biofuel companies) and the ecoENERGY Renewable Power program (due to lower incentive payouts based on lower production levels).
Departmental Spending Trend
Text version
| 2013-14 | 2014-15 | 2015-16 | 2016-17 | 2017-18 | 2018-10 | |
|---|---|---|---|---|---|---|
| Sunset Programs - Anticipated | 0 | 0 | 0 | 132,062 | 367,842 | 38,133 |
| Statutory | 847,351 | 893,906 | 401,521 | 796,717 | 814,225 | 858,139 |
| Voted | 1,243,694 | 1,155,512 | 933,657 | 795,802 | 606,196 | 559,667 |
| Total | 2,091,045 | 2,049,419 | 1,335,179 | 1,724,581 | 1,788,263 | 1,455,939 |
For 2013-14, 2014-15 and 2015-16, the figures represent actual expenditures as reported in the Public Accounts. NRCan’s spending profile remains steady from 2013-14 to 2014-15 and drops significantly in 2015-16, mainly as a result of the Statutory Atlantic Offshore Accounts, the transfer of responsibility over NLLP and PHAI to AECL and reduced spending pertaining to the ecoENERGY for Biofuels and the ecoENERGY Renewable Power programs, as well as less severance pay costs recovered from Treasury Board (TB). These reductions were slightly offset by the implementation of the Federal Infrastructure Initiative.
When comparing planned spending to actual expenditures, costs recovered from TB are recorded as an expense by the Department even though they were not part of the Department’s Planned Spending. These costs include parental benefits, severance pay, and vacation credits payable upon termination; they apply throughout Section III of this document and they contribute, in part, to the financial variance between the actual expenditures and planned spending.
The increase between 2015-16 actual expenditures and 2016-17 planned spending is mainly attributed to the Statutory Atlantic Offshore Accounts projected increase; offset by the transfer of responsibility over NLLP and PHAI and the sunsetting of the clean energy envelope.
For 2016-17 to 2018-19, the figures represent total planned spending for the fiscal year, which reflects approved funding by TB to support the Departmental strategic outcomes. Planned spending in Voted authorities from 2016-17 to 2018-19 is declining, mainly as a result of reduced funding profile for major initiatives (e.g., ecoENERGY for Renewable Power), and sunsetting programs, including the following:
Major initiatives sunsetting in 2016-17 are:
- Federal Infrastructure Budget 2015 announcement;
- Forest Innovation Program and Expanding Market Opportunities, which were extended to 2017-18 through Budget 2015 but funding has not yet been included in planned spending for 2017-18;
- ecoENERGY for Biofuels; and
- Wind Power Production Incentive.
Major initiatives sunsetting in 2017-18 are:
- Investments in Forest Industry Transformation; and
- World Class Prevention, Preparedness and Response Regime.
Statutory authorities from 2016-17 to 2018-19 are likely to increase, mainly as a result of the Atlantic Offshore Accounts. Statutory payment obligations under these accords are largely driven by oil and gas prices, production levels and anticipated corporate income taxes related to offshore operations. The increase was based on the Department's economic modeling forecasts prepared in the fall of 2015 when the 2016-17 Report on Plans and Priorities was developed.
The Sunset Programs Anticipated for 2016-17 to 2018-19 mostly reflect announcements in Budget 2015 or Budget 2016 that are not yet reflected in voted level for those years but are provided to give a more reasonable picture of the future of the Department.
Expenditures by Vote
For information on NRCan’s organizational voted and statutory expenditures, consult the Public Accounts of Canada 2016.xiii
Alignment of Spending With the Whole-of-Government Framework
|
Program |
Spending Area |
Government of Canada Outcome |
2015–16 |
|---|---|---|---|
|
1.1 Market Access and Diversification |
Economic Affairs |
Strong Economic Growth |
75,927,073 |
|
1.2 Innovation for New Products and Processes |
Economic Affairs |
Strong Economic Growth |
93,375,233 |
|
1.3 Investment in Natural Resource Sectors |
Economic Affairs |
Strong Economic Growth |
68,270,162 |
|
1.4 Statutory Programs – Atlantic Offshore |
Economic Affairs |
Strong Economic Growth |
347,989,273 |
|
2.1 Energy-Efficient Practices and Lower-Carbon Energy Sources |
Economic Affairs |
A Clean and Healthy Environment |
211,012,423 |
|
2.2 Technology Innovation |
Economic Affairs |
A Clean and Healthy Environment |
143,620,407 |
|
2.3 Responsible Natural Resource Management |
Economic Affairs |
A Clean and Healthy Environment |
121,598,627 |
|
3.1 Protection for Canadians and Natural Resources |
Social Affairs |
A Safe and Secure Canada |
73,709,947 |
|
3.2 Landmass Information |
Social Affairs |
A Safe and Secure Canada |
74,110,670 |
|
Spending Area |
Total Planned Spending |
Total Actual Spending |
|---|---|---|
|
Economic affairs |
- |
1,061,793,198 |
|
Social affairs |
- |
147,820,617 |
|
International affairs |
- |
- |
|
Government affairs |
- |
- |
Financial Statements and Financial Statements Highlights
Financial Statements
The Department’s consolidated financial statements are available on the NRCan website.xv
Financial Statements Highlights
The financial statements highlights are intended to provide a general overview of the Department’s operations and financial position.
The financial statement highlights presented in this section are drawn from NRCan’s consolidated financial statements and have been prepared in accordance with Treasury Board accounting policies, which are based on Canadian public sector accounting standards and are therefore different from reporting on the use of authorities, reflected in Section I and II of this report. Reconciliation between the net cost of operations and the authorities used is set out in Note 3 of the Department’s consolidated financial statements.
|
Financial Information |
2015–16 |
2015–16 |
2014–15 |
Difference (2015–16 actual minus 2015–16 planned) |
Difference (2015–16 actual minus 2014–15 actual) |
|
|---|---|---|---|---|---|---|
|
Total expenses |
2,190,166,694 |
1,373,162,269 |
2,100,576,784 |
(817,004,425) |
(727,414,515) |
|
|
Total revenues |
35,079,370 |
30,836,347 |
25,896,040 |
(4,243,023) |
4,940,307 |
|
|
Net cost of operations before government funding and transfers |
2,155,087,324 |
1,342,325,922 |
2,074,680,744 |
(812,761,402) |
(732,354,822) |
|
*Transferred operations are included in the total expenses as it relates to the transferred responsibilities of the NLLP and the Historic Waste Program to AECL which became effective on September 13, 2015.
The 2015-16 Planned Results are derived from the amounts presented in the Department’s 2015-16 Consolidated Future-Oriented Statement of Operations xv and included in NRCan’s 2015-16 Report on Plans and Priorities. The planned results were based on several assumptions and information known at that time.
Total expenses between 2015-16 actual of $1,373 million and 2015-16 planned results of $2,190 million represent $817 million, or 37 percent of overestimated expenses. This is mainly attributable to a $847 million decrease in Atlantic Offshore Statutory programs in continuing operations mainly due to decreased oil prices, lower production levels and a lower currency rate.
The planned net revenues of $35 million were based on historical data. The actual net revenues were $31 million in 2015-16 compared to $26 million in 2014-15, for a net increase of $5 million.
Difference between 2015-16 and 2014-15 actuals
Total expenses were $1,373 million in 2015-16 compare to $2,101 million in 2014-15 for a net decrease of $727 million, or 53 percent. This net decrease is mainly explained by:
- A $513 million decrease in Atlantic Offshore Statutory Programs mainly due to decreased oil prices, lower production levels and lower currency rate and a $79 million decrease in ecoENERGY for Biofuels Program under Energy-Efficient Practices and Lower Carbon Energy Sources as a result of terminated projects and proponents producing less.
- A $105 million decrease in total expenses for transferred operations from $124 million in 2015-16 to $229 million in 2014-15 is due to the transfer of responsibilities from NLLP and the Historic Waste Program to the AECL as of September 2015. Therefore 2015-16 had only 6 months of operating costs compared to 12 months in 2014-15.
The chart presenting NRCan’s actual expenses by type for 2016 is available on the NRCan website.
|
Financial Information |
2015–16 |
2014–15 |
Difference |
|---|---|---|---|
|
Total net liabilities |
432,291,969 |
1,579,823,467 |
(1,147,531,498) |
|
Total net financial assets |
257,773,468 |
378,181,969 |
(120,408,501) |
|
Departmental net debt |
174,518,501 |
1,201,641,498 |
(1,027,122,997) |
|
Total non-financial assets |
272,387,642 |
267,355,166 |
;5,032,476 |
|
Departmental net financial position |
97,869,141 |
(934,286,332) |
1,032,155,473 |
Total net liabilities were $432 million in 2015-16, compared to $1,580 million in 2014-15, for a decrease of $1,148 million or 73 percent. This variance is mainly attributable to:
- A decrease of $984 million in environmental liabilities and a $40 million in accounts payable and accrued liabilities related to the transfer to the AECL for the NLLP and the Historic Waste Program; and
- A decrease of $120 million in accounts payable and accrued liabilities mainly explained by a decrease of $47 million related to transfer payments under the Atlantic Offshore Statutory Programs.
Total net financial assets were $258 million in 2015-16, compared to $378 million in 2014-15, for a net decrease of $120 million or 32 percent. This variance is attributable to the decrease in the account Due from Consolidated Revenue Fund (CRF) of $120 million, which represents the net amount of cash the Department is entitled to draw from the CRF without further appropriations. The decrease is mainly due to the decrease in accounts payable and accrued liabilities at year-end.
The overall difference between the total net liabilities and total net financial assets are then reflected in the Departmental net debt.
Total non-financial assets, which include prepayments, inventory and tangible capital assets were $272 million in 2015-16, compared to $267 million in 2014-15 for a net increase of $5 million. This variance is mainly due to the increase in tangible capital assets due to additional funding received for the Federal Infrastructure Initiative offset by a decrease in prepayments due to the transfer of responsibilities of the NLLP to AECL.
The total non-financial assets are then subtracted from the Departmental net debt to reflect the Departmental net financial position
Page details
- Date modified: