
Analysis of trends in spending and human resources
Actual expenditures
Departmental spending trend graph 16
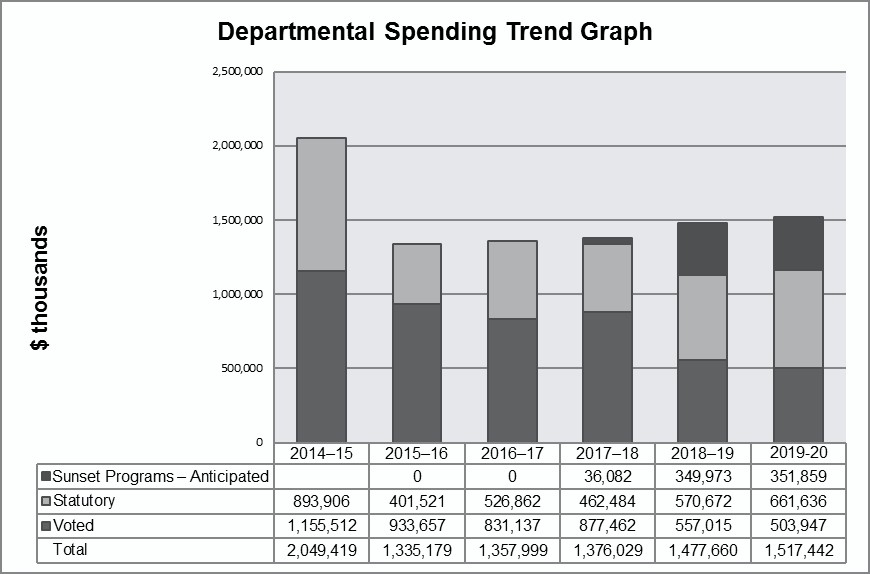
Departmental Spending Trend Graph
Text version
| 2014-15 | 2015-16 | 2016-17 | 2017-18 | 2018-19 | 2019-20 | |
|---|---|---|---|---|---|---|
| Sunset Programs - Anticipated | 0 | 0 | 0 | 36,082 | 349,973 | 351,859 |
| Statutory | 893,906 | 401,521 | 526,862 | 462,484 | 570,672 | 661,636 |
| Voted | 1,155,512 | 933,657 | 831,137 | 877,462 | 557,015 | 503,947 |
| Total | 2,049,419 | 1,335,179 | 1,357,999 | 1,376,029 | 1,477,660 | 1,517,442 |
16The Sunset Programs – Anticipated for 2017-18 to 2018-19 mainly reflect announcements in Budget 2017 that are not yet reflected in the Voted level for those years and are subject to Parliamentary approval, and programs that are set to expire for which no Government decision on the program’s future has been made. These are provided to give a more reasonable picture of the future of the Department.
| Programs and Internal Services | 2016–17 Main Estimates |
2016–17 Planned spending |
2017–18 Planned spending |
2018–19 Planned spending |
2016–17 Total authorities available for use | 2016–17 Actual spending (authorities used) |
2015–16 Actual spending (authorities used) | 2014–15 Actual spending (authorities used) |
|---|---|---|---|---|---|---|---|---|
| 1.1 Market Access and Diversification | 43,993,476 | 43,993,476 | 60,190,597 | 35,202,474 | 74,012,256 | 70,738,385 | 75,927,073 | 61,566,240 |
| 1.2 Innovation for New Products and Processes | 96,074,981 | 96,074,981 | 109,154,844 | 39,171,754 | 111,219,760 | 97,761,228 | 93,375,233 | 71,707,214 |
| 1.3 Investments in Natural Resource Sectors | 62,900,219 | 62,900,219 | 73,163,653 | 67,873,990 | 74,761,684 | 74,593,181 | 68,270,162 | 60,589,504 |
| 1.4 Statutory Programs – Atlantic Offshorea | 743,336,158 | 743,336,158 | 408,998,253 | 521,471,910 | 473,430,813 | 473,430,813 | 347,989,273 | 837,746,067 |
| 2.1 Energy-Efficient Practices and Low-Carbon Energy Sources | 183,336,817 | 183,336,817 | 183,461,546 | 137,174,523 | 213,996,763 | 177,431,795 | 211,012,423 | 291,745,439 |
| 2.2 Technology Innovation | 115,838,434 | 115,838,434 | 219,965,182 | 81,401,428 | 148,253,404 | 148,143,884 | 143,620,407 | 151,832,220 |
| 2.3 Responsible Natural Resource Management | 29,619,508 | 29,619,508 | 27,437,623 | 27,055,064 | 37,951,209 | 35,319,980 | 121,598,627 | 267,570,932 |
| 3.1 Protection for Canadians and Natural Resources | 57,808,743 | 57,808,743 | 70,418,079 | 59,079,852 | 79,900,579 | 79,879,094 | 73,709,947 | 65,692,439 |
| 3.2 Landmass Information | 75,092,662 | 75,092,662 | 49,150,177 | 45,914,237 | 93,523,442 | 74,793,210 | 74,110,670 | 78,469,116 |
| Subtotal | 1,408,000,998 | 1,408,000,998 | 1,201,939,954 | 1,014,345,232 | 1,307,049,910 | 1,232,091,570 | 1,209,613,815 | 1,886,919,171 |
| Internal Services | 184,517,755 | 184,517,755 | 138,006,496 | 113,341,893 | 167,923,770 | 125,907,344 | 125,564,854 | 162,499,616 |
| Total | 1,592,518,753 | 1,592,518,753 | 1,339,946,450 | 1,127,687,125 | 1,474,973,680 | 1,357,998,914 | 1,335,178,669 | 2,049,418,787 |
*a Statutory Programs – Atlantic Offshore: As per the various Atlantic Offshore Accords, the Government of Canada receives royalties for offshore oil and gas production and subsequently pays an equal amount to the provinces of Nova Scotia and Newfoundland and Labrador.
The overall $235 million difference between the 2016-17 Planned spending of $1,593 million and Actual spending of $1,358 million is attributed to a $118 million reduction in authorities and $117 million in unspent funding.
The $118 million reduction in authorities is explained by the following:
Decreases due to:
- Reduced authority for statutory payments under the Atlantic Offshore Accord Acts due to reduced oil prices from the time of forecasts which were done in the fall of 2015; and
- A transfer to Innovation, Science and Economic Development Canada related to the Sustainable Development Technology Fund.
Increases due to:
- Funding received through Supplementary Estimates mainly for Clean Growth and Climate Change, Federal Infrastructure Initiative (FII), Green Infrastructure, Soldier Settlement Board mineral rights, modernization of the National Energy Board, and marine protection program; and
- The receipt of the operating budget carry forward.
The $117 million in unspent funding is explained by the following:
- Funds frozen and not available for spending, as per Budget 2016, related to Professional Services, Advertising and Travel;
- Funding being moved into future years for Investments in Forest Industry Transformation, Oil Spill Response Science Program, UNCLOS, Gunnar Mine Remediation and Soldier Settlement Board;
- Unspent funds being carried forward to next year, mainly to cover unfunded collective bargaining increases and to support FII projects; and
- Unspent funds pertaining to the ecoENERGY for Biofuels program (due to lower than anticipated production by biofuel companies) and the ecoENERGY Renewable Power program (due to lower incentive payouts based on lower production levels).
Although there are differences, both the preceding graph and table show that 2017-18 Planned spending is similar to 2016-17 Actual expenditures.
For 2017-18 to 2019-20, both the graph and table show lower planned spending than 2016-17 actual expenditures. This is the result of fluctuations in the economic modeling for the Atlantic Offshore Accounts and the scheduled ending, or sunsetting, of existing programs (i.e. Clean Growth and Climate Change, FII, Green Infrastructure, Investments in Forest Industry Transformation, Forest Innovation Program and Expanding Market Opportunities). However, as reflected in the graph, the Department anticipates that some of these programs will be renewed or replaced and spending levels will be more comparable to past years.
For 2014-15, 2015-16 and 2016-17 the figures represent actual expenditures as reported in the Public Accounts. NRCan’s spending profile shows a significant drop in 2015-16 and 2016-17 compared to 2014-15, mainly as a result of the Statutory Atlantic Offshore Accounts, the transfer of responsibility over the Nuclear Legacy Liabilities Program and the Port Hope Area Initiative to Atomic Energy of Canada Limited, and reduced spending pertaining to the ecoENERGY for Biofuels and the ecoENERGY for Renewable Power programs. These reductions were slightly offset by the implementation of the FII.
Actual human resources
| Programs and Internal Services | 2014–15 Actual | 2015–16 Actual | 2016–17 Forecast |
2016–17 Actual | 2017–18 Planned | 2018–19 Planned |
|---|---|---|---|---|---|---|
| 1.1 Market Access and Diversification | 250 | 254 | 243 | 277 | 267 | 242 |
| 1.2 Innovation for New Products and Processes | 296 | 313 | 296 | 328 | 289 | 255 |
| 1.3 Investments in Natural Resource Sectors | 398 | 399 | 378 | 422 | 395 | 394 |
| 1.4 Statutory Programs – Atlantic Offshore* | 0 | 0 | 0 | 0 | 0 | 0 |
| 2.1 Energy-Efficient Practices and Low-Carbon Energy Sources | 278 | 264 | 101 | 265 | 252 | 162 |
| 2.2 Technology Innovation | 635 | 665 | 516 | 653 | 646 | 539 |
| 2.3 Responsible Natural Resource Management | 247 | 244 | 242 | 223 | 186 | 184 |
| 3.1 Protection for Canadians and Natural Resources | 478 | 474 | 427 | 435 | 414 | 404 |
| 3.2 Landmass Information | 385 | 383 | 408 | 387 | 386 | 378 |
| Subtotal | 2,967 | 2,996 | 2,611 | 2,990 | 2,835 | 2,558 |
| Internal Services | 946 | 940 | 936 | 906 | 922 | 882 |
| Total | 3,913 | 3,936 | 3,547 | 3,896 | 3,757 | 3,440 |
For 2014-15 and 2015-16, the figures represent actual FTEs as reported in their respective Departmental Results Reports. For 2016-17, the planned FTEs are as per the 2016-17 Departmental Plan and the 2016-17 actual FTEs reflect the actual FTEs for 2016-17.
For 2017-18 and 2018-19, the figures represent total planned FTEs to support NRCan program activities, approved by Treasury Board to support the Departmental strategic outcomes.
The decrease between 2016-17 and 2018-19 is mainly explained by the sunsetting of a number of major initiatives, which were explained in the Budgetary Performance Summary section.
As new initiatives are undertaken, plans for future FTE requirements will be adjusted accordingly.
Expenditures by vote
For information on the Department of Natural Resources Canada’s organizational voted and statutory expenditures, consult the Public Accounts of Canada 2017xxxviii.
Alignment of spending with the whole-of-government framework
Alignment of 2016-17 actual spending with the whole-of-government frameworkxxxix (dollars)
| Program | Spending area | Government of Canada activity | 2016–17 Actual spending |
|---|---|---|---|
| 1.1 Market Access and Diversification | Economic Affairs | Strong Economic Growth | 70,738,385 |
| 1.2 Innovation for New Products and Processes | Economic Affairs | Strong Economic Growth | 97,761,228 |
| 1.3 Investment in Natural Resource Sectors | Economic Affairs | Strong Economic Growth | 74,593,181 |
| 1.4 Statutory Programs – Atlantic Offshore | Economic Affairs | Strong Economic Growth | 473,430,813 |
| 2.1 Energy-Efficient Practices and Low-Carbon Energy Sources | Economic Affairs | A Clean and Healthy Environment | 177,431,795 |
| 2.2 Technology Innovation | Economic Affairs | A Clean and Healthy Environment | 148,143,884 |
| 2.3 Responsible Natural Resource Management | Economic Affairs | A Clean and Healthy Environment | 35,319,980 |
| 3.1 Protection for Canadians and Natural Resources | Social Affairs | A Safe and Secure Canada | 79,879,094 |
| 3.2 Landmass Information | Social Affairs | A Safe and Secure Canada | 74,793,210 |
| Spending area | Total planned spending | Total actual spending |
|---|---|---|
| Economic affairs | 1,275,099,593 | 1,077,419,266 |
| Social affairs | 132,901,405 | 154,672,304 |
| International affairs | -- | -- |
| Government affairs | -- | -- |
a Spending (Planned and Actual) related to the Internal Services are not included in this table.
Financial statements and financial statements highlights
Financial statements
NRCan’s consolidated financial statements (unaudited) for the year ended March 31, 2017, are available on the Departmental websitexl.
Financial statements — highlights
The consolidated financial statements are intended to provide a general overview of the Department’s financial position and operations and should be read in conjunction with NRCan’s consolidated financial statements.
The consolidated financial statements were prepared using the Government’s accounting policies which are based on Canadian public sector accounting standards and are therefore different from reporting on the use of authorities in other sections. Reconciliation between authorities used and the net cost of operations is set out in Note 3 of the Department’s consolidated financial statements.
| Financial information | 2016–17 Planned resultsa |
2016–17 Actual |
2015–16 Actual |
Difference (2016–17 actual minus 2016–17 planned) | Difference (2016–17 actual minus 2015–16 actual) |
|---|---|---|---|---|---|
| Total expensesb | 1,637,636,823 | 1,349,957,088 | 1,368,087,269 | (287,679,735) | (18,130,181) |
| Total revenues | 38,870,446 | 29,410,248 | 30,836,347 | (9,460,198) | (1,426,099) |
| Net cost of operations before Government funding and transfers | 1,598,766,377 | 1,320,546,840 | 1,337,250,922 | (278,219,537) | (16,704,082) |
a The 2016-17 Planned Results are derived from the amounts presented in the 2016-17 Consolidated Future-Oriented Statement of Operationsxli and included in NRCan’s 2016-17 Departmental Planxxxvii.
b Transferred operations are included in the 2015-16 total actual expenses, which comprise of $1,243,617,036 in total expense and $124,470,233 in net cost of transferred operations, as it relates to the transferred responsibilities of the Nuclear Legacy Liabilities Program and the Historic Waste Program to Atomic Energy of Canada Limited (AECL), which became effective on September 13, 2015.
Difference between 2016-17 Actual and Planned
For 2016-17, the difference in total actual expenses ($1,350 million) and planned results ($1,638 million) is $288 million, or 18% of overestimated expenses. This is mostly attributable to a $270 million decrease in Atlantic Offshore Statutory programs mainly due to lower offshore royalties than forecasted for the Newfoundland Offshore Petroleum Resource Revenue Fund (largely due to decreased oil prices), which resulted in lower transfer payments to other levels of government.
Difference between 2016-17 and 2015-16 Actuals
Total actual expenses were $1,350 million in 2016-17 compared to $1,368 million in 2015-16 for a net decrease of $18 million, or 1%. This net decrease is mainly explained by:
- A $141 million increase in Atlantic Offshore Statutory programs mainly due to an increase in oil production levels compared to 2015-16 actual spending therefore increasing transfer payments to other levels of government; offset by
- A $124 million decrease in total expenses for transferred operations from $124 million in 2015-16 to nil in 2016-17 due to the transfer of responsibilities from the Nuclear Legacy Liabilities Program and the Historic Waste Program to the AECL as of September 2015.
The chart presenting NRCan’s actual expenses by type for 2016-17 is available on the Departmental website.
| Financial Information | 2016–17 | 2015–16 | Difference (2016–17 minus 2015–16) |
|---|---|---|---|
| Total net liabilities | 405,786,013 | 432,291,969 | (26,505,956) |
| Total net financial assets | 244,655,407 | 257,773,468 | (13,118,061) |
| Departmental net debt | 161,130,606 | 174,518,501 | (13,387,895) |
| Total non-financial assets | 334,766,837 | 272,387,642 | 62,379,195 |
| Departmental net financial position | 173,636,231 | 97,869,141 | 75,767,090 |
Total net liabilities were $406 million in 2016-17, compared to $432 million in 2015-16, for a net decrease of $26 million or 6%. This variance is mainly attributable to a decrease of $29 million in accounts payable and accrued liabilities due to a $13.1 million decrease related to a payment to settle the Soldier Settlement Board mineral rights and a $12 million decrease in holdbacks under various contribution programs.
Total net financial assets were $245 million in 2016-17, compared to $258 million in 2015-16, for a net decrease of $13 million or 5%. This variance is attributable to the decrease in the Due from Consolidated Revenue Fund (CRF) of $14 million, which is related to the decrease in accounts payable at year-end.
The overall difference between the Total net liabilities and Total net financial assets are then reflected in the Departmental net debt.
Total non-financial assets, which include prepayments, inventory and tangible capital assets were $334 million in 2016-17, compared to $272 million in 2015-16 for a net increase of $62 million. This variance is mainly due to the increase in tangible capital assets due to betterments to buildings across Canada under the Federal Infrastructure Initiative.
The Total non-financial assets are then subtracted from the Departmental net debt to reflect the Departmental net financial position.
Page details
- Date modified: