
Natural Resources Canada Quarterly Financial Report (Unaudited) for the Quarter Ended December 31, 2012
Statement outlining results, risks and significant changes in operations, personnel and programs
1. Introduction
This quarterly financial report should be read in conjunction with the Main Estimates, Supplementary Estimates (A), Supplementary Estimates (B), and the Net Budgetary Authorities published on the Treasury Board Secretariat website, as well as Canada’s Economic Action Plan 2012 (Budget 2012). It has been prepared by management as required by section 65.1 of the Financial Administration Act and in the form and manner prescribed by Treasury Board. This quarterly financial report has not been subject to an external audit or review.
1.1 Authority, Mandate and Program Activities
Natural Resources Canada (NRCan) seeks to enhance the responsible development and use of Canada’s natural resources and the competitiveness of Canada’s natural resource sectors. The department is an established leader in science and technology in the fields of energy, forests, and minerals and metals and applies its expertise in earth sciences to build and maintain an up-to-date knowledge base of Canada’s landmass. NRCan develops policies and programs that enhance the contribution of the natural resource sectors to the economy and improve the quality of life of Canadians.Footnote 1
Further details on NRCan’s authority, mandate and program activities can be found in Part II of the 2012-2013 Main Estimates.
1.2 Basis of Presentation
This quarterly financial report has been prepared by management using an expenditure basis of accounting. The accompanying Statement of Authorities includes NRCan’s spending authorities granted by Parliament, and those used by NRCan are consistent with the Main Estimates, Supplementary Estimates (A) and Supplementary Estimates (B), as well as transfers from Treasury Board for the 2012-2013 fiscal year. This quarterly report has been prepared using a special purpose financial reporting framework.
The authority of Parliament is required before funds can be spent by the Government. Approvals are given in the form of annually approved limits through appropriation acts or through legislation in the form of statutory spending authority for specific purposes.
As part of the Parliamentary business of supply, the Main Estimates must be tabled in Parliament on or before March 1 preceding the new fiscal year. Budget 2012 was tabled in Parliament on March 29, after the tabling of the Main Estimates on February 28, 2012. As a result, the measures in Budget 2012 could not be reflected in the 2012-2013 Main Estimates.
In fiscal year 2012-2013, frozen allotments were established by Treasury Board authority in departmental votes to prohibit the spending of funds identified as savings measures in Budget 2012. The changes to departmental authorities for future years were implemented through the Annual Reference Level Update, as approved by Treasury Board, and reflected in the subsequent Main Estimates tabled in Parliament.
NRCan uses the full accrual method of accounting to prepare and present its annual unaudited departmental financial statements, which are part of the Departmental Performance Report. However, the spending authorities voted by Parliament remain on an expenditure basis.
2. Highlights of Fiscal Quarter and Fiscal Year-to-Date Results
This Departmental Quarterly Financial Report reflects the results as at December 31, 2012, including Main Estimates, Supplementary Estimates (A), Supplementary Estimates (B), the Operating Budget Carry Forward, the Capital Budget Carry Forward, the TB Vote 15 for Collective Agreements and the TB Vote 30 for Paylist Requirements for which full supply was released. The details presented in this report focus on and compare the third quarter results of 2012-2013 with those of 2011-2012.
Authorities
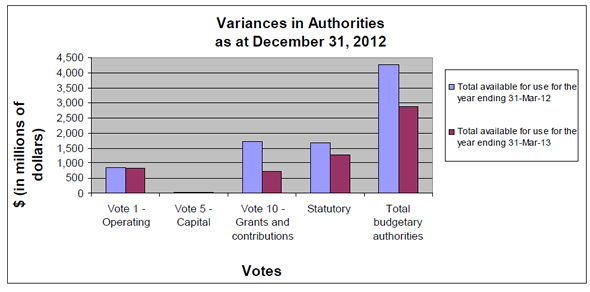
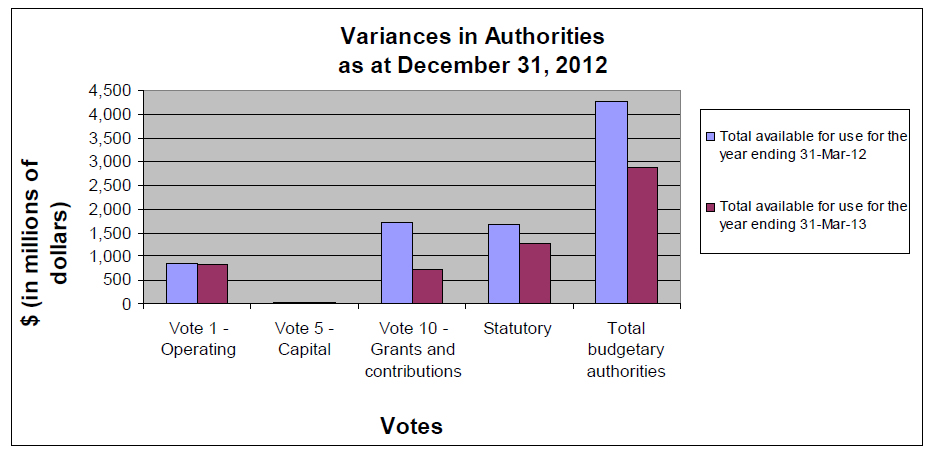
As per Table 1 presented at the end of this document, and Graph 1 below, as at December 31, 2012, NRCan had authorities available for use of $2,873.3 million in 2012-2013 compared to $4,262.0 million in 2011-2012, for a net decrease of $1,388.7 million or 32.6%.
Graph 1
Text version
| (in thousands of dollars) | Fiscal year 2011-2012 Total available for use for the year ending 31-Mar-12 |
Fiscal year 2012-2013 Total available for use for the year ending 31-Mar-13 |
|---|---|---|
| Vote 1 - Operating | 849 | 846 |
| Vote 5 - Capital | 24 | 31 |
| Vote 10 - Grants and contributions | 1,716 | 742 |
| Statutory | 1,673 | 1,254 |
| Total budgetary authorities | 4,262 | 2,873 |
The decrease of $1,388.7 million in authorities is explained by the net effect of both decreases and increases within operating expenditures, capital expenditures, grants and contributions, and statutory authorities, as per the following.
For operating expenditures, a net decrease of $3.5 million in authorities is explained by the following year-over-year changes:
Decreases:
- $31.5 million as a result of the transfer to Shared Services Canada as part of the Administrative Services Review;
- $13.1 million as part of a planned adjustment to the financial profile of the Clean Energy Fund;
- $12.7 million for the ecoENERGY Retrofit Homes program, as the program terminated on March 31, 2012;
- $11.7 million for the funding to defray operational expenditures of the AECL Restructuring Sector;
- $11 million for the Pulp and Paper Green Transformation Program as the three-year, $1 billion program terminated on March 31, 2012;
- $5.3 million for the Investing in offshore development – UNCLOS; and
- $15.8 million from resources available in Vote 1 – Operating due to the Budget 2012 Savings Measures, and used to reduce the amount of new appropriations required and identified in Supplementary Estimates (B).
Increases:
- $91.2 million for the Port Hope Area Initiative as part of a planned adjustment to the program financial profile;
- $10.6 million for the ecoENERGY Innovation Initiative;
- $3.1 million for the Forest Innovation Program and Expanding Market Opportunities Program; and
- $3.0 million for the funding related to government advertising programs.
For capital expenditures, a net increase of $7.8 million in authorities is explained by the following year-over-year changes:
Increases:
- $11.2 million for the revitalization of NRCan’s satellite station facilities across Canada; and
- $2 million for the Construction of the Canadian Forces Arctic Training Centre (CFATC).
Decreases:
- $2.7 million for the purchase of the land under the Port Hope Area Initiative; and
- $2.3 million for the relocation of the CANMET Materials Technology Laboratory (MTL) to Hamilton.
For grants and contributions, a net decrease of $974.4 million in authorities is explained by the following year-over-year changes:
Decreases:
- $538.6 million for the Pulp and Paper Green Transformation Program, as the three-year, $1 billion program terminated on March 31, 2012;
- $386.6 million for the ecoENERGY Retrofit Homes program, as the program terminated on March 31, 2012;
- $48.1 million for the ecoENERGY Technology Initiative and $21.8 million for the ecoENERGY for Biofuels program, the result of a planned adjustment to the programs’ financial profiles;
- $11.6 million net for the Non-reactor Based Isotope Supply program, which sunset on March 31, 2012. Funds committed in Budget 2012 for the successor Isotope Technology Acceleration Program are reflected in Supplementary Estimates (B);
- $8.3 million for the Forest Innovation Program and Expanding Market Opportunities Program;
- $122 million from resources available in Vote 10 – Grants and Contributions due to a reprofiling of funds and used to reduce the amount of new appropriations required and identified in Supplementary Estimates (A) and Supplementary Estimates (B), source of funds is existing programs which may be shown elsewhere in this report as having increased or decreased; and
- $19.1 million from resources available in Vote 10 – Grants and Contributions due to the Budget 2012 Savings Measures and used to reduce the amount of new appropriations required and identified in Supplementary Estimates (B).
Increases:
- $138 million for the Clean Energy Fund and $37.5 million for Sustainable Development Technology Canada (SDTC) for the Next Generation Biofuels Fund, reflecting adjustments to the financial profiles; and
- $19.8 million for the ecoENERGY Innovation Initiative.
For statutory items, a net decrease of $418.6 million in authorities is explained largely by:
Decreases:
- $436.1 million in the Newfoundland Offshore Petroleum Resource Revenue Fund and $43.9 million in the Nova Scotia Offshore Revenue Account, caused by fluctuations in oil and gas prices and production levels.
Increase:
- $59.3 million for the statutory grant to Sustainable Development Technology Canada for the Next Generation Biofuels Fund.
In addition to the above detail, there are other minor increases and decreases within the appropriated funding and in other statutory departmental programs.
Budgetary Expenditures by Standard Object
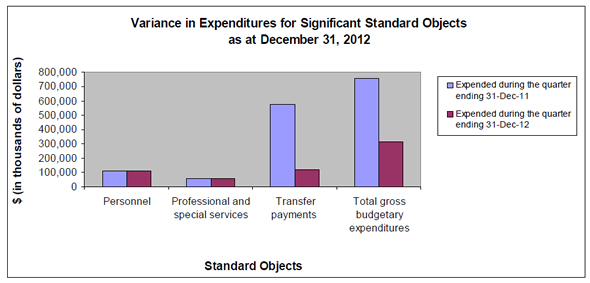
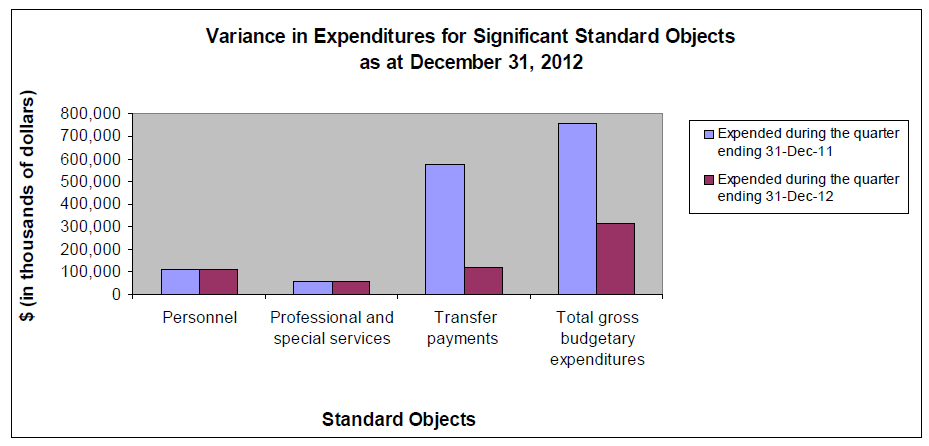
As at December 31, 2012, year-to-date spending amounts to $1,154.8 million or 40.2% of total funding available, compared to $1,842.0 million or 43.2% at the same time last year. The year-to-date decrease of $687.2 million in expenditures between 2012-2013 and 2011-2012 is represented in Graph 2 below and in Table 2 at the end of this document across significant standard objects.
The spending for the quarter ending December 31, 2012, amounts to $313.0 million or 10.9% of total funding available for the fiscal year, compared to $757.7 million or 17.8% for the same quarter last year. The decrease in expenditures for the quarter ending December 31, 2012, of $444.7 million between 2012-2013 and 2011-2012, is represented in Table 2 at the end of this document across significant standard objects.
Graph 2
Text version
| (in thousands of dollars) | Fiscal year 2011-2012 Expended during the quarter ending 31-Dec-11 |
Fiscal year 2012-2013 Expended during the quarter ending 31-Dec-12 |
|---|---|---|
| Personnel | 107,911 | 110,548 |
| Professional and special services | 58,548 | 57,029 |
| Transfer payments | 577,842 | 121,479 |
| Total gross budgetary expenditures | 757,733 | 312,998 |
Personnel expenditures are comparable in the third quarter of 2011-2012 ($107.9 million) and 2012-2013 ($110.5 million) with a net increase of $2.6 million.
The year-to-date personnel expenditures represent a net decrease of $11.0 million from $348.5 million in 2011-2012 to $337.4 million in 2012-2013, mainly related to the transfer of 76 positions to Shared Services Canada and the reduction of positions in the NRCan restructuring and Budget 2012 Savings Measures exercises.
The decrease of $1.5 million in expenditures for professional and special services between the third quarter of 2012-2013 and 2011-2012 is explained by the following:
- Increase of $1.3 million for contract work and payments under programs (e.g., the Nuclear Legacy Liabilities Program);
- Increase of $1.1 million for the Targeted Geoscience Initiative 4;
- Offset by the decrease of activities for the transfer to Shared Services Canada.
The year-to-date expenditures on professional and special services increased by $19.9 million and relate mainly to the same reasons as above in addition to the following:
- $7.8 million for contract work and payments under programs (e.g., the Nuclear Legacy Liabilities Program) approved by Parliament at the end of June 2011 that are more advanced in the third quarter of 2012-2013 than in the third quarter last year;
- $3.7 million for the Port Hope Area Initiative resulting from increased activities in 2012-2013;
- $2.5 million for ecoENERGY Clean Energy Renewal programs resulting from increased activities in 2012-2013; and
- Increases resulting from achievement of more contract milestones requiring payment in 2012-2013 as compared to 2011-2012 in such programs as Geo-mapping for Energy and Minerals, Targeted Geoscience Initiative 4 and the Polar Continental Shelf Program in Resolute Bay; offset by the decrease of activities for the transfer to Shared Services Canada.
Transfer payments decreased by a net $456.4 million between the third quarters of 2012-2013 and 2011-2012, generally reflecting the changes in annual funding authorities previously explained, such as:
Decreases:
- $146.1 million related to the Pulp and Paper Green Transformation Program, as the program expired on March 31, 2012;
- $24.1 million in Clean Energy Fund transfers, resulting from delays in payment processing;
- $15.8 million for the ecoENERGY Retrofit Homes program, as the program terminated on March 31, 2012;
- $11.2 million for the ecoENERGY for Biofuels program;
- $213.4 million for the payment to the Newfoundland Offshore Petroleum Resource Revenue Fund. This statutory payment mirrors royalty revenues collected in relation to offshore oil and gas activity and fluctuate based on oil and gas prices and production levels; and
- $35.2 million for the payment to the Nova Scotia Offshore Revenue Account. This statutory payment mirrors royalty revenues collected in relation to offshore oil and gas activity and fluctuate based on oil and gas prices and production levels.
Year-to-date transfer payments decreased by a net $681.2 million between the fiscal years of 2012-2013 and 2011-2012, as a result of:
Decreases:
- $304.8 million related to the Pulp and Paper Green Transformation Program;
- $295.3 million for the payment to the Newfoundland Offshore Petroleum Resource Revenue Fund;
- $53.5 million for the payment to the Nova Scotia Offshore Revenue Account;
- $41.5 million in the Clean Energy Fund transfers;
- $15.8 million for the ecoENERGY Retrofit Homes program, as the program terminated on March 31, 2012;
- $14.0 million for the ecoENERGY for Biofuels program;
- $14.0 million related to the Isotopes Supply Initiative, as the program expired on March 31, 2012; and
- $5.5 million for the ecoENERGY Technology Initiative.
Increases:
- $57.8 million pertaining to Nova Scotia Crown Share Adjustment Payments. This amount represents NRCan's initial payments to Nova Scotia under the Crown Share Adjustment statutory provision of the Canada Nova Scotia Offshore Petroleum Resources Accord Implementation Act and covers accrued adjustment payment entitlements related to previous years; and
- $8.3 million for the ecoENERGY Renewable Power program due to increased payments in 2012-2013.
3. Risks and Uncertainties
NRCan manages a number of risks, the most prominent of which are identified in its Corporate Risk Profile. Some of these risks are financial, such as those arising from the delivery of large projects based on partnerships or grants and contributions programs; others are driven by operating budget constraints. Risks associated with the implementation of Budget 2012 Savings Measures are discussed in the section ‘Budget 2012 Implementation’. These risks are being monitored and managed on an ongoing basis.
Some of NRCan’s risks stem from lower-than-anticipated economic growth, which has, in some cases, affected the pace at which projects based on partnerships with external stakeholders and industry – for example joint research, development and demonstration projects – can be implemented. NRCan has mitigated the financial impacts by closely tracking program uptake, following best practices in accordance with the Financial Administration Act and requesting the reprofiling of funds, as required, to ensure program objectives are met over the life of programs.
Additionally, NRCan manages some uncertainty, albeit less than in previous quarters, related to employee departures and the provision of transition support measures as part of the implementation of Budget 2012 Savings Measures. It mitigates related financial risks through scenario planning, close tracking of workforce adjustment progress, and regular adjustments to its salary forecast. The Department continues to provide support to all of its employees affected by the Budget 2012 Savings Measures and other cost-containment initiatives.
Finally, NRCan is closely monitoring its operating budget by conducting a comprehensive monthly analysis of trends and forecasting in salary expenditures and non-salary expenditures, and detailed quarterly reviews, to ensure affordability and sustainability. To further reduce risks associated with budgeting and forecasting, the Department continues to provide employees with financial system-related training, as needed.
4. Significant Changes in Relation to Operations, Personnel, Programs
Information on the impact of Budget 2012 can be found in the section ‘Budget 2012 Implementation’ below. As in the previous Quarterly Financial Reports, Budget 2012 announcements are situated within a broader context of diminishing departmental resources, arising from a number of factors, including the anticipated sunsetting or reduction over time of a number of large programs, including grants and contributions.
As previously reported, an Order-In-Council (P.C. 2011-1297) was signed on November 15, 2011, to transfer to Shared Services Canada the responsibility for providing email, data centre and network services from a number of organizations across the Government of Canada, including NRCan. During the third quarter, NRCan continued to work in partnership with Shared Services Canada to implement these changes.
The majority of employees affected by Budget 2012 Savings Measures and the NRCan restructuring notified the department of their decision to leave the federal work force or become a surplus employee during the quarter ending December 31, 2012.
5. Budget 2012 Implementation
This section provides an overview of the measures announced in Budget 2012, which aims to refocus government and programs, make it easier for Canadians and business to deal with their government, and modernize and reduce back office-related activities.
NRCan’s budget has been adjusted to implement ongoing annual savings of $107 million by 2014-2015, together with an annual savings of $5 million associated with the International Assistance Envelope horizontal review. In achieving this, NRCan will be focussing on its core roles and responsibilities. Internal corporate services are being reduced and NRCan’s organizational structure and operations are being streamlined.
In the first year of implementation, NRCan will achieve savings of $67.8 million. Savings will increase to $84.7 million in 2013-2014 and $107 million in 2014-2015 and future years. In addition, annual savings of $5 million beginning in 2012-2013 will be achieved through the International Assistance Envelope horizontal review.
In implementing these changes, NRCan has made it a priority to treat its employees with transparency and fairness.
Original signed by
____________________________
Serge P. Dupont
Deputy Minister
February 27, 2013
Ottawa, Canada
Original signed by
____________________________
Thérèse Roy, CPA,CA
Acting Chief Financial Officer
February 27, 2013
Ottawa, Canada
| (in thousands of dollars) | Fiscal year 2012-2013 | Fiscal year 2011-2012 | ||||
|---|---|---|---|---|---|---|
| Total available for use for the year ending * March 31, 2013 | Used during the quarter ended December 31, 2012 | Used year-to-date at Quarter-end | Total available for use for the year ending*, ** March 31, 2012 | Used during the quarter ended ** December 31, 2011 | Used year-to-date at ** Quarter-end | |
| Vote 1 - Net Operating Expenditures | 845,878 | 169,692 | 485,811 | 849,381 | 159,249 | 495,324 |
| Vote 5 - Capital Expenditures | 31,357 | 6,871 | 11,406 | 23,538 | 5,730 | 8,494 |
| Vote 10 - Grants and Contributions | 742,019 | 79,673 | 196,026 | 1,716,388 | 289,395 | 588,023 |
| Statutory Payments | ||||||
| Minister of Natural Resources – Salary and motor car allowance |
78 | 18 | 58 | 78 | 58 | 58 |
| Contributions to employee benefit plans | 59,716 | 14,929 | 44,787 | 58,743 | 14,686 | 44,058 |
| Collection agency fees under sec 17.1 of the Financial Administration Act |
- | - | 19 | - | - | - |
| Refund of Previous Years Revenue | - | - | - | - | 87 | 87 |
| Spending of amounts equivalent to proceeds from disposal of surplus crown assets |
- | 6 | 8 | - | 82 | 82 |
| Grant to the Canada Foundation for Sustainable Development Technology |
59,338 | - | - | - | - | - |
| Contribution to the Canada/Newfoundland Offshore Petroleum Board |
7,756 | 441 | 4,259 | 6,825 | 1,547 | 2,531 |
| Contribution to the Canada/Nova Scotia Offshore Petroleum Board |
3,450 | 889 | 2,663 | 3,400 | 913 | 2,588 |
| Payments to the Nova Scotia Offshore Revenue Account |
135,846 | 10,327 | 42,665 | 179,663 | 45,533 | 96,158 |
| Payments to the Newfoundland Offshore Petroleum Resource Revenue Fund |
987,902 | 30,150 | 309,288 | 1,423,982 | 243,547 | 604,579 |
| Crown Share Adjustment Payments for Nova Scotia Offshore Petroleum Resources |
- | - | 57,775 | - | - | - |
| Total Statutory Payments | 1,254,086 | 56,761 | 461,522 | 1,672,691 | 303,359 | 750,141 |
| Total Budgetary Authorities | 2,873,339 | 312,997 | 1,154,765 | 4,261,998 | 757,733 | 1,841,982 |
* Includes only authorities available for use and granted by Parliament at quarter-end: Main Estimates, Supplementary Estimates (A) and Supplementary Estimates (B).
** Includes amounts incurred on behalf of Shared Services Canada from the date of transfer of November 15 to December 31, 2011. It is not possible to reasonably estimate the amount of expenditures incurred on behalf of Shared Services Canada.
| (in thousands of dollars) | Fiscal year 2012-2013 | Fiscal year 2011-2012 | ||||
|---|---|---|---|---|---|---|
| Planned expenditures for the year ending March 31, 2013 | Expended during the quarter ended December 31, 2012 | Year-to-date used at Quarter end | Planned expenditures for the year ending *March 31, 2012 | Expended during the quarter ended* December 31, 2011 | Year-to-date used at *Quarter-end | |
| Budgetary Expenditures: | ||||||
| Personnel | 422,390 | 110,548 | 337,447 | 431,717 | 107,911 | 348,487 |
| Transportation and communication | 41,516 | 4,717 | 11,838 | 39,168 | 6,915 | 17,586 |
| Information | 8,379 | 3,240 | 6,264 | 9,466 | 4,558 | 5,419 |
| Professional and special services | 377,438 | 57,029 | 147,494 | 387,466 | 58,548 | 127,635 |
| Rentals | 16,827 | 3,019 | 13,788 | 11,896 | 3,242 | 10,232 |
| Repair and maintenance | 6,863 | 867 | 1,692 | 5,756 | 864 | 1,794 |
| Utilities, materials and supplies | 23,403 | 3,693 | 9,759 | 21,916 | 4,003 | 10,637 |
| Acquisition of land, buildings and works | 31,357 | 3,296 | 6,815 | 23,538 | 222 | 5,136 |
| Acquisition of machinery and equipment | 34,127 | 4,098 | 6,470 | 28,161 | 5,941 | 10,097 |
| Transfer payments | 1,936,311 | 121,479 | 612,675 | 3,330,258 | 577,842 | 1,293,880 |
| Other subsidies and payments | 8,062 | 5,464 | 15,499 | 6,528 | (6,106) | 27,020 |
| Total Budgetary Expenditures | 2,906,673 | 317,450 | 1,169,741 | 4,295,910 | 763,940 | 1,857,923 |
| Less: | ||||||
| Total Revenues Netted Against Expenditures | 33,333 | 4,452 | 14,976 | 33,912 | 6,207 | 15,941 |
| Total Net Budgetary Expenditures | 2,873,339 | 312,998 | 1,154,765 | 4,261,998 | 757,733 | 1,841,982 |
* Includes amounts incurred on behalf of Shared Services Canada from the date of transfer of November 15 to December 31, 2011. It is not possible to reasonably estimate the amount of expenditures incurred on behalf of Shared Services Canada.
Page details
- Date modified: