
NORTH AMERICAN NATURAL GAS MARKET: 2014-2015 HEATING SEASON OUTLOOK
EXECUTIVE SUMMARY
For the current winter heating season, running from November 1, 2014 to March 31, 2015, consumers can expect relatively low natural gas prices compared to historical averages and also relative to competing heating fuels.
An average of industry consultants’ forecasts suggests Alberta wholesale natural gas prices (AECO) could average $3.93 per Gigajoule (GJ) or $0.15/m3 over the coming heating season. By comparison over the past decade, natural gas averaged $5.32/GJ, auto propane averaged $25.04/GJ and furnace oil averaged $23.61/GJ. Note that natural gas prices are wholesale prices – prices at the retail level will be higher, reflecting distribution charges, taxes, and other costs.
Main Factors Affecting 2014/2015 Heating Season Natural Gas Prices
Text version
Figure 1
An illustration of a teeter-totter tilting toward the right. Balloons are attached to the left end of the board, and weights are attached to the right. The balloons contain factors that increase (pulling up) the price of natural gas. Factors increasing the price of natural gas include: ‘Below average level of gas currently in storage’, and ‘Greater gas demand during heating season’. The weights contain factors that decrease (pulling down) the price of natural gas. Factors decreasing the price of natural gas include: ‘Abundant North American gas supply and high production’, ‘Above average input to gas storage’, ‘Declining gas exports to the U.S.’, and ‘Modest economic growth’. The fulcrum of the teeter-totter contains the 2014-15 heating season forecasted wholesale price of $3.93/GJ.
INTRODUCTION
In Canada, natural gas is used by residential and commercial users as a source of space heating, water heating, clothes drying, and cooking. Over 50% of space heating and 65% of water heating in Canadian homes is fueled by natural gas. For Canadian businesses, over 80% of both space and water heating is provided by natural gas.
Wholesale natural gas commodity prices are determined by the market forces of supply and demand. For most Canadian consumers, changing natural gas commodity prices will eventually result in a corresponding change in consumer prices. However, the change will be less in percentage terms, as the cost of the gas commodity is only part of the gas bill, which also includes charges for transmission and delivery (see Understanding Your Natural Gas Bill).
Understanding Your Natural Gas Bill
A consumer natural gas bill includes:
- The commodity charge;
- Long-haul pipeline transmission charges;
- Local distribution and storage charges; and,
- Taxes
The commodity charge is typically the wholesale price of natural gas in a producing area, and fluctuates with changing supply and demand.
The remaining charges cover the costs of transporting the gas from supply basins to demand centers and then to consumers via local distribution companies.
In most provinces, consumers can either purchase the natural gas commodity from a local distribution company, who buy gas on an on-going basis and bill consumers the same price paid to suppliers; or from a broker or marketer, who instead offer fixed rates to consumers for a set period of time.
For more information, refer to NRCan’s FAQs about natural gas prices
NATURAL GAS SUPPLY
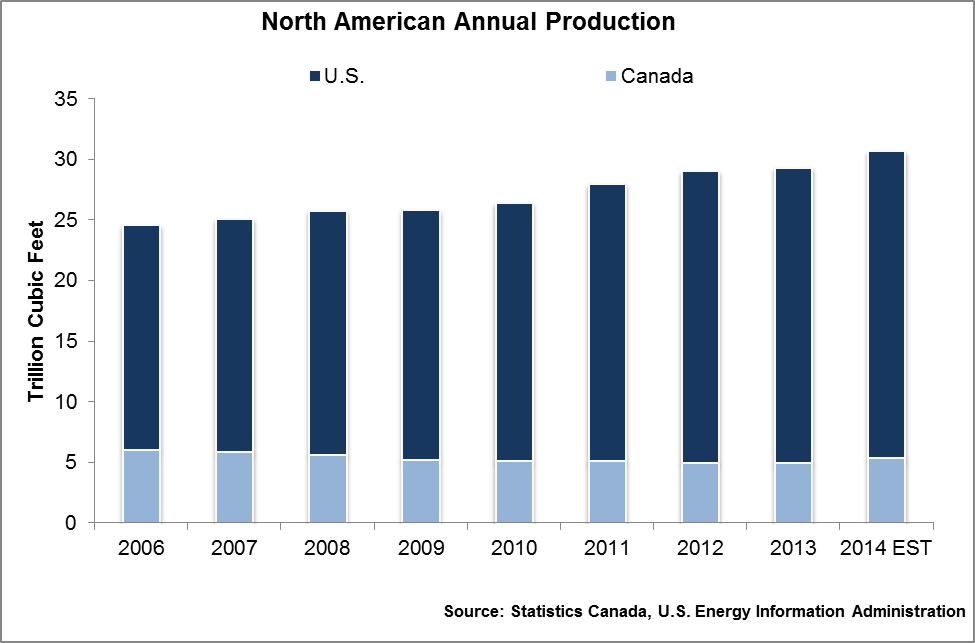
Canada is part of a fully-integrated North American natural gas market where natural gas flows seamlessly across borders from supply basins to demand centers. North American natural gas supply continued to grow in 2014, albeit at a slower pace than in recent years. Canada’s National Energy Board’s (NEB) natural gas deliverability mid-range case projects that Canadian natural gas production will rise between 2013 and 2014 by 2.9% and then by an additional 0.7% between 2014 and 2015.Footnote 1 The U.S. Energy Information Administration (EIA) predicts U.S. natural gas production will increase by 5.4% in 2014 and by an additional 2% in 2015.Footnote 2
Increasing natural gas production from deeper, higher productive, liquids-rich wells, is outpacing the decline in conventional production. Higher production per well is driven by the increased use of horizontal drilling and hydraulic fracturing. The average length drilled per well in 2013 was a record 3,444 metres.
Text version
Figure 2
A bar graph of the annual natural gas production in Canada and the United States (U.S.) from 2006 to 2014 (estimate). The graph shows that overall North American natural gas production has been climbing since 2006, albeit at a slower pace in recent years.
As Canadian shale gas is more extensively developed in the future and as Canada pursues liquefied natural gas exports, many analysts project further growth in total Canadian natural gas production.
NATURAL GAS STORAGE
In the summer, when natural gas demand is low, gas is injected into underground storage facilities so that it may be easily withdrawn during the peak demand winter months. Canada’s underground storage facilities can store over 30% of Canada’s annual natural gas demand. In addition, storage capacity has been increasing at a rate of about 5% per year over the past decade.
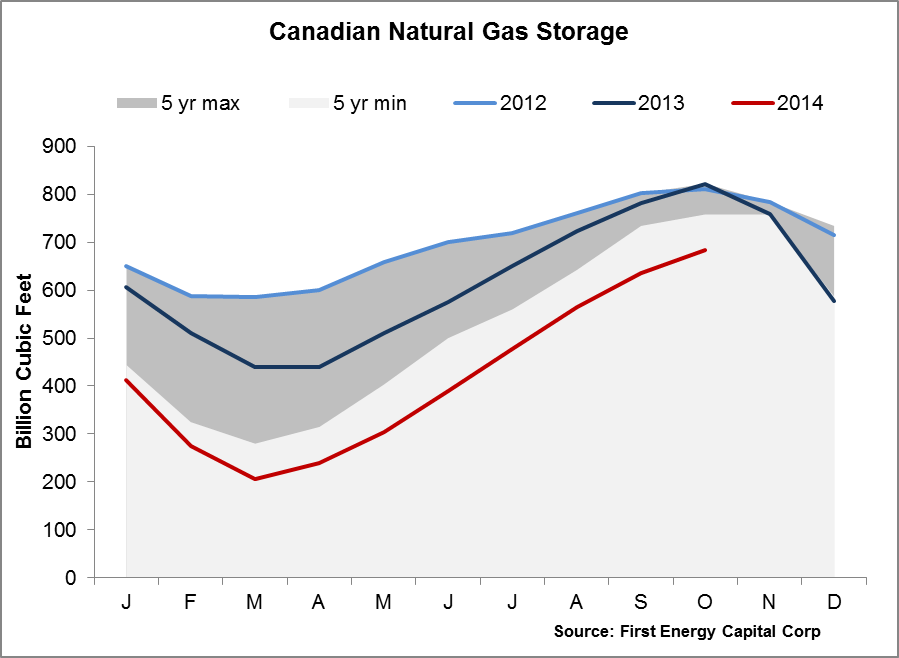
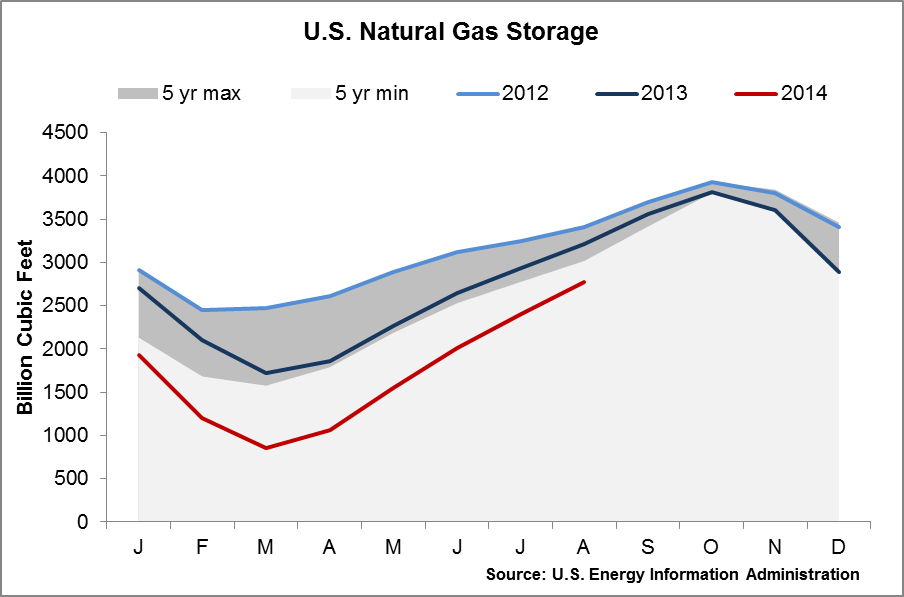
The winter of 2013-2014 was unusually cold and long in North America, depleting natural gas storage inventories more than usual. However, the winter was followed by a relatively mild summer. With less demand for natural gas for power generation to run air conditioners, more gas was available to refill storage inventories. Despite above average storage injections this year, both Canada and the U.S. are entering the winter of 2014-2015 with storage levels 14.2% and 8.3% below their five-year minimums, respectively.
Text version
Figure 3
Figures 3 and 4 are line graphs that show Canadian and United States (U.S.) natural gas storage levels by month for 2012, 2013, and 2014 (year to date). Canada and the U.S. storage levels in 2014 are below their five-year minimums.
Text version
Figure 4
Figures 3 and 4 are line graphs that show Canadian and United States (U.S.) natural gas storage levels by month for 2012, 2013, and 2014 (year to date). Canada and the U.S. storage levels in 2014 are below their five-year minimums.
It is important to note that the overall storage shortfall in Canada is almost entirely in Western Canada, a gas producing region with ample pipeline supply capabilities. In Eastern Canada, a major consuming region, storage facilities are already slightly above previous record levels.Footnote 3 Many natural gas utilities have also taken steps to facilitate natural gas supply and delivery should Canada experience another cold winter by contracting for more firm pipeline transportation service or developing the capability to truck-in compressed or liquefied natural gas to regions with limited pipeline capacity.
DEMAND FOR NATURAL GAS
Domestic demand for natural gas is split amongst a variety of sectors. Industrial demand (including gas used in oil sands extraction) is highest, at 41%, followed by residential at 20%, electricity generation at 18%, and commercial at 15%. Transportation and agriculture make up the remaining 5% of demand.
Over the coming heating season, industrial demand will be primarily impacted by prevailing economic conditions, while residential and commercial demand will be affected by winter space heating requirements.
WEATHER
Residential and commercial customers consume 35% of delivered natural gas in Canada, primarily for space heating. More than half of Canadian homes and 80% of Canadian businesses rely on natural gas as their space heating fuel.
Abnormal weather can be a strong driver of natural gas demand and resulting market prices. An unusually cold winter tends to put upward pressure on natural gas prices, while a mild winter tends to lead to weaker demand which helps moderate prices.
Text version
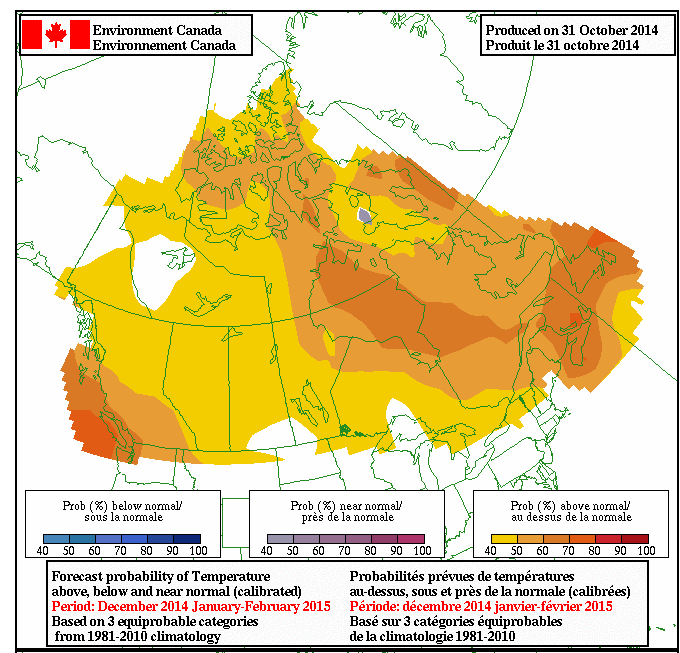
Figure 5
This graphic is Environment Canada’s temperature outlook for December, January and February. The outlook shows forecasts for normal and above average temperatures for most of the country.
Environment Canada’s temperature outlook for December, January, and February predicts normal and above average temperatures for most of the country.Footnote 4 As a result, Canadian weather is not expected to have a large impact on prices.
The National Oceanic and Atmospheric Administration (NOAA) U.S. winter outlook predicts below average temperatures in parts of the south-central and southeastern U.S., but above-average temperatures in the western U.S., Alaska, Hawaii, and New England.Footnote 5 The U.S. EIA is projecting lower residential and commercial natural gas consumption this winter over last winter.Footnote 6
ECONOMIC CONDITIONS
With industrial users accounting for 41% of Canada’s natural gas demand, and with industrial activity heavily influenced by economic conditions, the state of the economy can affect natural gas prices.
The Bank of Canada’s October 2014 Monetary Policy Report outlook is for “stronger momentum” in the global economy, but differs across regions and remains reliant on stimulus. In 2015, the Canadian economy is expected to grow by 2.5% while the U.S. economy is expected to grow by 2.9%.Footnote 7 With modest economic growth this heating season, industrial demand growth is not expected to be a major influence on the price of natural gas.
EXPORTS & IMPORTS
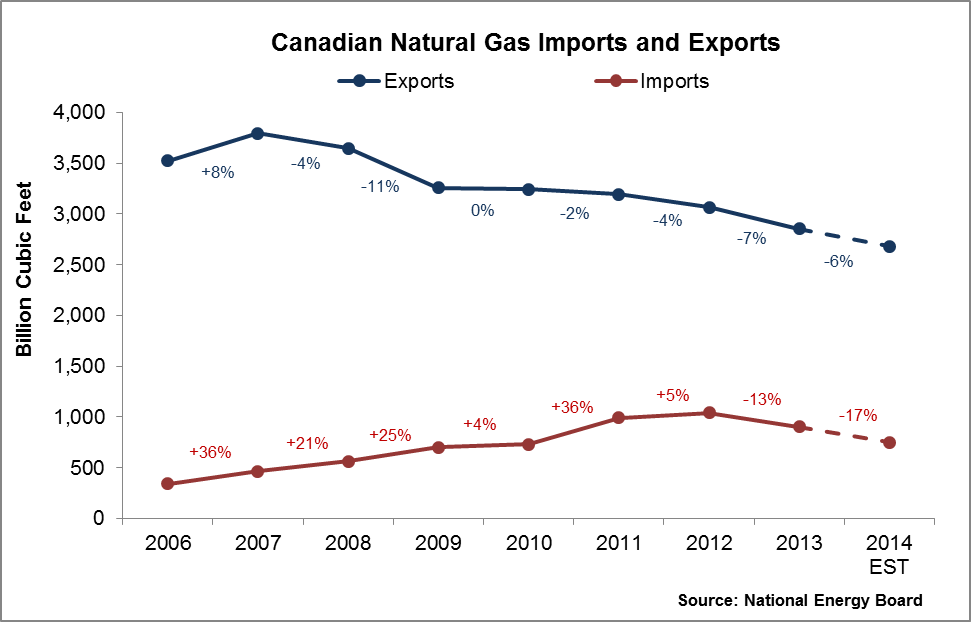
Canadian natural gas exports continue to decline. 100% of Canada’s exports are destined to the U.S., and with its own burgeoning supply, the U.S. is relying less on Canadian natural gas to meet its domestic demand. As of September 2014, year-to-date Canadian exports to the U.S. are 6.1% lower than at the same time last year.
Text version
Figure 6
A line graph of annual Canadian natural gas exports and imports between 2006 and 2014 (year to date). A blue line, representing Canada’s natural gas exports to the United States (U.S.), shows a 20% decline between 2006 and 2013 as well as an additional 6% decline in 2014 when compared to its September cumulative figures from the previous year. A red line, representing Canada’s natural gas imports from the U.S., shows a 80% increase between 2006 and 2013 and a 17% decline in 2014 when compared to its September cumulative figures from the previous year.
Canadian consumers are importing less gas from the U.S. than in 2013. Year-to-date imports (as of September) are 16.9% lower than the same time last year. This continues the trend reversal, first seen last year, of significant natural gas import growth.
Overall, from 2009 to 2013, Canadian gas exports to the U.S. have declined by 12% and imports from the U.S. have increased by 28%, yielding a 24% decline in net exports.
SHORT-TERM PRICE OUTLOOK
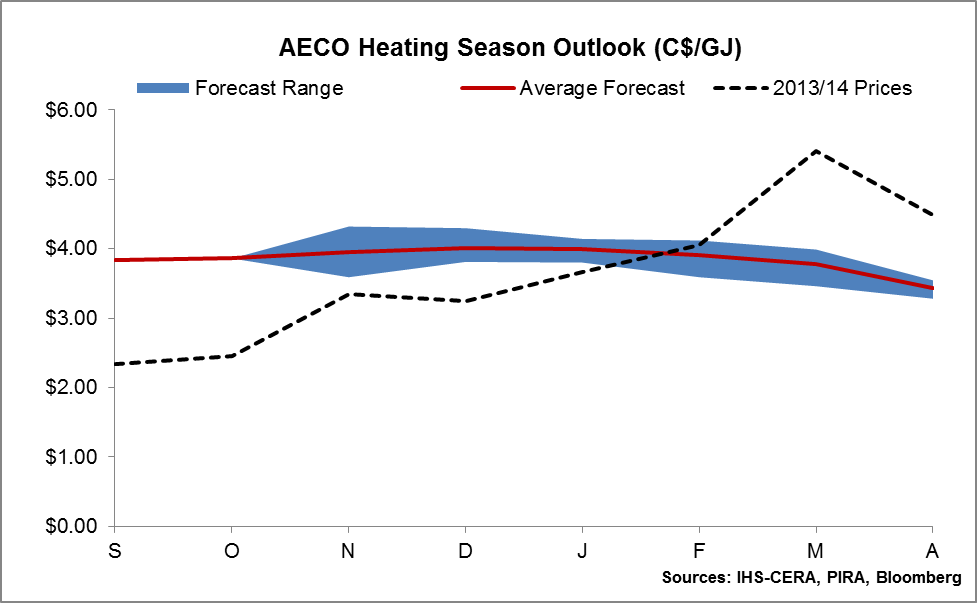
Based on a consolidation of selected expert consultants’ forecasts, benchmark Alberta wholesale natural gas prices (AECO) are expected to increase slightly moving into the winter heating season.
The average of the consolidated forecasts is $3.93/GJ or $0.15/m3 over the 2014-2015 heating season. The range of individual forecasts was from $3.78/GJ to $4.01/GJ over this period. If this outlook is realized, natural gas prices would be very similar to last year’s heating season, which saw an average price of $3.94/GJ, but with less variability.
Text version
Figure 7
A line graph forecasting the AECO price for the 2014-15 heating season. The graph features average monthly prices between September and April (which includes heating season prices between November and March). A dashed line indicates prices from last year’s heating season which averaged $3.94/GJ. A red line indicates the forecast prices for this year’s heating season which are expected to average $3.93/GJ. Contrary to last year’s AECO prices, the forecast for this year indicates lower prices in April than in September.
For the 2015 calendar year, the consultants forecast lower natural gas prices, projecting an average price of $3.56/GJ. This represents a 15% decrease from the projected average price of $4.20/GJ for the 2014 calendar year.
Overall, for the 2014-2015 winter heating season, Canadian consumers can expect similar prices to last year, with less variability, and a return to even lower prices in 2015 both compared to historical prices and relative to other heating fuels.
LINKS TO OTHER USEFUL RESOURCES AND HEATING OUTLOOKS
National Energy Board Energy Outlooks
(www.neb-one.gc.ca/nrg/ntgrtd/index-eng.html)
U.S. Energy Information Administration Short Term Energy Outlook
(www.eia.gov/forecasts/steo/)
Environment Canada Seasonal Forecasts
(www.weather.gc.ca/saisons/)
U.S. National Weather Service Forecasts
(www.cpc.ncep.noaa.gov/)
Canadian Gas Association Publications
(www.cga.ca/resources/publications/)
Footnotes
- Footnote 1
-
National Energy Board, Short-term Canadian Natural Gas Deliverability 2014-2016 - An Energy Market Assessment, May 2014. http://www.neb-one.gc.ca/nrg/sttstc/ntrlgs/rprt/ntrlgsdlvrblty20142016/ntrlgsdlvrblty20142016-eng.pdf (p. 8) [PDF]
- Footnote 2
-
U.S. EIA, Short Term Energy and Winter Fuels Outlook, October 2014. http://www.eia.gov/forecasts/steo/archives/oct14.pdf (p. 8) [PDF]
- Footnote 3
-
Canadian Gas Association, Pre-Heating Season Update. October 2014. http://www.cga.ca/wp-content/uploads/2011/02/CGA_bulletin_Pre-Heating_-EN.pdf (p. 5) [PDF]
- Footnote 4
-
Environment Canada, Temperature and Precipitation Probabilistic Forecasts. October 2014. http://weather.gc.ca/saisons/image_e.html?img=s234pfe1t_cal&bc=prob
- Footnote 5
-
National Oceanic and Atmospheric Administration, National Weather Service, Climate Prediction Center, U.S. Winter Outlook. October 2014. http://www.cpc.ncep.noaa.gov/products/predictions/90day/fxus05.html
- Footnote 6
-
U.S. EIA, Short Term Energy and Winter Fuels Outlook, October 2014. http://www.eia.gov/forecasts/steo/archives/oct14.pdf (p. 8) [PDF]
- Footnote 7
-
Bank of Canada Monetary Policy Report, October 2014. http://www.bankofcanada.ca/wp-content/uploads/2014/07/mpr-2014-10-22.pdf
Page details
- Date modified: