
Additional Statistics on Energy
- Canada has a vast and diversified portfolio of energy resources. Taking advantage of this endowment, Canada produces large quantities of energy for both domestic consumption and export. It is also an energy-intensive country, given its northern climate, vast territory, industrial base and high standard of living.
- Canada’s production of “primary” energy – i.e. energy found in nature before conversion or transformation – totalled 16 494.5 petajoules (PJ) in 2010. Fossil fuels accounted for the greatest share of this production, with crude oil representing 41.4 percent; natural gas, 36.5 percent; and coal, 9.2 percent. Renewable energy sources were also important, with hydroelectricity representing 7.5 percent; biomass, 3.5 percent; and emerging forms (e.g. wind, tidal and solar), 0.1 percent. Nuclear energy (generated from the primary source of uranium) accounted for 1.9 percent.Footnote 1
- On a regional basis, Alberta accounted for 62.8 percent of Canada’s primary energy production. Other leading energy provinces were British Columbia (14.1 percent), Saskatchewan (8.7 percent), Quebec (4.1 percent) and Ontario (2.7 percent). Alberta is the leading producer of fossil fuels, Quebec is the largest producer of hydroelectricity, and Ontario is the largest producer of nuclear energy.
- Crude oil proved reserves (recoverable under current technological and economic conditions) at the end of 2010 were estimated at 27.6 billion cubic metres (bcm) – providing Canada with the third most important resource base, after Saudi Arabia and Venezuela. Oil sands represented the majority of these reserves with 26.9 bcm, while conventional sources amounted to 0.7 bcm. The ultimate resource potential (recoverable as technology improves) from the Alberta oil sands is estimated to be more than 50.0 bcm.
- Production of crude oil in Canada totalled 167.4 million m3 in 2010. Oil sands accounted for 51.9 percent of production, exceeding conventional sources for the first time.
- About two thirds of crude oil production is exported, while the balance is processed by Canadian refineries into refined petroleum products, such as gasoline, diesel and heating oil. Canadian refineries – especially those far from major domestic production areas – also process imported crude oil purchased on the international market.
- Natural gas proved reserves at the end of 2010 totalled 1 727.5 bcm. Of this amount, about 95 percent is from conventional sources, and the remainder is from unconventional sources (such as coal bed methane and shale gas). The total potential from conventional resources is estimated to be 10.1 trillion cubic metres (tcm), while recent estimates suggest that the potential from unconventional resources is in the range of 10.7 to 26.8 tcm.
- Marketable production of natural gas in Canada amounted to 144.4 bcm in 2010. Close to two thirds of this production was exported to the United States (U.S.), and the balance was sold to Canadian consumers.
- Electricity generation in Canada amounted to 588.9 terawatt hours in 2010. Canada’s abundant water resources provided a significant contribution in this regard, as hydroelectricity represented 59.1 percent of total generation. Meanwhile, other emerging forms of renewable electricity (i.e. biomass, wind, solar and tidal) contributed to 3.0 percent of generation. Other sources of electricity supply included coal (12.6 percent), nuclear (14.5 percent), natural gas (8.6 percent) and petroleum products and waste (2.2 percent).
- Quebec accounted for 31.5 percent of electricity generated in Canada in 2010 (96.0 percent from hydro), and Ontario accounted for 25.6 percent (54.4 percent from nuclear sources).
- Canadians use energy for several purposes: to heat and cool their homes and offices, to power appliances and equipment, to transport people and goods and for industrial processes.
- Secondary energy consumption in Canada is the energy used by final consumers in various sectors of the economy; and hence excludes exports, energy consumed by energy producers, and non-energy uses. In 2009, secondary energy use accounted for about 71.8 percent of total energy use, which is equivalent to 8541.6 PJ. The industrial sector constituted 37.1 percent of secondary energy consumption; transportation, 30.2 percent; residential, 16.7 percent; commercial and institutional, 13.9 percent; and agriculture, 2.2 percent.
National Economic Importance
- In 2010, the GDP of Canada’s energy sector – i.e. industries involved in the production, transformation and transportation of energy – reached $84.3 billion (in 2002 constant dollars), accounting for 6.8 percent of Canadian GDP. The oil and gas extraction industry accounted for about half of this amount, while the electric power industry accounted for about one third.
- The production, transformation and transportation of energy are activities that are “capital intensive” – which means they have extensive needs for various equipment and structures. This generates economic activity throughout the Canadian economy, in particular in such industries as equipment manufacturing, construction and engineering services. In 2010, new capital investments in energy-related industries represented 23.8 percent of Canadian investments.
- The energy sector, excluding service stations and wholesale trade in petroleum products, provided direct employment for 264 000 people in 2010, or 1.8 percent of employment in Canada. In addition, service stations and wholesale trade in petroleum products provided direct employment for 92 000 people (0.6 percent).
- In 2010, energy accounted for 22.5 percent of merchandise exports. The energy trade balance ranked first as a contributor to Canada’s positive overall trade balance.
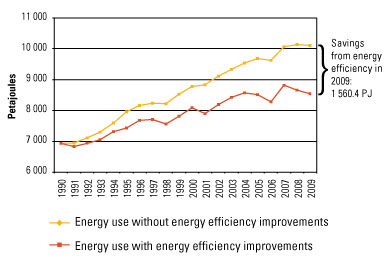
- Despite a 56.6 percent increase in GDP between 1990 and 2009, end-use energy consumption grew by only 23.1 percent. As shown in Figure 6, energy efficiency played a major role in limiting this growth.
Figure 6. Secondary energy use, with and without energy efficiency improvements, 1990–2009
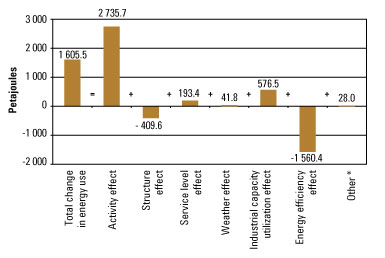
As Figure 7 shows, end-use energy consumption grew by 1605.5 PJ between 1990 and 2009. This increase takes into account such factors as
- growth in economic activity
- weather effect (in 2009, the winter was colder and the summer was cooler than in 1990; the net effect was more energy use)
- changes in the structure of the economy, favouring less energy-intensive industries
- increased service levels for auxiliary equipment in commercial/institutional buildings and for appliances in homes
- increased amount of floor space cooled
- capacity utilization rate, which is the proportion of the installed production capacity that is in use. In 2009, sectors such as mining, transportation equipment, and iron and steel showed significant declines. (For more details, consult Energy Efficiency Trends in Canada, 1990 to 2009)
- significant gains in energy efficiency
- Overall, energy efficiency improved by 23.5 percent between 1990 and 2009. This change corresponds to a reduction of 1560.4 PJ in energy consumption. The gain in energy efficiency translated into savings of $26.8 billion in 2009 and an estimated 81.1 megatonnes of avoided greenhouse gas emissions.
International Importance
- Canada is an open economy, and taking advantage of its sizeable energy resources, it has become an important and reliable energy provider to the world. In 2010, Canada exported $90.0 billion of energy, of which 98.4 percent was to the United States.
- Exports of crude oil amounted to 112.5 million m3 in 2010, representing a value of $52.0 billion. Canadian crude oil accounted for 21.5 percent of U.S. crude imports and held a 13.0 percent share of the overall U.S. market. Exports of refined petroleum products in 2010 totalled 24.3 million m3, or $17.6 billion.
- Canada exported 91.3 bcm of natural gas, all of it to the United States. The value of these exports was $15.6 billion. Canadian natural gas accounted for more than 87.7 percent of U.S. gas imports and held a 13.5 percent share of the overall U.S. market.
- Canada also imported $40.3 billion of energy products, mostly crude oil, refined petroleum products and natural gas. Imports originated from a range of countries that included the United States, Algeria, Norway and the United Kingdom.
| Commodities | World production* ranking 2010 | Exports 2010 | Destination | |||
|---|---|---|---|---|---|---|
| Total energy | – | $90.0B | (100.0%) | U.S. | $88.6 B | (98.4%) |
| Petroleum** | Sixth (4.1%) | $72.3 B | (80.5%) | U.S. | $70.9 B | (98.1%) |
| Natural gas | Third (5.0%) | $15.6 B | (17.5%) | U.S. | $15.6 B | (100.0%) |
| Electricity | Sixth (3.0%) | $2.2 B | (2.0%) | U.S. | $2.0 B | (100.0%) |
U.S. – United States
* British Petroleum’s BP Statistical Survey of World Energy.
** Trade data include crude oil, refined petroleum products and liquefied petroleum gases (LPGs). The production ranking includes crude oil and LPGs.
Page details
- Date modified: