
ECOENERGY FOR BIOFUELS PROGRAM LESSONS LEARNED ASSESSMENT
Audit and Evaluation Branch
Natural Resources Canada
Presented to the Departmental Audit Committee (DAC)
April 12, 2018
TABLE OF CONTENTS
- Executive Summary
- Introduction
- FINDINGS AND LESSONS LEARNED
- Need For The Program
- Appropriate Role For Federal Government
- Alignment With Federal Priorities And NRCan Strategic Outcomes
- Risk Identification and Mitigation
- Program Design
- Resource Utilization
- Performance Monitoring
- Program Management
- Program Monitoring and Reporting
- Program Effectiveness
- Program Efficiency and Economy
- Program Close-out
- APPENDIX A – CRITERIA
- APPENDIX B – FINANCIAL INFORMATION
- APPENDIX C – ECOEBF LOGIC MODEL
EXECUTIVE SUMMARY
INTRODUCTION
1. The Canadian Environmental Protection Act of 1999 and the Renewable Fuels Regulations of 2010 defined the Government of Canada’s commitment to expanding the production and use of biofuels such as ethanol and biodiesel. Canada’s Renewable Fuels Strategy has four key elements including:
- Development and implementation of a federal regulation requiring a percentage of renewable fuels, led by Environment and Climate Change Canada;
- Support for farmer participation in biofuels production through the $200M ecoAgriculture Biofuels Capital (ecoABC) program, led by Agriculture and Agri-Food Canada;
- Support for next generation technologies via the $500M NextGen Biofuels Fund™, managed by Sustainable Development Technology Canada with oversight by Environment and Climate Change Canada and Natural Resources Canada (NRCan); and
- A production incentive, through the $1.5B ecoENERGY for Biofuels Program (ecoEBF), to stimulate domestic production administered by NRCan.
2. The nine-year ecoEBF Program was administered by NRCan’s Energy Sector’s Office of Energy Efficiency, and was designed to grow a sustainable domestic renewable fuel industry, in support of Environment and Climate Change Canada’s Federal Renewable Fuels Regulation, which mandates blending 5% of the gasoline pool and 2% of the diesel pool with renewable alternatives. Complementary to the Federal Renewable Fuels Regulations, some provinces also established equivalent or higher provincial mandates (including a 5% ethanol content in gasoline in Ontario, 7.5% in Saskatchewan, and 8.5% in Manitoba).
3. The Program made available up to $1.5B in incentives to producers of renewable alternatives to gasoline and diesel to partially offset the risk associated with fluctuating feedstock and energy prices. It provided an incentive per litre of fuel produced, the amount of which declined over the 7 years of the agreement. The Program was expected to increase the number of Canadian renewable fuels production facilities from 20 to approximately 30 by 2017, resulting in an annual production capacity of 2 billion litres of ethanol and 500 million litres of biodiesel. Designed to replace an excise tax exemption for ethanol, the Program was expected to contribute to the establishment of a self-sufficient industry.
4. In December 2009, after 18 months of Program delivery, at the request of industry, and after consultation with key stakeholders, the Government of Canada implemented six changes intended to provide more predictable and stable payments for renewable fuel production and to ensure the Program supported the most viable projects with the goal of long-term sustainable growth of the renewable fuel industry. These changes were intended to provide industry with more certainty to make investment decisions during the economic climate of the time. In addition, Program funds were re-profiled, enabling ecoEBF to fund more projects and increase the amount of renewable fuel produced. Applications were solicited from both existing and new facilities with final deadline of March 31, 2010, after which no new applications were accepted.
5. These changes were examined within a 2011 internal audit and 2012 evaluation. The audit’s scope covered Program activities between April 2008 and June 2010, and the evaluation covered expenditures from 2007–08 to 2010–11.
6. In February 2013, the renewable fuels industry was informed that the Program would not be redesigned, that unused funds would not be used to enter into new agreements; and that the Program would remain closed to additional entrants. As of March 31, 2017, the program has concluded all incentive payments to proponents and has entered the program close-out phase with an estimated completion date of March 31, 2018.
7. Over its duration, the Program signed a total of 38 Contribution Agreements (CAs), out of which 20 (52%) successfully completed the seven year term. The Program provided a total of $929.9 million in incentives to biofuels producers, while spending $35.4 million in program expenses consisting of salaries, overhead, and accommodations. A detailed breakdown of annual program spending is available in Appendix B.
8. In December 2016, the Government of Canada announced that it would work with stakeholders to develop a new Clean Fuel Standard, which would encourage the use of cleaner fuels in many sectors of the economy, including transportation, building, and industry. Since that announcement, Environment and Climate Change Canada (ECCC) has produced a discussion paper on the subject, hosted a Clean Fuel Standard Roundtable, a multi-stakeholder workshop, and engaged in further consultations on the Clean Fuel Standards with stakeholders from across the country. On December 23, 2017, ECCC published a Notice to interested parties on the Clean Fuel Standard regulatory framework, in which it indicates that the volumetric requirements of the federal Renewable Fuels Regulations would be maintained in the short term, but that in the longer term the Clean Fuel Standard will replace the Renewable Fuels Regulations.
9. In accordance with the departmental audit and evaluation plans, the ecoEBF Program was scheduled to be audited and evaluated twice over its 9-year duration. The current Joint Assessment of the Biofuel Program was approved by the Deputy Minister as part of NRCan’s 2016-19 Risk-Based Audit Plan and NRCan’s 2016-21 Departmental Evaluation Plan. The objective of this assessment was to assess the effectiveness of the ecoEBF program design and management processes, and to determine whether the Program closeout was performed effectively and that lessons learned were formulated for future programs.
Lessons learned
10. The ecoEBF Program officially launched on April 1, 2008, and was completed on March 31, 2017. It was a complex Program, managed through a period of significant change in Program administration within NRCan and across the Federal Government. During the Program lifecycle, the departmental administrative requirements, information technology, and best practices for Grants and Contributions (G&Cs) Programs continued to evolve. Considering the length of the Program, the volume of documentation, and the technological changes in information management, Program administration demonstrated effective organization and diligence in the retention of program documentation. While not an NRCan requirement, the ecoEBF Program administration explored the feasibility of deploying an online client relationship management system, in an effort to increase efficiencies within the proponent reporting process. The policy environment was also evolving; including a new Treasury Board of Canada (TB) Policy on Transfer Payments. This policy came into effect on October 1, 2008, six months after the official launch of the Program. The new TB Policy on Transfer Payments applied to all contribution agreements signed by the Program.
11. Overall, management administered $929.9 million of incentives to support the production of renewable alternatives to gasoline and diesel. The Program utilized third-party assurance to corroborate the production volume incentive annually, which mitigated inherent program risk. In addition, Program adjustments were made in three instances to accommodate industry feedback. While somewhat impacting efficiency, these changes were needed in light of the fluctuating market conditions for biofuel production. Although management advised that there was no dedicated resources to support Program close-out, at the time of the assessment, close-out was well managed and being executed in a timely manner.
12. The table below presents a summary of the lessons learned developed as part of the Assessment of the ecoEBF Program. Even though the ecoEBF Program has been terminated, existing and future G&C Programs could benefit from considering these lessons when designing and managing their Programs. Many of these lessons learned were derived from the innovative techniques used to address the challenges encountered by this Program.
| Areas of Lesson | Lessons learned |
|---|---|
| Risk Identification and Mitigation |
Lesson 1: When managing an ongoing program, review and update program risk management tools on a regular basis to assess new, emerging risks and identify appropriate mitigation measures. Lesson 2: When managing a G&C program, ensure that project level risk assessments reflect changes in risks attributable to the proponent’s prior period performance, and include tailored mitigation measures addressing the specific risks of each project. |
| Program Design | Lesson 3: When designing a program in support of a nascent industry, where market determinants are difficult to predict and control, build in and clearly communicate periodic check-points and opportunities to make corrections. In the course of such corrections, attention should be paid to formally update performance frameworks. |
| Performance Measurement and Accountability Reporting | Lesson 4: When designing a program to support proponents through contribution agreements with varying start and end dates, overall program performance measurement and accountability could be enhanced upon the collection of data on funded projects through to the end of the program, irrespective of when specific contribution agreements end. |
| Program Management |
Lesson 5: When designing a G&C program, ensure that contribution agreements have sufficient clarity to avoid misinterpretation. Lesson 6: When designing a G&C program, consider employing an online funding application and client relationship management system to increase efficiencies within the proponent reporting process. |
| Program Monitoring and Reporting | Lesson 7: When managing a G&C program, use a customized approach to proponent monitoring that applies measures commensurate with individual proponent risk and prior performance. |
| Program Close-out |
Lesson 8: In order to ensure that programs are closed-out in an effective manner, develop program close-out plans applicable to G&Cs programs that clearly identifies the roles and responsibilities of program staff and all relevant intra-departmental service providers. Lesson 9: In order to inform program design and administration, provide a standardized method for G&Cs programs to record lessons learned and a means of disseminating them throughout the department. |
CONCLUSION AND OPINION
13. Overall, the Program established management processes to support the administration of $929.9 million in incentives to support the production of renewable alternatives to gasoline and diesel. The Program was successful in attracting a large number of proponents to meet its initial production and capacity targets, and responded to the needs of proponents through the implementation of three program adjustments. However, fluctuating market conditions subsequently limited participating facilities’ abilities to meet these initial projections, particularly for biodiesel. Future programs would benefit from establishing robust risk measurement and monitoring processes, and from designing terms and conditions that require the collection of performance data until program close-out. While this Program was conducting its close-out effectively at the time of the assessment, all G&Cs programs would benefit from formal departmental processes for program close-out and dissemination of lessons learned.
14. This report contains lessons learned that could be useful for various groups within NRCan to help them with the management of existing and future grant and contribution programs. Those that could benefit from these observations include, among others, the Center of Expertise on Grants and Contributions and the Chief Information Officer and Security Branch within the Corporate Management and Services Sector, as well as the Planning, Delivery and Results Branch within the Strategic Policy and Results Sector and future audit and evaluation projects.
STATEMENT OF CONFORMANCE
15. The assessment conforms with the Treasury Board of Canada Policy on Results, the Government of Canada’s Policy on Internal Audit, and the Institute of Internal Auditors' International Standards for the Professional Practice of Internal Auditing, as supported by the results of the Quality Assurance and Improvement Program.
Christian Asselin
Chief Audit and Evaluation Executive
April 12, 2018
ACKNOWLEDGMENTS
16. The project team would like to thank those individuals who contributed to this project and, particularly employees who provided insights and comments as part of this assessment.
INTRODUCTION
17. The Canadian Environmental Protection Act of 1999 and the Renewable Fuels Regulations of 2010 defined the Government of Canada’s commitment to expanding the production and use of biofuels such as ethanol and biodiesel. Canada’s Renewable Fuels Strategy has four key elements including:
- Development and implementation of a federal regulation requiring renewable fuels, led by Environment and Climate Change Canada;
- Support for farmer participation in biofuels production through the $200M ecoAgriculture Biofuels Capital (ecoABC) program, led by Agriculture and Agri-Food Canada;
- Support for next generation technologies via the $500M NextGen Biofuels Fund™, managed by Sustainable Development Technology Canada with oversight by Environment and Climate Change Canada and Natural Resources Canada (NRCan); and
- A production incentive, through the $1.5B ecoENERGY for Biofuels Program (ecoEBF), to stimulate domestic production administered by NRCan.
18. The nine-year ecoEBF Program was administered by NRCan’s Energy Sector’s Office of Energy Efficiency, and was designed to grow a sustainable domestic renewable fuel industry, in support of Environment and Climate Change Canada’s Federal Renewable Fuels Regulation, which mandates blending 5% of the gasoline pool and 2% of the diesel pool with renewable alternatives. The Program made available up to $1.5B in incentives to producers of renewable alternatives to gasoline and diesel to partially offset the risk associated with fluctuating feedstock and energy prices. It provided an incentive per litre of fuel produced, the amount of which declined over the 7 years of the agreement. The Program was expected to increase the number of Canadian renewable fuels production facilities from 20 to approximately 30 by 2017, resulting in 2 billion litres of ethanol and 500 million litres of biodiesel production capacity. Designed to replace an excise tax exemption for ethanol, the Program was expected to contribute to the establishment of a self-sufficient industry. Complementary to the Federal Renewable Fuels Regulations, some provinces also established equivalent or higher provincial mandates (including a 5% renewable content mandate in Ontario, 7.5% in Saskatchewan, and 8.5% in Manitoba). Below is an illustration of the Biofuels Life Cycle.
19. In December 2009, after 18 months of Program delivery, at the request of industry, and after consultation with key stakeholders, the Government of Canada implemented six changes intended to provide more predictable and stable payments for renewable fuel production and to ensure the program supported the most viable projects with the goal of long-term sustainable growth of the renewable fuel industry. In particular, the variable declining incentive rate was changed to a fixed declining incentive rate. These changes were intended to provide more predictable and stable payments for renewable fuel production and to ensure that the Program supported the most viable projects, leading to long-term sustainable growth in the renewable fuel industry. These changes were also intended to provide industry with more certainty to make investment decisions during the economic climate of the time. In addition, Program funds were re-profiled, enabling the ecoEBF Program to fund more projects and increase the amount of renewable fuel produced. These changes were examined within a 2011 internal audit and a 2012 evaluation. The audit’s scope covered Program activities between April 2008 and June 2010, and the evaluation covered expenditures from 2007-08 to 2010-11.
20. In February 2013, the renewable fuels industry was informed that the Program would not be redesigned; that unused funds would not be used to enter into new agreements; and that the Program would remain closed to additional entrants. As of March 31, 2017, the Program has concluded all incentive payments to proponents and has entered the program close-out phase with an estimated completion date of March 31, 2018.
21. In December 2016, the Government of Canada announced that it would work with stakeholders to develop a new Clean Fuel Standard, which would encourage the use of cleaner fuels in many sectors of the economy, including transportation, building, and industry. Since that announcement, ECCC has produced a discussion paper on the subject, hosted a Clean Fuel Standard Roundtable, a multi-stakeholder workshop and engaged in further consultations on the Clean Fuel Standards with stakeholders from across the country. On December 23, 2017, ECCC published a Notice to interested parties on the Clean Fuel Standard regulatory framework, in which it indicates that the volumetric requirements of the federal Renewable Fuels Regulations would be maintained in the short term, but that in the longer term the Clean Fuel Standard would replace the Renewable Fuels Regulations.
22. Over its duration, the Program has provided a total of $929.9 million in incentives to biofuels producers while spending $35.4 million in program expenses consisting of salaries, overhead and accommodations. A detailed breakdown of annual program spending is available in Appendix B of this report.
23. In accordance with departmental audit and evaluation plans, the Program was scheduled to be audited and evaluated twice over its 9-year duration. The current assessment of the Biofuel Program was approved by the Deputy Minister as part of NRCan’s 2016-19 Risk-Based Audit Plan and NRCan’s 2016-21 Departmental Evaluation Plan.
24. Since this project was conducted in accordance with the Government of Canada’s Policies on Internal Audit and Policy on Results, it was decided to entitle it an, “assessment’’ of the ecoEBF. It will be tabled before both the Departmental Audit Committee (DAC) and the Performance Measurement and Evaluation Committee (PMEC) and will be posted on NRCan’s external website.
OBJECTIVE OF THE ASSESSMENT
25. The objective of this assessment was to assess the effectiveness of the ecoEBF program design and management processes, and to determine whether the Program closeout was performed effectively and that lessons learned were formulated for future programs. Specifically, the engagement team assessed;
- Whether the Program design included comprehensive and effective risk management, monitoring, and reporting processes;
- Whether adequate management processes were implemented to support the delivery of the Program;
- Whether the Program closeout was performed effectively at the time of the assessment;
- Program relevance to determine the extent to which the Program addressed a demonstrable need and whether that need is ongoing, as well as the extent to which the Program was appropriate to the federal government;
- Program effectiveness to determine the extent to which the program had achieved expected outcomes as well as identifying any unintended outcomes which may have resulted from the ecoEBF Program; and
- Whether the Program formulated lessons learned that could support decision making for the design and implementation of future programs.
ASSESSMENT CONSIDERATIONS
26. A risk-based approach was used in establishing the objective, scope, and approach for this engagement. A summary of the key underlying areas of risk that were taken into consideration includes the following:
- Was the Program effectively designed to support the achievement of its intended outcomes?
- Did the Program have comprehensive processes in place to enable the effective management of risks?
- Were diverse proponent needs accommodated through the Program delivery model?
- Were contribution agreements designed with sufficient flexibility to address variable market conditions and proponent-specific risks?
- Did the Program include comprehensive processes to enable effective monitoring and reporting on the contribution agreements?
- Did the Program have comprehensive processes in place to enable effective identification of lessons learned at the department level?
- Did the Program have processes in place to ensure an effective and due-diligent close-out?
ASSESSMENT SCOPE
27. The scope of this assessment focused primarily on the period from Program redesign to the close-out (December 2009 to March 2017), with consideration of the preceding period (2008 to 2009) mainly for the assessment of the program redesign and early impacts. The assessment team reviewed the risk management strategy of the Program, including the controls that were in place to mitigate fraud risk as well as the program management and design, and explored lessons learned that may inform the design and implementation of similar programs in the future.
The scope of the assessment did not include the following:
- Assessment of regulatory instruments;
- Contribution agreements that are currently subject to litigation;
- Areas covered in the 2011 Audit of the ecoEnergy for Biofuels Program; and
- Assessments of proponent facilities’ performance, Green House Gas emissions reductions attributable to the Program, and related economic analysis.
28. EcoEBF was one of four elements which together comprised Canada’s Renewable Fuels Strategy (RFS). This lessons learned assessment focussed solely on the ecoEBF Program and was not a horizontal assessment. Since all four elements of the RFS were not examined, it was not possible to examine impacts of the ecoEBF program alone, as all elements contributed to the achievement of the economic and environmental objectives of the RFS.
APPROACH AND METHODOLOGY
29. The approach and methodology followed the Institute of Internal Auditors' International Standards for the Professional Practice of Internal Auditing; the Government of Canada’s Policy on Internal Audit; and the Standard on Evaluation which establishes the requirements on the Mandatory Procedures for Evaluation in accordance with the Government of Canada’s Policy on Results.
30. The goal of this joint project was to produce a value-added assessment that limits the duplication of efforts required to conduct separate audit and evaluation projects. This approach also facilitated the identification of synergies and innovation within the Audit and Evaluation functions. The joint project was managed by both audit and evaluation directors and overseen by the Chief Audit Executive and the Head of Evaluation.
31. The assessment was planned and conducted by a joint team, with representatives from both groups. Internal auditors and evaluators conducted the project with independence and objectivity as defined by their respective professional standards and requirements.
32. The project approach included the following key tasks:
- Interviews with key personnel with respect to the design and management of the Program, and related activities;
- Interviews with the Program stakeholders, including proponents (12), industry associations (3), academia (2), other federal departments and agencies (2), and provincial and territorial governments (2);
- Review of relevant background documents, including Program authority documents, policies, directives, guidance, contributions agreements, planning, monitoring and reporting information, as well as performance measurement data;
- Review of literature with a focus on provincial jurisdictions and other countries, academia/universities, and federal government studies and publications;
- Documenting best practices and lessons learned from case studies. Those case studies were selected from the list of projects that received Program incentives and included interviews, document reviews, and administrative file reviews. However, due to failed attempts at reaching all four proponents, the case studies relied mostly on a review of project files, i.e. a content analysis of the quarterly conference calls. Findings from main program document review covered any file review gaps; and
- A follow-up on previous Audit and Evaluation recommendations.
33. This assessment project has faced some limitations, including the absence of data on the Program proponents beyond the date at which their contribution agreements ended or were terminated; and the inability to assess the attribution of the production of the Canadian biofuel industry to the Program. As a mitigation strategy, indirect measures were used to estimate the contribution of the program to the overall industry production and the longer-term viability of participating facilities. This included external data on overall domestic biofuel production capacity and the analysis of proponents’ views on the viability of their production of biofuels as reported within the quarterly conference calls held by the Program with all its active proponents from 2013 to 2016.
CRITERIA
34. Please refer to Appendix A for the detailed criteria. The criteria guided the assessment fieldwork and formed the basis for the overall conclusion.
FINDINGS AND LESSONS LEARNED
35. The assessment focused on seven program characteristics:
- Program Relevance
- Risk Identification and Mitigation
- Program Management
- Program Monitoring and Reporting
- Program Effectiveness
- Program Efficiency and Economy
- Program Close-out
A total of ten lessons were learned from the examination of these aspects of the program. The findings and associated lessons learned from this assessment are presented below. Future grants and contributions programs (G&Cs programs) would benefit from taking these lessons learned into consideration when designing and managing their program.
NEED FOR THE PROGRAM
36. As one component of the Government of Canada’s Renewable Fuels Strategy, there is clear evidence that, at the time it was designed, the ecoEBF Program addressed a demonstrable need to assist Canadian biofuel companies in developing capacities to produce biofuels and improve the competitiveness of the Canadian biofuel industry. The strategy has four objectives: reduce greenhouse gas (GHG) emissions resulting from fuel use; encourage greater production of biofuels; accelerate the commercialization of new biofuel technologies; and provide new market opportunities for agricultural producers and rural communities. The ecoEBF Program was designed to incentivize domestic production of renewable alternatives to gasoline and diesel, and encourage the development of a competitive domestic industry for renewable fuels. The Program was also intended to support a complementary key element of the RFS, which was the implementation of federal regulations requiring 5% renewable fuel content based on the gasoline pool and 2% renewable diesel fuel content in diesel and heating oil. The regulations were expected to require close to 3 billion litres of renewable fuel by 2012.
37. This assessment confirmed that, at the time it was designed, there was a need for this Program. There is widespread consensus among key informants that the Program addressed a demonstrable need for financial support of Canadian biofuel companies to develop their capacities to produce biofuels and improve the viability of the Canadian biofuel industry. Many of the proponents interviewed explained that they needed this financial assistance to help their companies to be competitive or more viable/sustainable in the context of a challenging biofuel market and/or international competition.
38. Market studies reveal that the renewable fuels industry faced particularly high risks because its input costs (i.e., feedstock) were unrelated to its output revenues (i.e., fuels and co-product sales). The viability of the biofuels industry was therefore very dependent on feedstock costs. For biodiesel in particular, they represented over 80% of production costs, as described in the RMAF for the ecoEBF Program (September 2007). Furthermore, Canadian biofuels producers faced strong competition from the U.S. renewable fuel industry, which was more developed and able to produce at lower operating costs than producers in Canada. The U.S. industry also benefited from significant subsidies at both the state and federal level. In light of such vulnerability, federal support was needed to partially offset such risks in order to attract and retain investments in a domestic biofuels industry.
APPROPRIATE ROLE FOR FEDERAL GOVERNMENT
39. Program objectives were aligned with federal jurisdiction as described in the Department of Natural Resources Act and Section 21 of the Energy Efficiency Act (EEA). The EEA states that:
“The Minister may, for the purpose of promoting the efficient use of energy and the use of alternative energy sources: (a) conduct, or cooperate with persons conducting research, development, tests, demonstrations and studies; (b) publish information, research or test results; (c) assist, cooperate with, consult and enter into agreements with any person, including any department or agency of the Government of Canada or of any province; (d) make grants and contributions; and (e) undertake such other projects, programs and activities as in the Minister’s opinion advance that purpose’’.
However, interviews with federal, provincial and industry stakeholders revealed mixed views on the appropriateness of federal government involvement in supporting the Canadian biofuels industry.
40. Most key informants which responded, including proponents, industry associations, provincial government and academic stakeholders, indicated that there was an appropriate role for the federal government to incent domestic biofuel production and/or support the development of a competitive industry, at the same time contributing to reduce greenhouse gas emissions and to mitigate the environmental effects produced by fossil fuels. Intervention was seen as appropriate, for example, because it enabled and was mutually supportive of provincial and federal renewable fuel mandates, and because it helped offset competition from the oil industry and other countries.
41. It should be noted, however, that various groups have been opposed to federal financial support for biofuels, believing it to be an inappropriate area for federal involvement given conflicting reports on the social and environmental benefits or impacts of biofuel production activities. These views can be found in academia (such as in “The Case Against More Ethanol: It’s Simply Bad for Environment” by C. Ford Rung), and in civil society organizations (such as the Canadian Taxpayer’s Federation). In the United States, the organization Taxpayers for Common Sense advocates for an end to US federal support for biofuels, and is critical of the Government’s ability to “pick winners and losers” rather than relying on markets which are free of ’’distortion’’.
ALIGNMENT WITH FEDERAL PRIORITIES AND NRCAN STRATEGIC OUTCOMES
42. EcoEBF Program objectives aligned with federal government priorities pertaining to renewable fuels, as outlined in the 2007 Federal Renewable Fuels Strategy, and with departmental strategic outcomes related to alternative transportation fuels. The Strategy was designed in part to help Canadian biofuels facilities meet the demand for biofuels created under the Federal Renewable Fuels Regulations.
43. Program objectives were also consistent with departmental sub-program activities pertaining to alternative transportation fuels under the strategic outcome “Canada is a World Leader on Environmental Responsibility in the Development and use of Natural Resources” from 2008-09 to 2011-12, as well as the strategic outcome “Natural Resource Sectors and Consumers are Environmentally Responsible” from 2012-13 to 2016-17.
RISK IDENTIFICATION AND MITIGATION
44. The Treasury Board of Canada (TB) Policy and Directive on Transfer Payments require effective, risk-based approaches for the design and delivery of transfer payment programs that ensure accountability and value for money for transfer payments. Program level risk management strategies are employed at NRCan to identify the Government’s exposure to risks resulting from the design and delivery of G&Cs programs. These strategies are to be updated to address changes in known risks as well as to identify any new risks that may emerge throughout the term of a program.
45. The ecoEBF Program developed and implemented a Results-based Management and Accountability Framework (RMAF) and a Risk Based Audit Framework (RBAF) at the inception of the Program. In November 2009. The development of a Program Risk Management Strategy (PMRS) was contracted out. The PMRS was updated in 2011 and 2013, to assess the key risks and identify mitigating controls. The assessment team noted that the Strategy was last updated in 2013, after which time there was no documented evidence of further updates. The most recent version of the Strategy (2013) was not formally approved by senior Program management and remained in draft form at the time of this assessment. Without regular updates, these risk management tools cannot address past program performance, new emerging risks, and identify appropriate mitigating controls. The assessment team concluded that all current and future G&C Programs would benefit from reviewing and updating program risk management tools on a periodic and timely basis.
46. Due to the nature of its activities, the ecoEBF Program adopted a production incentive model whereby proponents were provided an incentive for the portion of total sales, in litres, of renewable alternatives to gasoline and/or diesel that was produced in Canada, accepted under the Program, and sold by the proponent during the reporting period. This model was supported by a variety of risk mitigation efforts, such as the use of third-party assurance to corroborate the production volume incentive annually. This was assessed as an effective and efficient means of mitigating program risks. The assessment team concluded that future Programs with production based incentive models would benefit from adopting similar measures to reduce inherent risk.
Lesson 2: When managing a G&C program, ensure that project level risk assessments reflect changes in risks attributable to the proponent’s prior period performance, and include tailored mitigation measures addressing the specific risks of each project.
47. A risk management model for transfer payments is a tool used to identify risk factors that can be used to assess the overall risk related to a particular recipient. TB recommends that the risk management model be applied prior to a funding agreement being signed with a recipient and re-applied throughout the duration of the agreement, as needed. Project level risk assessments are critical in determining the inherent risk associated with a project proposal. The inherent risk is mitigated through the application of specifically designed mitigating measures, thereby reducing the inherent risk to a level that is acceptable to the Government.
48. The assessment found that the project-level risk assessments did not always provide mitigation measures associated with the unique characteristics of each proponent. Instead, they were a reiteration of common measures applicable to all proponents.
49. Furthermore, the assessment found that when project-level risk assessments were performed, they were not always revised to reflect changes in risks attributable to the proponent’s prior period performance and program compliance, whether favorable or unfavorable. These issues may arise in future G&C programs. Future G&C programs would benefit from considering these challenges when designing and managing their programs.
PROGRAM DESIGN
Lesson 3: When designing an incentive program for a nascent industry, where market determinants are difficult to predict and control, build in and clearly communicate periodic check-points and opportunities to make course corrections.
In the course of such corrections, attention should be paid to formally update performance frameworks (see paragraph 51).
50. The Program made adjustments to the original program design within the first two years of implementation in order to address design limitations and unanticipated challenges, in a way that would facilitate progress towards intended targets. As reported through key informant interviews, these changes were generally seen by Program proponents as an improvement because they were less burdensome and more appropriate to the proponents’ circumstances.
RESOURCE UTILIZATION
51. On average, 97% of the financial resources ($1.4 billion) under the Program were allocated directly to eligible recipients in the form of transfer payments, leaving approximately 3% of the annual budget ($41.7 million) to cover operating costs. Actual expenditures (see Appendix B) followed the same pattern. An annual average of $3.93 million (including salaries & benefits, accommodations, corporate services and operating & maintenance) was spent to provide Program support to 38 signed contribution agreements, totalling $929.9 million in claimed incentives. Most of the financial resources of the Program were allocated directly to eligible recipients in the form of transfer payments.
52. The table 1 below also shows that because the ecoEBF Program was a performance-based program and considering that the proponents underperformed, the entire allocation was not spent. An annual average of $107 million was spent. This finding is explained by the fact that the Program did not reach the full projected production levels and, as a result, did not pay out as large an amount in total claims as was expected.
| 2008-09 | 2009-10 | 2010-11 | 2011-12 | 2012-13 | 2013-14 | 2014-15 | 2015-16 | 2016-17 | Total | Average | |
|---|---|---|---|---|---|---|---|---|---|---|---|
| Planned | 120 | 190 | 260 | 240 | 220 | 180 | 150 | 80 | 40 |
1,480 |
164 |
| Actual | 96 | 183 | 152 | 161 | 134 | 117 | 97 | 18 | 6 |
963 |
107 |
| Difference (%) | -20% | -4% | -42% | -33% | -39% | -35% | -35% | -78% | -85% |
-35% |
-35% |
PERFORMANCE MONITORING
Lesson 4: When designing a program to support contribution agreements with varying start and end dates, overall program performance measurement and accountability could be enhanced if data on program proponents’ results is collected up to the end of the program, irrespective of when specific contribution agreements end.
53. A results-based management and accountability framework (RMAF) was approved for the Program in 2007. The framework included a logic model that articulates the intended Program outcomes and a performance measurement matrix outlining performance indicators, targets, and data sources. The assessment team found that this framework was not updated to reflect the change in the program design and that the Program did not conduct planned industry surveys of funded proponents in order to collect data for final program outcomes related to domestic production and capacity (i.e., as of March 31, 2017). According to the program management, the strategy was to negotiate voluntary arrangements for reporting after CAs ended and to combine them with Statistics Canada associated data collected through a contracted third party. While individual negotiations with proponents were unsuccessful, interaction with stakeholders were renewed through efforts around the Clean Fuel Standard, even though such data was not provided to the assessment team.
54. In the absence of such information and of a formal lever requiring proponents to continue reporting after their contribution agreement ended, the Program provided industry-wide data from multiple sources, i.e. industry associations and Statistics Canada. Among the 26 plants composing the Canadian biofuel industry and producing ethanol, biodiesel, biocrude or methanol, 21 had claimed incentives from the ecoEBF Program at one time or another during the period covered by the Program. The Program used this information to determine the level of production for the whole industry in 2017, without precisely measuring the Program’s contribution to the 2017 increase in domestic biofuel production capacity and actual production.
PROGRAM MANAGEMENT
55. The terms and conditions within contribution agreements provide proponents with the information required to make informed decisions when deploying capital to fulfill program commitments, maintain program compliance, and deliver on Program objectives.
56. Although the Program’s contribution agreement template provided detailed interpretations of many terms therein, the assessment found that some ambiguous terminology within the contribution agreements invited differences of interpretation and created legal complications in the contractual relationship between proponents and the Program. The resulting ambiguity further complicated the timely assessment of proponent compliance with their respective contribution agreements.
Lesson 6: When designing a G&C program, consider employing an online funding application and client relationship management system to increase efficiencies within the proponent reporting process.
57. The objective of the TB Policy on Transfer Paymentsis to ensure that transfer payment programs are managed with integrity, transparency, and accountability in a manner that is sensitive to risks; are citizen and recipient-focused; and are designed and delivered to address government priorities in achieving results for Canadians. With this objective in mind, Departments should actively seek out solutions to streamline application and funding processes for all G&Cs programs.
58. The application, funding, and program compliance requirements for the ecoEBF program were created during the design phase of the Program in 2007. The Program collected various reports and information from the proponents on a regular basis for monitoring purposes, mainly through email communication. Although the Program was redesigned in 2010 to address feedback regarding proponent reporting compliance challenges and the frequency and timeliness of incentive payments, the method, channels and technology employed for these processes remained unchanged. While not an NRCan requirement, the ecoEBF Program administration explored the feasibility of deploying an online client relationship management system, in an effort to increase efficiencies within the proponent reporting process. It should be noted that the Department has yet to adopt an on-line system to manage the application process for G&Cs programs.
59. The reporting requirements of high-value G&Cs programs can be quite complex and challenging for proponents throughout the life-cycle of a long-term program. In the past, NRCan has used an online application system to receive and manage G&C funding applications. These client focussed online solutions have been recognized by the Department as a best practice. Harnessing an online application portal and CRMS would increase ease of use and efficiency for both proponents and future program administration. Such a tool could streamline proponent reporting and thereby reduce reporting burden for proponents.
PROGRAM MONITORING AND REPORTING
Lesson 7: When managing a G&C program, use a customized approach to proponent monitoring that applies measures commensurate with individual proponent risk and prior performance.
60. The TB Policy on Transfer Payments came into effect on October 1, 2008, 6 months after the Program`s official launch. The expected results of this Policy was that administrative requirements on applicants and recipients, which are required to ensure effective control, transparency and accountability, are proportionate to the level of risks specific to the program, the materiality of funding, and to the risk profile of applicants and recipients. The ecoEBF Program signed all its contribution agreements after this policy came into effect.
61. The TB Policy on Transfer Payments states that monitoring, reporting, and auditing should reflect the risks specific to the program, the value of funding in relation to administrative costs, and the risk profile of the recipients. The assessment team found that the existing approach applied the same monitoring methods for all proponents regardless of size, lengths of operation and past performance.
62. Recipient auditing is an effective means of assessing proponents’ compliance to the terms and conditions of their contribution agreements. The TB Policy on Transfer Payments stipulates that recipient auditing should reflect the risk profile of the recipients. The NRCan Departmental Policy on Transfer Payments also states that programs should use a risk-based framework as a guide for selecting proponents for recipient audits. The assessment expected to find that the recipient audit plan identified planned audits with a frequency that was commensurate with individual proponent risk and prior performance. Not doing so may result in recipient audits not being performed commensurate with the assessed level of project risk, leading to the excessive audit of lower risk projects and higher risk projects not being adequately examined. The assessment found some variability in the frequency of recipient audits conducted, however, not sufficient frequency to reflect the inherent variability of individual proponent risk. The assessment noted that discrepancies identified during recipient audits were addressed and that recommendations were tracked and followed-up in a timely manner.
63. The Biofuels Program employed an array of methods to monitor proponent performance as well as compliance to program terms and conditions and contribution agreements. Program milestones, representing the commitments within the program terms and conditions and contribution agreements, were developed, tracked and reported on a quarterly basis to senior management. Dashboards were prepared for Senior Management on a weekly basis for the majority of the Program duration, and aggregate reports were developed annually.
64. At the Sector-level, Director General (DG) packages were prepared and shared on a quarterly basis. These packages included status reporting on progress toward milestones, audits conducted or underway, as well as contribution agreements.
PROGRAM EFFECTIVENESS
Program Outcome Measures and Targets
65. As per evaluation standard approaches, the Program’s effectiveness was measured against each of the outcomes stated in its original logic model (see Appendix C) and focused primarily on the achievement of program targets (stated in the Results-based Management and Accountability Framework (RMAF) for ecoEBF Program), as described in table 2 below.
66. According to Program representatives, the initial RMAF containing the Program logic model and performance measures was not used to monitor and report on the Program’s performance. In particular, revised measures were created to focus the Program’s expected performance on participating facilities’ production capacity (i.e., the facility’s total production capability, or “nameplate capacity”). In this way, the Program was able to avoid dictating industry decisions in terms of actual production, and so not impinge on industry’s ability to adjust to fluctuating market conditions.
Overview of Findings on Outcomes
67. Evidence shows that the Program was successful in attracting and signing agreement with a sufficiently large number of proponents to potentially meet its initial production and capacity targets, but that fluctuating market conditions subsequently limited participating facilities’ ability to meet these initial projections, particularly for biodiesel. While some targets were only partially met, findings indicate that the Program has contributed to an increase of domestic production and the development of a competitive domestic renewable fuels industry.
68. Table 2 below shows that the Program has exceeded its initial immediate outcome targets, having received a higher than expected number of applications and signing close to double the expected number of contribution agreements. Based on these agreements, the program was initially positioned to meet both its production and capacity targets. However, due to market challenges, several producers were unable to meet their contractual terms and their agreements were terminated before their scheduled end dates. As a result, production capacity levels were not maintained and actual production levels were not achieved to the extent expected. This situation was particularly challenging for biodiesel proponents as more than 70% of signed agreements were terminated before their end date, while 82% ethanol signed agreement were brought up to their end.
69. No evidence of unintended Program outcomes was found as part of this assessment. A more detailed presentation and analysis of the results is presented in the sub-sections that follow.
| Outcome | Target | Result |
|---|---|---|
| Immediate: Increased awareness of Canadian programs by producers of renewable alternatives to gasoline and diesel | 30 applications | 104 applications were received Target exceeded |
| Immediate: Increased uptake of program | 80% of facilities receiving funds 20 signed agreements | 28 facilities (74%) received funds Target partially met 38 contribution agreements were signed Target exceeded |
| Intermediate: Increased domestic production of renewable alternatives to gasoline and diesel | Two billion litres of domestic production of renewable alternatives to gasoline and 500 million litres of renewable alternatives to diesel by 2012 | In 2011-12, proponents reported production and sales of 1,670 million litres of ethanol (83% of the target) and 120 million litres of biodiesel (24% of target). Targets partially met |
| Intermediate: Contributed to meeting federal regulations requiring renewable content | Availability of domestically produced renewable fuels for federal regulations | Program proponents’ production increased in the earlier years of the program, largely levelled out between 2011 and 2014, and then tailed off again as contribution agreements ended. Target partially met |
| Final: Increased domestic production and capacity of renewable alternatives to gasoline and diesel, contributing towards Canada’s role in the development and use of natural resources | Two billion litres of domestic production of renewable alternatives to gasoline and 500 million litres of renewable alternatives to diesel by 2017 | Domestic biofuel industry production of 1.7 billion litres of ethanol and 430 million litres of biodiesel in 2016-17. Targets partially met |
| Final: Developed a competitive domestic renewable fuels industry | 30 Canadian facilities by 2017 Total domestic production capacity of 3 billion litres |
As of 2017, Canadian biofuel industry was composed of 26 plants producing ethanol, biodiesel, biocrude or methanol, among which 21 had claimed incentives from ecoEBF at one time or another during the period covered by the Program. Targets Partially met In 2017, 2.5 billion litres of ethanol, biodiesel, biocrude or methanol was reached by Canadian biofuel industry. Targets Partially met |
Increased Awareness and Uptake of Program
70. Program files show that over 104 applications were received, far exceeding the target of 30 applications. Furthermore, according to Program files, a total of 38 contribution agreements were signed with proponents (17 agreements with ethanol producers and 21 with biodiesel producers), thereby exceeding the Program’s target of 20 agreements. In total, the signed agreements forecasted the production of 14.80 billion litres of alternative fuels (10.8 billion litres of ethanol and 4 billion litres of biodiesel). While it was expected that 80% of facilities which signed agreement were to receive funds, this target was met by the Program at the level of 74%.
Contributed to Meeting Federal Regulations Requiring Renewable Content
71. As a key measure of the ecoEBF program’s success, a target was set in the 2007 RMAF for participating proponents to produce at least 2 billion litres of ethanol and 500 million litres of biodiesel annually by 2012, for a total of 2.5 billion litres of renewable fuel production.
72. Program data shows that the Program partially met this target. Funded facilities reported having produced 1.7 billion litres of ethanol (85% of established target) and 126 million litres of biodiesel (25% of established target) in 2011-12, totalling 1.83 billion litres of biofuels. This represented 73% of the overall target of 2.5 billion litres of biofuels expected for 2011-12.
73. The Program’s impact on biodiesel production was more limited than for ethanol production. A certain level of uncertainty associated with the production of biodiesel was predicted during program design, and program management was not able to mitigate the biodiesel production shortfall resulting, to some extent, from the market conditions.
Increased domestic capacity and production of Biofuels
Increased Capacity
74. According to DPR reports, the Program was expected to continue increasing production capacity (i.e. the facility nameplate capacity) for a period of one year after December 2012, and to sustain the achieved levels of production thereafter while the program was in effect. While this target was exceeded for biodiesel in 2012-13, with a capacity of 575 million litres per year (115% of target), it was not quite met by ethanol producers, which reported a capacity of 1,881 million litres per year (94%). However, in 2014-15, while production capacity levels for ethanol remained stable (reported at 1,818 million litres), those for biodiesel decreased by half (reported at 217 million litres) because of the high number of terminated contribution agreements.
Increased Production
75. Beyond its 2012 production and capacity targets, the Program was expected to contribute to produce at least 2 billion litres of ethanol and 500 million litres of biodiesel annually by 2017, for a total of 2.5 billion litres of renewable fuel production. Available evidence shows that this target was partially met, as data provided by the Program indicated domestic biofuel industry production of 1.7 billion litres of ethanol and 430 million litres of biodiesel in 2016-17.
76. Since 2008, based on the proponents reporting on incented production, the total production of biofuels reported by Program proponents increased from 374 million litres in 2008-09 to a high of 1,867 million litres in 2014-15. As shown in the graph below, production was relatively quick to ramp up in the earlier years of the program, largely levelled out between 2011-12 and 2014-15, and then tailed off again as the signed agreements successively started to reach their scheduled end dates.
Graph 1. Production Reported by Proponents, by Year and Type of biofuels (Million Litres)
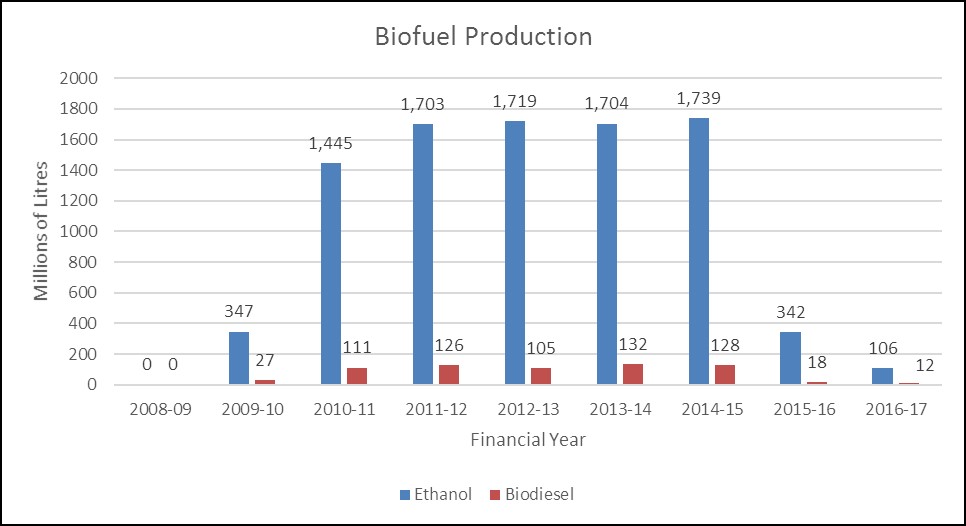
Graph 1. Production Reported by Proponents, by Year and Type of biofuels (Million Litres). Biofuel Production. X axis financial year, Y axis millions of litres. 2008-09 ethanol zero, biodiesel zero. 2009-10 ethanol 347, biodiesel 27. 2010-11 ethanol 1,445, biodiesel 111. 2011-12 ethanol 1,703, biodiesel 126. 2012-13 ethanol 1,719, biodiesel 105. 2013-14 ethanol 1,704, biodiesel 132. 2014-15 ethanol 1,739, biodiesel 128. 2015-16 ethanol 342, biodiesel 18. 2016-17 ethanol 106, biodiesel 12. Source: Program Files.
77. Program data also shows that production levels, throughout the Program implementation period, did not reach expected targets since facilities did not maximize their production. As per table 3, on average, actual production reported by program proponents over the years of the Program was 34% lower than planned (as per proponents’ calculated maximum eligible sales based on the facilities’ nameplate capacity). This gap between planned and actual production varied considerably over the years, from 100% to 3% over the 7 years. On average, actual production was fully one-third lower (34%) than planned.
| 2008-09 | 2009-10 | 2010-11 | 2011-12 | 2012-13 | 2013-14 | 2014-15 | 2015-16 | 2016-17 | Total | Annual Average | |
|---|---|---|---|---|---|---|---|---|---|---|---|
| Planned | 866 | 1,624 | 1,816 | 1,883 | 2,151 | 2,319 | 2,323 | 1,040 | 781 | 14,803 | 1,645 |
| Actual | 0 | 374 | 1,556 | 1,829 | 1,824 | 1,835 | 1,867 | 360 | 117 | 9,762 | 1,085 |
| % difference | -100% | -77% | -14% | -3% | -15% | -21% | -19% | -65% | -85% |
-34% |
-34% |
Source: Program documents and files.
78. This production gap was in part explained by the fact that, between 2009-10 and 2015-16, 18 of the 38 contribution agreements were terminated before their planned completion date. Table 4 below shows that a larger proportion of ethanol facilities (82%) completed their contribution agreement compared to biodiesel facilities (29%).
| Status of Contribution Agreement | Ethanol | Biodiesel | Total |
|---|---|---|---|
| Terminated | 3 (18%)
|
15 (71%)
|
18
|
| Completed | 14 (82%)
|
6 (29%)
|
20
|
| Total | 17 (100%) | 21 (100%) | 38 |
Sources: AMI database; project files.
79. As shown in table 5 below, the most frequent reason for termination (observed for 12 of the 17 agreements) was non-compliance with Article 4.5, which requires a minimum production of 5% of the total annual planned production every 3 months, and in some cases, with Article 7, which relates to the construction and commissioning date of the facility. The second most frequent reason for termination (in 5 cases) was the proponent’s voluntary withdrawal from the program.
| Reasons | Ethanol | Biodiesel | Total |
|---|---|---|---|
| Bankruptcy | 1 | 0 | 1 |
| Non-compliance | 1 | 11 | 12 |
| Withdrawal | 1 | 4 | 5 |
| Total | 3 | 15 | 18 |
Sources: AMI database; project files.
Factors that Impacted Biofuels Production
80. Information from Program representatives and documentation suggests shortfalls in observed production were the result of the market and policy conditions beyond the Program’s control, including economic downturn, refiners’ use of domestic biofuel and evolving biofuel policies in other jurisdictions. Such factors were mentioned in literature and by proponents during interviews and were regularly discussed with them through Program quarterly conference calls. For instance, the 2013 Kent Group report indicated a poor positioning of Canadian refining facilities and other supply infrastructure with respect to ease of access to promising biofuels export markets.
81. In terms of demand, decreases in the price of oil was noted by proponents of thirteen of the completed projects (65%) as a factor impacting their profitability, since such decreases had a negative impact on the demand for biofuels. While perception during interviews indicated positive correlation between both oil and biofuel price, literature (e.g. Timilsina G.R., Oil Price and Biofuels, 2014) shows mixed findings on that relationship. According to Timilsina (2014), only two out of the 45 studies (surveyed during 2007-2012 period) found an impact of biofuels on fossil fuel prices in the long-run. Twenty of those studies found that energy prices influence agricultural feedstock prices, and argued that since feedstock costs represent more than half of the total production costs of crop-based biofuels, energy prices would impact prices of biofuels.
82. Additional factors affecting Program success included provincial incentive programs, feedstock prices, proximity and stability of feedstock sources, transportation availability and costs, and ability to sell co-products (such as distillers dried grains which are of growing importance in feeding livestock and Glycerine which is a versatile and valuable chemical substance with many applications) to increase profit margins. Also, producers that benefit from an integrated business model, whereby the parent company is a guaranteed purchaser of the biofuel given its obligation to blend renewable fuels under federal and provincial mandates, “may be able to withstand prolonged periods of low or negative profits from their ethanol operations, given that their parent companies view this as a compliance option that may be preferable to purchasing from third parties”.
As described in an internal study on the Assessment of Future Viability of Producers (March 2015), having a stable market for their product guarantees these facilities consistent demand for their products and insulates them from market uncertainties.
Developed a Competitive Domestic Renewable Fuels Industry
83. By March 2017, 30 Canadian facilities were expected to be producing renewable alternatives to gasoline and diesel, reaching a total capacity of 3 billion litres as a result of the Program. While this target was only partially met, findings indicate that the Program has contributed to the development of a competitive domestic renewable fuels industry.
84. According to Program files, 21 (7 biodiesel and 14 ethanol) of the 38 proponents that signed a contribution agreement with the program were still in production as of 2014-15. Only five contribution agreements were still active until the end of the Program on March 31, 2017 (12 reached their scheduled end date in 2014-15 and 2 were terminated in 2015-16). The Program did not continue collecting data on the incented facilities’ production volumes once their participation in the Program ended, as this type of reporting was not supported by any contractual obligations. Consequently, it is not possible to know their 2017 production volumes.
85. The Program provided industry wide data from multiple sources (industry associations and Statistics Canada) indicating that, as of 2017, the Canadian biofuel industry was composed of 26 plants producing ethanol, biodiesel, biocrude or methanol. Among them, 21 had claimed incentives from ecoEBF at one time or another during the period covered by the Program. While the total volume of biofuels produced by those incented companies in 2017 were not indicated, 2.25 billion litres (of ethanol, biodiesel, biocrude or methanol) were produced by the whole Canadian industry.
86. Qualitative evidence is equally inconclusive as to the extent to which the renewable fuels industry has become competitive as a result of the Program. While examples were found, through project files, of Program proponents successfully making a profit selling biofuels, results from case studies suggest that some of the facilities may not be able to or may choose not to continue producing biofuels beyond the end of EcoEBF.
87. Four case studies provide a more in-depth examination of the various factors affecting a Program proponent’s success. In all four cases, the participating facilities had struggled at some point with the profitability of their operations, irrespective of their size. All four cases illustrate how, irrespective of the type of biofuel, region or type of facility, market fluctuations for feedstock and renewable fuel had a direct influence on the enterprises’ profit and sustainability. The examined enterprises’ degree of vulnerability to these variables varied according to several internal and external factors, but at one time or another, all four were unable to make a profit from their incented biofuel production.
88. Also, many evaluation interviewees believe that ecoEBF has helped the industry develop, but there is no consensus on whether the industry can be deemed to be competitive. Proponents and industry association representatives tended to be more optimistic than Program and academic representatives about the extent to which the industry is competitive. Some interviewees mentioned that the Program’s impact had been uneven, with some companies realizing success, particularly ethanol and large/well established producers, while many biodiesel and small producers were struggling.
89. Nevertheless, external data (from Bloomberg, FO Licht, and Renewable Industries Canada) shows that in 2016 total Canadian domestic biofuel production capacity had reached 1,700 million litres for ethanol and 430 million litres for biodiesel, an increase from the initial 2007 baseline of 786.1 million litres of ethanol and 92.8 million litres of biodiesel. This growth was attributed by Program representatives to the combined Federal and provincial supports.
PROGRAM EFFICIENCY AND ECONOMY
Program Governance
90. Evidence from the review of documents and key informant interviews indicates that the Program has clearly defined and understood governance, program processes, and roles and responsibilities, but that some improvements could be made to the manner in which various federal and provincial programs targeting the biofuels industry are coordinated.
91. An NRCan 2011 audit of the Program concluded that a sound governance structure was in place and that the roles and responsibilities for Program delivery were clearly defined to ensure accountability and adequate oversight. Similarly, no issues were raised by evaluation key informants regarding program governance or the clarity of roles and responsibilities.
92. Mixed views were found, however, among project proponents regarding Program timelines and clarity of communications. More than half of proponents interviewed mentioned a lack of coordination/ communication among different federal and provincial programs, pointing in particular to duplicative reporting requirements (e.g., Agriculture and Agrifoods Canada’s ecoABC Program; NRCan’s Ethanol Expansion Program; Environment and Climate Change Canada; Finance Ontario; and Ontario and Quebec programs).
PROGRAM CLOSE-OUT
Lesson 8: In order to ensure that programs are closed-out in an effective manner, develop program close-out plans applicable to grants and contributions programs that clearly identifies the roles and responsibilities of program staff and all relevant intra-departmental service providers.
93. The assessment found that the Department does not have a formal plan for the close-out of grant and contribution programs. A formal close-out plan should contain clear roles and responsibilities for program staff and identify interdependent activities requiring a coordinated effort. These interdependencies would include the support services provided by departmental IM/IT, human resources, and finance groups. Without a formal departmental close-out plan, programs must draft and implement their own plans without departmental guidance, often near the end of a program’s period of operation, when human resources are scarce. Lessons learned were identified in clarifying roles, responsibilities, and communication among intra-departmental stakeholders for Program close-out activities.
94. Despite the absence of Departmental guidance for effective grant and contribution close-out, the Program was administering many aspects of the close-out process effectively and in a timely manner at the time of the assessment, including the archiving of documentation and monitoring of proponent compliance with Program terms and conditions. However, some challenges may have been avoided through the preparation and implementation of a formal close-out plan that included: guidance on roles and responsibilities; prudent management of system access rights; and the timely completion and close-out of proponent files. Future sunsetting Programs could benefit from the lessons learned during the Biofuels Program’s close-out.
Lesson 9: In order to inform program design and administration, provide a standardized method for grants and contributions programs to record lessons learned and a means of disseminating them throughout the department.
95. The dissemination of lessons learned throughout the Department allows other programs to make informed decisions and can generate efficiencies. Given the considerable length of time that the ecoEBF Program was in operation and the significance of the funds invested, the assessment team expected that lessons learned would have been recorded, and that a formal venue would have been used to disseminate them throughout the Department, in order to inform other program design and administration. The assessment team found, however, that there was no formal method of disseminating lessons learned in place. Instead, Program knowledge and experience was expected to be shared through the retention and re-assignment of employees throughout the Office of Energy Efficiency and the issuance of internal audit and evaluation reports. Without a formal means of capturing and disseminating this information, the Department risks losing the valuable knowledge derived from all programs, including those that are sunsetting.
APPENDIX A – CRITERIA
96. The criteria were derived from the key controls set out in the Treasury Board of Canada’s Core Management Controls and relevant associated policies, procedures, and directives and the Program Results-based Management and Accountability Framework (RMAF). The criteria guided the fieldwork and formed the basis for the overall assessment conclusion.
97. The objective of this assessment was to assess the effectiveness of the ecoEBF program design and management processes, and to determine whether the Program closeout was performed effectively and that lessons learned were formulated for future programs.
98. The following criteria were used to conduct the assessment:
| Sub-Objectives | Criteria |
|---|---|
|
Sub-Objective 1: |
1.1 An effective risk management strategy has been developed and implemented at the program level, to periodically assess key risks and identify mitigating controls, and was communicated to Senior Management to allow informed decision making. 1.2 The Program was aligned with the Government priorities and NRCan strategic outcomes. 1.3 Internal and external factors were monitored to assess their potential impacts on the achievement of outcomes and on unintended outcomes. |
|
Sub-Objective 2:
|
2.1 Applicant and project risk assessments were designed to identify risks associated with the variable characteristics of the applicants. |
|
Sub-Objective 3: |
3.1 Processes were established to ensure that the Program close-out is performed effectively and with due diligence. |
|
Sub-Objective 4: |
4.1 Areas of enquiry will include best practices, challenges, and risks linked to areas such as program design elements, program delivery, program success, scope of federal intervention, externalities, industry maturity, industry diversity, and inter-dependencies. |
|
Sub-Objective 5: |
5.1 Assessment of the extent to which the Program addressed a demonstrable need as well as the extent to which the Program is appropriate to the federal government. |
|
Sub-Objective 6: |
6.1 Assessment of the extent to which the Biofuels Program has achieved expected outcomes.
6.2 Assessment of any unintended outcomes (positive or negative) which may have resulted from the Biofuels Program. |
APPENDIX B – FINANCIAL INFORMATION
99. The following table presents a financial summary of the Program expenditures from FY 2007-08 to FY 2016-17, based on information received from management.
| Program Expenditures | 2007-08 | 2008-09 | 2009- 10 | 2010- 11 | 2011- 12 | 2012- 13 | 2013- 14 | 2014-15 | 2015-16 | 2016-17 | Total |
|---|---|---|---|---|---|---|---|---|---|---|---|
| Salaries and EBP | 1,188
|
2,127
|
2,484
|
2,664
|
1,780
|
1,854
|
1,895
|
1,589
|
1,277
|
1,020
|
17,878 |
| Operating | 441
|
1,473
|
1,219
|
668
|
616
|
677
|
755
|
586
|
869
|
372
|
7,676 |
| G&C | 0
|
92,182
|
177,678
|
147,083
|
156,766
|
130,047
|
113,656
|
93,943
|
14,904
|
3,654
|
929,913 |
| Corporate operating | 0
|
595
|
943
|
1,291
|
1,192
|
1,093
|
894
|
744
|
595
|
595
|
7,942 |
| Departmental Total | 1,629 | 96,377 | 182,324 | 151,706 | 160,354 | 133,671 | 117,200 | 96,862 | 17,645 | 5,641 | 963,409 |
| PWGSC accommodations | 0
|
|
215
|
215
|
215
|
195
|
195
|
195
|
215
|
215
|
1,875 |
| Program Total | 1,629 | 96,592 | 182,539 | 151,921 | 160,569 | 133,866 | 117,395 | 97,057 | 17,860 | 5,856 | 965,284 |
Source : Program data
APPENDIX C – ECOEBF LOGIC MODEL
| ACTIVITIES What we do |
OUTPUTS What we produce |
IMMEDIATE OUTCOMES Short-term results… |
INTERMEDIATE OUTCOMES Intermediate-term results… |
STRATEGIC OUTCOMES Long-term results |
|---|---|---|---|---|
| Provide an operating incentive to producers of renewable alternatives to gasoline and diesel through contribution agreements:
Stakeholders and interagency collaboration Program awareness building and liaison with Industry Assessment of Producers Applications Selection and monitoring of contribution agreements Monitor program performance and report results |
Briefings, environmental assessment decision reports, reports on market trends, industry data and incentive rates calculation Information materials on program Clear and transparent assessment criteria to judge producers applications Signed contribution agreements and financial support for producers projects Reports on activities, monitoring tools Reports |
Increased awareness of Canadian programs for producers of renewable alternatives to gasoline and diesel
Increased uptake of program, i.e. use of incentives to produce renewable alternatives to gasoline and diesel |
Increased domestic production of renewable alternatives to gasoline and diesel Contribute towards meeting federal regulations requiring renewable content |
Development of a competitive domestic renewable fuels industry Increased domestic production and capacity of renewable alternatives to gasoline and diesel, contributing towards Canada’s role in the development and use of natural resources (NRCan PAA Strategic Outcome #2) |
Page details
- Date modified: