
Overview of Climate Change in Canada
As outlined in Section 2, understanding the risks and opportunities that climate change presents for Canada requires knowledge of not only changes in climate but also the climate sensitivity of key aspects of the Canadian economy and social fabric, and the ability of Canadian governments, industry and individuals to undertake adaptation actions.
Canada is a vast country with great variability between and within regions in terms of climate, landscapes, communities and economy. This diversity is highlighted by contrasting the various regional chapters of this assessment. National-scale trends and projections provide important context for these regional analyses. Over the past half century, changes in climate have resulted in increased temperatures throughout much of Canada, altered precipitation patterns, reduced sea-ice cover, shifting hydrological conditions and changes in some extreme weather events. At the same time, Canada's economy has become dominated by the services sector, while the population has aged and become increasingly urban. In all cases, these trends are expected to continue, with implications for future vulnerability. For example, the services sector is likely less sensitive to changes in climate than the primary resource sector, and the elderly generally have a lower capacity to deal with extreme weather events, such as heat waves. Stronger economies also have more options for adaptation, and are therefore considered better able to adapt.
This section provides an overview of what climate change means for Canada, by examining current conditions, observed trends, and projections for our economy, demographics and climate. A recurrent theme is the importance of scale in assessing vulnerability to climate change. It highlights the fact that aggregate analyses at the national and global scale will inevitably understate the magnitude of the economic and social impacts that will be experienced at regional and local levels.
4.1 THE CANADIAN ECONOMY
Current State
The Canadian economy is large and diversified, with a national GDP of more than $1 trillion. It is mainly a tertiary economy: the services sector represents nearly 70% of GDP, whereas goods-producing industries make up about 30% (see Table 7). In the services sector, finance and insurance are main contributors, along with wholesale and retail trade, health care and public administration. Among the goods-producing industries, manufacturing (e.g. of automobiles, aircraft and pharmaceuticals) accounts for the largest share. Although natural resource-based industries, such as mining, agriculture, forestry, fishing and hunting, make up only a small percentage of GDP at the national scale (see Table 7), they remain a key component of Canada's economy. Historically, these industries played a large role in the development of the country and are still major contributors to foreign trade and the basis of Canadian wealth.
Trends and Projections
The strength of the Canadian economy during the past decade translated into continuous growth of production per capita through both a rising employment rate and growing labour productivity. This increase in productivity, largely attributed to technological development and capital building, should continue in the near and mid-future. Based on present trends, it is reasonable to foresee a sustained growth of the Canadian GDP and an increase in Canada's wealth.
| Millions of constant dollars (1997) | |||||
|---|---|---|---|---|---|
| 2002 | 2003 | 2004 | 2005 | 2006 | |
| Goods-producing industries: | |||||
| Agriculture, forestry, fishing and hunting | 19 721 | 21 632 | 23 047 | 23 777 | 23 373 |
| Mining and oil and gas extraction | 36 345 | 38 287 | 39 469 | 39 750 | 40 157 |
| Manufacturing | 172 130 | 171 499 | 174 992 | 176 497 | 174 992 |
| Construction industries | 54 620 | 56 274 | 59 764 | 63 108 | 67 618 |
| Utilities | 26 982 | 27 221 | 27 366 | 28 562 | 28 042 |
| Services-producing industries: | |||||
| Transportation and warehousing | 46 638 | 47 176 | 49 494 | 51 403 | 52 792 |
| Information and cultural industries | 41 017 | 41 924 | 42 534 | 44 258 | 45 315 |
| Wholesale trade | 57 846 | 60 252 | 63 510 | 68 040 | 73 510 |
| Retail trade | 56 771 | 58 533 | 60 732 | 63 627 | 67 273 |
| Finance and insurance, real estate, and renting, leasing and management of companies and enterprises |
193 595 | 197 828 | 205 480 | 212 385 | 220 507 |
| Professional, scientific and technical services |
43 729 | 45 610 | 46 838 | 48 284 | 49 728 |
| Administrative and support, waste management and remediation services |
21 799 | 22 531 | 23 351 | 24 187 | 25 664 |
| Public administration | 56 346 | 57 882 | 59 084 | 59 902 | 61 527 |
| Educational services | 44 712 | 45 252 | 46 293 | 47 055 | 47 959 |
| Health care and social assistance | 56 933 | 58 369 | 59 477 | 60 305 | 61 572 |
| Arts, entertainment and recreation | 9 130 | 9 117 | 9 223 | 9 283 | 9 529 |
| Accommodation and food services | 23 063 | 22 533 | 22 983 | 23 223 | 24 143 |
| Other services (except public administration) |
24 496 | 25 065 | 25 529 | 26 015 | 26 628 |
| All industries1 | 985 873 | 1 006 985 | 1 039 166 | 1 069 661 | 1 100 329 |
| 1North American Industry Classification Standard | |||||
Climate change will impact a rapidly evolving Canadian economy, in which demographic, commercial and technological changes will exert strong influences on future outcomes. The magnitude of the impacts of climate change on the Canadian economy is thus difficult to predict. Impact modelling suggests that, although overall economic impacts may be slightly positive in the short term at moderate degrees of warming, further warming and associated changes in climate will overwhelm systems, causing net economic losses (Stern, 2006). It must also be stressed that much of the research to date on the economic impacts of climate change considers only changes in mean conditions, rather than extreme events, despite the fact that natural disasters associated with extreme weather events frequently incur significant short- and longer term costs. Losses to regional and local economies from both extreme weather events and gradual, longer term changes in climate could be severe. At the local scale, communities that are reliant on climate-sensitive natural resources may be particularly vulnerable to climate change (see Box 4; Intergovernmental Panel on Climate Change, 2007b).
National-scale roll-ups, where losses or gains are expressed in terms of national GDP, tend to obscure the impacts in smaller provinces and territories. Consider, for example, the collapse of the northern cod fishery in Newfoundland in 1992. This had extreme provincial- and community-level repercussions, including the loss of up to 40 000 jobs (Mason, 2002), and yet was hardly reflected at the scale of national GDP.
Some of the key ways in which climate change will impact the Canadian economy are categorized as follows:
- Impacts from extreme events and natural disturbances: Economic losses from such events in Canada are often in the hundreds of millions of dollars (e.g. Hurricane Juan, Alberta hailstorms, British Columbia wildfires), and even in the billions (1998 Ice Storm, 1996 Saguenay flood; 2001 -2002 national-scale drought). Insect damage to forests and crops may also be significant.
- Impacts on buildings and infrastructure: Included in this category are increased maintenance and protection costs, total loss or replacement costs, and loss of assets. Winter roads (see Chapters 3 and 7), coastal erosion (see Chapters 3, 4, 5 and 8) and permafrost degradation (see Chapters 3 and 5) are key concerns in Canada.
- Impacts on the production and prices of, and the demand for, goods and services: These costs will be manifest both within Canada and internationally (see Chapter 9), and will be both positive and negative.
- Costs related to the impacts on public safety, health and welfare of populations: These costs, although difficult to quantify and predict, may be high. Examples include the effect of vector-borne diseases, the long-term effects of flooding (e.g. mental health, mould issues and financial hardship), and impacts of changing climate on culture and traditional ways of life. Potential benefits may result from less extreme winter weather.
- Impacts resulting from hydrological changes in lakes and streams: Several economic sectors, including energy (e.g. hydroelectricity), tourism and recreation, freshwater fisheries, and transportation will be affected by changing water levels and supply.
Limited data are available on the sensitivity or vulnerability of the services sector in Canada, which now dominates our economy. In the short term, however, it is likely to be less sensitive to slow and/or moderate climate change than the renewable resources sector. For all sectors, continuing climate change means increasing risk that critical thresholds will be reached, triggering long-term future feedbacks (Schneider, 2004) and catastrophic events that would be extremely costly (Stern, 2006).
BOX 4: Resource-dependent communities
Although agriculture, forestry, fishing and hunting account for only about 2% of national GDP (see Table 7), and a maximum of 7% of provincial GDP (Saskatchewan), they are vitally important for the economic well-being of many subregions and communities, where land- and resource-based activities are still the basis of economic life. For instance, more than 1600 Canadian communities are more than 30% reliant on one or more of these industries for their economic well-being (i.e. obtain 30% or more of their employment income from employment in these sectors; Natural Resources Canada, 2006). Of these, 808 communities are reliant on agriculture, 651 on forestry and about 200 on fishing. Note that these estimates do not capture smaller (population <250 people) resource-dependent communities.
Natural resources are also integral to many Aboriginal communities in Canada. The subsistence economy may constitute one-half to one-quarter of the total economy of these communities and be worth about $15 000 per household in the Arctic and half of that in the sub-Arctic (Berkes and Fast 1996; Centre for Indigenous Environmental Resources, 2006). These values, however, are not easily reflected in traditional economic accounting.
Several factors heighten the vulnerability of resource-dependent communities to climate change. These include the high climate sensitivity of many natural resources (agriculture, forestry and fisheries), as well as many factors related to lower adaptive capacity, including limited economic diversification, fewer economic resources available for adaptation, an aging population, and generally more restricted access to services (e.g. greater degree of isolation).
Overall, economic impacts at the community scale can be significant. Aggregate analysis tends to hide critical local impacts and imposed hardships.
4.2 POPULATION AND DEMOGRAPHICS
Current State
Canada has a population of 32.6 million (Statistics Canada, 2006), with a population density of 3.5 people/km 2, among the lowest in the world (Statistics Canada, 2007d). This number, however, is not representative of the regions where most people reside, since more than half of Canada's population lives in the densely populated Quebec City-Windsor corridor.
Trends and ProjectionsFootnote 1
Canada's population grew from 24.3 million in 1981 to 32.6 million in 2006 (Statistics Canada, 2006, 2007e). Two key trends have accompanied this population growth: urbanization and aging. Both of these trends are expected to continue into the future.
In 2001, approximately 80% of the Canadian population lived in cities, with the number of urban dwellers growing by about 50% since 1971. Urban population expansion has resulted both from cities being the preferential location for new immigrants and from the migration of rural residents to take advantage of job opportunities. This demographic is associated with growth in secondary and tertiary industries, but has also been accompanied by an expansion of the urban areas themselves. In 2001, the bulk of the urban areas in Canada were still found in Ontario and Quebec. Rapid expansion of urban areas is also occurring in Alberta and British Columbia.
The elderly are commonly identified as being among the most vulnerable to climate change, especially with respect to health-related impacts. The proportion of elderly persons (age 65 and over) in Canada increased 3% between 1981 and 2005 (from 10 to 13%), and will continue to increase until 2056 under all projection scenarios (Statistics Canada, 2005). Under medium-growth scenarios, the proportion of elderly is projected to almost double in the next 25 years and, by 2056, half the Canadian population would be over 47 years of age. The proportion of the oldest seniors (80 years and over) also increases sharply in every projection scenario. For example, in the medium-growth scenario, about one in 10 Canadians will be 80 years and over by 2056, compared with about one in 30 in 2005. Other populations considered more vulnerable to climate change include children, Aboriginal people, people with pre-existing health conditions and the poor (Health Canada, 2005).
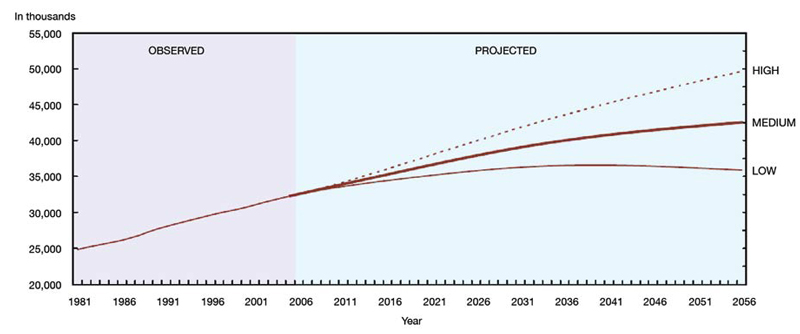
Canada's population will continue to grow between now and 2056 under most scenarios analyzed by Statistics Canada (see Figure 6; Table 8). The medium-growth scenario would bring a 30% increase in the size of the Canadian population by 2056, whereas the high-growth scenario would yield a 53% increase from present. The low-growth scenario projects an increase to 2039, then a gradual decline to 2056. In all the scenarios considered, natural increase would become negative in the medium or long term and migration would become Canada's only source of population growth.

FIGURE 6: Observed (1981-2005) and projected (2006-2056) population of Canada according to three scenarios (Statistics Canada, 2005).
larger image
| Scenario | 2031 | 2056 |
|---|---|---|
| Low growth | 36.3 million | 35.9 million |
| Medium growth | 39 million | 42.5 million |
| High growth | 41.8 million | 49.7 million |
| Population actuelle (2006) : 32,6 millions | ||
The greatest rate of mean annual population growth is projected for British Columbia, followed by Ontario and Alberta (see Table 9). Certain provinces, namely Saskatchewan and Newfoundland and Labrador, are projected to see small declines in population. Population increases are projected to be concentrated largely in the major urban areas of the most populous provinces of Ontario, British Columbia, Alberta and Quebec. Further discussion of provincial and territorial trends is found in the regional chapters of this report. The projection results are more uncertain at the provincial/territorial level than at the national level due to interprovincial migration, which has been highly volatile in the past.
| Province | Population (thousands) | Mean annual growth rate (rate per thousand) |
|
|---|---|---|---|
| 2005 | 2031 | ||
| British Columbia | 4 254.5 | 5 502.9 | 9.9 |
| Alberta | 3 256.8 | 4 144.9 | 9.3 |
| Saskatchewan | 994.1 | 975.8 | -0.7 |
| Manitoba | 1 177.6 | 1 355.7 | 5.4 |
| Ontario | 12 541.4 | 16 130.4 | 9.7 |
| Quebec | 7 598.1 | 8 396.4 | 3.8 |
| Newfoundland and Labrador |
516.0 | 505.6 | -0.8 |
| Prince Edward Island | 138.1 | 149.5 | 3.1 |
| Nova Scotia | 937.9 | 979.4 | 1.7 |
| New Brunswick | 752.0 | 767.2 | 0.8 |
| Yukon | 31.0 | 34.0 | 3.6 |
| Northwest Territories | 43.0 | 54.4 | 9.1 |
| Nunavut | 30.0 | 33.3 | 4.0 |
4.3 CLIMATE TRENDS AND PROJECTIONS
Observed Trends - Temperature and Precipitation
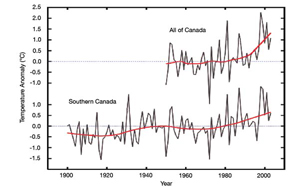
FIGURE 7: Annual national temperature departures and long-term trend, 1948 to 2006 (Environment Canada, 2006).
larger image
The influence of anthropogenic climate change on Canada is evident in observed trends and temperatures simulated by global climate models (Zhang et al., 2006). These changes are already impacting human and natural systems (cf. Gillett et al., 2004). Observational data have been collected in southern Canada for more than a century and in other parts of Canada since the mid -twentieth century. These data, together with satellite data from the past 25 years or so, provide a detailed picture of how Canadian climate and associated biophysical variables have changed in recent decades. This section provides an overview of the observed changes; for more detailed discussion, readers are referred to Barrow et al. (2004) and Hengeveld et al. (2005).

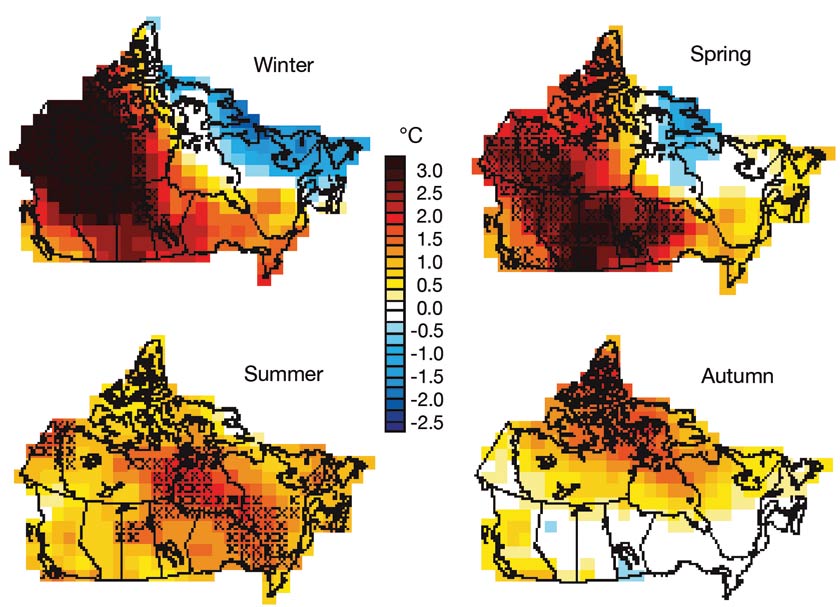
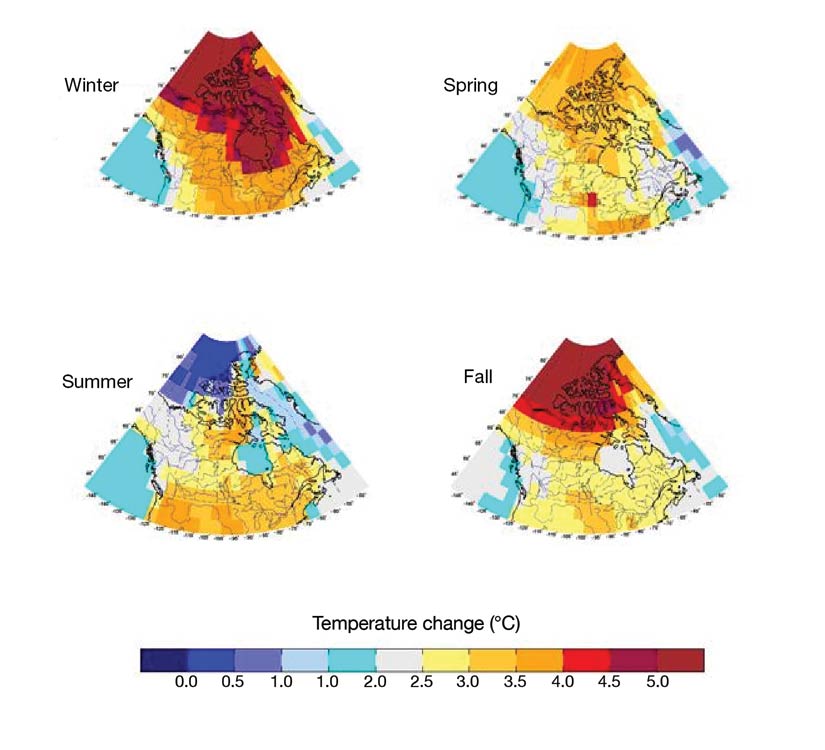
FIGURE 8: Regional distribution of linear temperature trends (°C) observed across Canada between 1948 and 2003, by season. The "X" symbols indicate areas where the trends are statistically significant. Source: Hengeveld et al. (2005).
larger image
On average, Canada has warmed by more than 1.3°C since 1948 (Figure 7), a rate of warming that is about twice the global average. During this time period, the greatest temperature increases have been observed in the Yukon and Northwest Territories. All regions of the country have experienced warming during more recent years (1966 -2003; McBean et al., 2005), including the eastern Arctic, where there has been a reversal from a cooling trend to a warming one, starting in the early 1990s (Huntington et al., 2005a; Nickels et al., 2006).
On a seasonal basis (Figure 8), temperature increases have been greater and more spatially variable during the winter and spring months. In northwestern Canada, winter temperatures increased more than 3 °C between 1948 and 2003. During the same period, winter and spring cooling trends (up to -2.5°C) were observed in parts of the eastern Arctic. Summer warming has been both more modest and more uniform in space, whereas warming in the autumn period has been largely confined to Arctic regions and British Columbia (Figure 8).
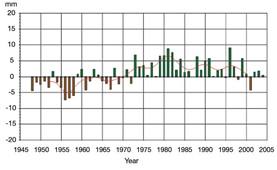
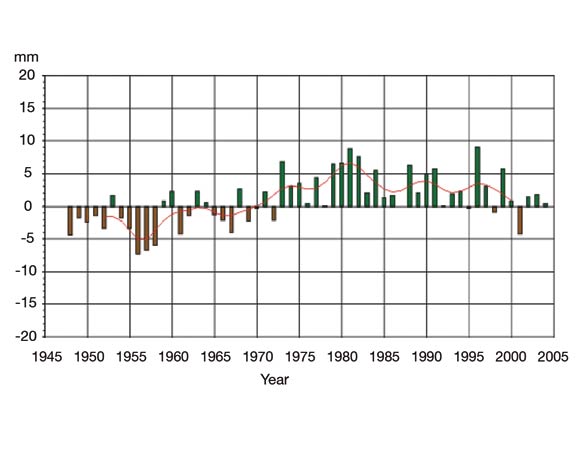
FIGURE 9: Trends in annual departures of average annual precipitation across Canada from the 1951 to 1980 normals, with weighted running mean. Source: Environment Canada.
larger image
National trends in precipitation (Figure 9) are more difficult to assess, primarily because of the discontinuous nature of precipitation and its various states (rain, snow and freezing rain). Nevertheless, Canada has, on average, become wetter during the past half century, with mean precipitation across the country increasing by about 12 % (Environment Canada, 2003).
Changes in precipitation have also varied by region and season (Figures 10, 11) since 1950. Annually averaged, the largest percentage increase in precipitation has occurred in the high Arctic, while parts of southern Canada (particularly the Prairies) have seen little change or even a decrease (Figure 10). For example, over most of Nunavut, annual precipitation has increased by 25 to 45%, whereas the average increase in southern Canada has been 5 to 35% (Environment Canada, 2003).
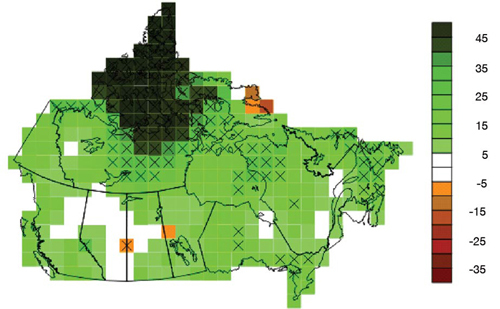
FIGURE 10: Regional distribution of linear annual precipitation trends (% change) observed across Canada between 1948 and 2003. The "X" symbols indicate areas where the trends are statistically significant Source: Zhang et al. (2000), updated in 2005.
larger image
Seasonal trends since 1950 indicate that most of the Arctic has become wetter in all seasons. Southern British Columbia and southeastern Canada also show regions with significant increases in precipitation in spring and autumn. In contrast, most of southern Canada except the western part of southern Ontario, which has seen increased lake effect snow (see Chapter 6), has experienced a significant decline in winter precipitation.
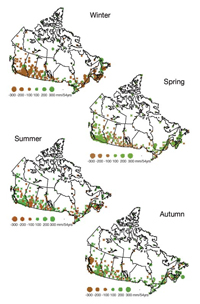
FIGURE 11: Changes in precipitation since 1950, by season. Data are presented as total change over the full 54 years of data, expressed in mm. The magnitude of change is indicated by the size of the circle, with green indicating an increase and brown a decrease. The crosses denote areas where trends are not statistically significant. Source: Environment Canada.
larger image
Changes in the frequency of extreme temperature and precipitation events have been observed in Canada from 1950 to 2003, including (from Vincent and Mekis, 2006):
- fewer extreme cold nights,
- fewer extreme cold days,
- fewer frost days,
- more extreme warm nights,
- more extreme warm days,
- more days with precipitation,
- decrease in mean amount of daily precipitation,
- decrease in maximum number of consecutive dry days,
- decrease in annual total snowfall (southern Canada), and
- increase in annual total snowfall (northern and northeastern Canada).
Accompanying these changes has been a significant decline in the number of heating-degree days. There are also significant changes at the regional scale in the numbers of intense precipitation events. On average, the fraction of precipitation falling as intense events (the upper 10%) has been decreasing in southern Canada but increasing in northern Canada, particularly in the northeast. Also, more of the precipitation is falling as rain rather than snow.
| Region | ET trend mm/yr |
ET change mm over 40 yrs |
|---|---|---|
| Pacific Coast | 1.16 | 46.40 |
| South BC | 1.24 | 49.68 |
| Yukon | 0.06 | 2.24 |
| Prairies | 0.03 | 1.12 |
| Mackenzie | 0.24 | 9.80 |
| Northwest forest | 0.22 | 8.80 |
| Northeast | 0.75 | 30.00 |
| Great Lakes | 0.69 | 27.56 |
| Atlantic | 1.04 | 41.48 |
| Tundra | 0.16 | 6.48 |
Other Observed Changes
Changes in temperature and precipitation during the past 50 to 100 years have led to changes in other variables, including sea ice, snow cover, permafrost, evaporation and sea level. These changes, as well as their implications for the environment, the economy and society, are discussed in detail in the regional chapters of this report. This section simply highlights key observations. The cryosphere has responded to observed warming. For example, the extent of Arctic sea ice during the late summer season has decreased by 8% since 1979 (Figure 12). Snow-cover duration, on average, has decreased by about 20 days in the Arctic since 1950 (Figure 13). Annual total snow amount has increased in some Arctic regions (Taylor et al., 2006), however, because higher temperatures induce higher humidity, which results in more precipitation. A general increase in thaw depth was observed through the 1990s across the Canadian permafrost regions (e.g. Brown et al., 2000; Nixon et al., 2003; Smith et al., 2005). Shallow permafrost temperatures increased during the last two to three decades of the twentieth century by 0.3 to 0.5 °C per decade in the Canadian high Arctic (Taylor et al., 2006), and ranged from no change to almost 1 °C per decade in the western Arctic (Smith et al., 2005).
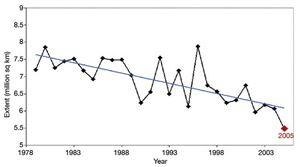
FIGURE 12: Trends in minimum (September) Arctic sea-ice extent from 1978 to 2005, as recorded by NASA satellites. The trend from 1979 to 2005, now showing a decline of more than 8% percent, is shown with a straight blue line. Source: National Snow and Ice Data Center (2005).
larger image
Recent declines in the volume of glacial meltwater in western Canada (Demuth et al., 2002), and precipitation changes and increased evaporation elsewhere (linked to higher temperatures), have altered water resources across much of Canada (Shabbar and Skinner, 2004). Actual evapotranspiration rates (AET) have, on average, increased in most regions of the country during the last 40 years (Table 10), although the trend is weak or inconsistent in some areas (Fernandes et al., 2007) due to limited availability of water to evaporate. For example, evapotranspiration rates have decreased slightly in the dry regions of the Prairies, where water (to evaporate) is already limited throughout much of the year (Huntington, 2006; Fernandes et al., 2007). Although many areas of the country are expected to experience an increase in precipitation (see Figure 14), this may not be sufficient to offset the AET increase due to temperature rise. In the Great Lakes area, for example, a 1 °C increase in mean annual temperature was associated with a 7 to 8% increase in AET (see Fernandes et al., 2007), resulting in a decrease in water availability.
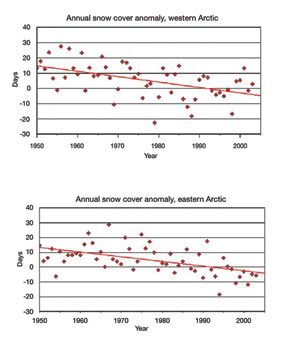
FIGURE 13: Trends in Canadian Arctic snow-cover duration, measured as change in days relative to 1990. Source: Ross Brown, Environment Canada, pers. comm., 2007.
larger image
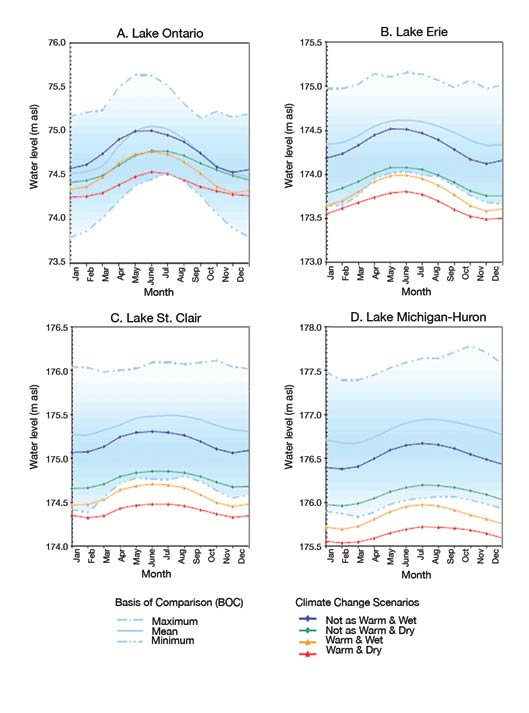
Water levels in lakes across Canada have varied considerably over time, and recent trends toward lower levels in the upper Great Lakes, in association with higher temperatures, have been quite dramatic (Mortsch et al., 2006). Water levels in the Great Lakes are generally projected to continue to drop in the future (see also Chapter 6; Moulton and Cuthbert, 2000; Mortsch et al., 2006; Figure 15).
During the past century, global ocean levels have risen an estimated 0.17 m (range 0.12 -0.22 m; Intergovernmental Panel on Climate Change, 2007a). The magnitude of relative sea-level rise along Canadian coastlines depends upon whether the coast is experiencing crustal (glacioisostatic) rebound or subsidence as a result of the deglaciation that took place thousands of years ago. For example, in some parts of Canada, such as around Hudson Bay, land has continued to emerge despite increasing global sea levels. However, regional land subsidence in other regions, including most of the Atlantic coastline, has doubled the rate of local sea-level rise in some areas (McCulloch et al., 2002). In Charlottetown, for instance, relative sea level rose 32 cm over the twentieth century (Forbes et al., 2004). Additional geophysical factors influencing relative sea-level changes in Canada include tectonic activity along the Pacific coast and subsidence due to extensive sediment deposition, particularly in the Fraser River and Mackenzie River deltas. Along the west coast, relative sealevel change has been lower, with sea level rising by 4 cm in Vancouver, 8 cm in Victoria, 12 cm in Prince Rupert and dropping by 13 cm in Tofino over the twentieth century (British Columbia Ministry ofWater, Land and Air Protection, 2002). In the north, the Yukon coast and the directly adjacent Northwest Territories coast are subsiding, making relative sea-level rise in these regions greater than along most of the Arctic coast (Barrow et al., 2004).
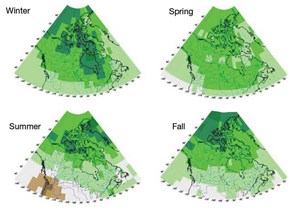
FIGURE 14: Seasonal change in precipitation by the 2050s (relative to 1961-1990), based on the median of seven global climate models and using the emissions scenarios of the Special Report on Emissions Scenarios (SRES).
larger image
Projections - Temperature and PrecipitationFootnote 2
All of Canada, with the possible exception of the Atlantic offshore area, is projected to warm during the next 80 years. In most cases, future changes in climate will involve a continuation of the patterns, and often an acceleration of the trends, discussed above. Therefore, amounts of warming will not be uniform across the country (see Figure 16). During the present century, temperature increases will be greatest in the high Arctic, and greater in the central portions of the country than along the east and west coasts (Figure 16). Regional differences in temperature projections are also illustrated in Figure 17, which shows historical and projected change in temperature for six cities across Canada.

FIGURE 15: Projected changes in water levels for the Great Lakes (Mortsch et al., 2006).
larger image
On a seasonal basis, warming is expected to be greatest during the winter months (Figure 16), due in part to the feedback effect that reduced snow and ice cover has on land-surface albedo. Winter warming by the 2050s is expected to be most pronounced in the Hudson Bay and high Arctic areas, and least in southwestern British Columbia and the southern Atlantic region. A decrease in the winter diurnal temperature range across the country indicates that winter nights will likely warm more than winter days (Barrow et al., 2004). This pattern was not found for the other seasons. Rates of warming will be lower in the summer and fall, and summer warming is projected to be more uniform across the country. These patterns are consistent with the observed trends presented above.
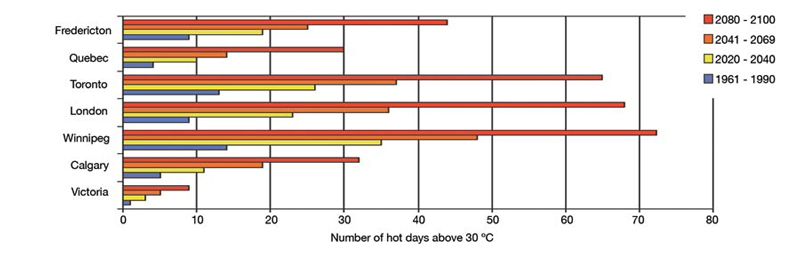
The frequency of extreme warm summer temperatures (exceeding 30°C) is expected to increase across Canada (see Figure 18; Kharin et al., 2007). Heat waves are projected to become more intense and more frequent. The health impacts of extreme heat, as well as effective adaptation measures to deal with heat waves, are discussed in several of the regional chapters (e.g. Chapters 5, 6 and 7). At the same time, extreme cold days are projected to decline significantly (Kharin et al., 2007), resulting in an overall reduction in the climate severity index (Barrow et al., 2004).
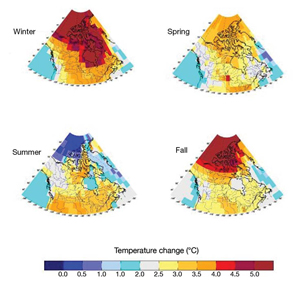
FIGURE 16: Seasonal change in temperature across Canada by 2050 (relative to 1961-1990), based on the median of seven global climate models and using the emissions scenarios of the Special Report on Emissions Scenarios (SRES).
larger image
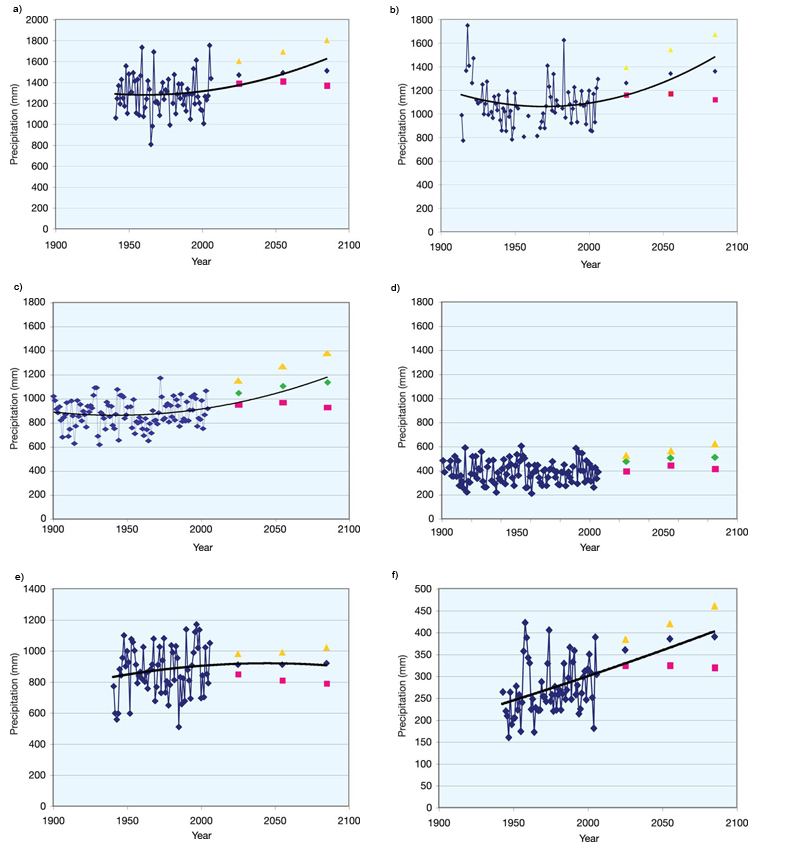
Future precipitation is more difficult to project, and changes are generally of lower statistical significance, than changes in temperature (Barrow et al., 2004). This is reflected in the wide range in model results for projected precipitation (see Figure 19). Annual total precipitation is projected to increase across the country during the current century. By the 2080s, projected precipitation increases range from 0 to 10% in the far south up to 40 to 50% in the high Arctic. Due to enhanced evapotranspiration, driven by higher temperatures, many regions will experience a moisture deficit despite greater amounts of precipitation.
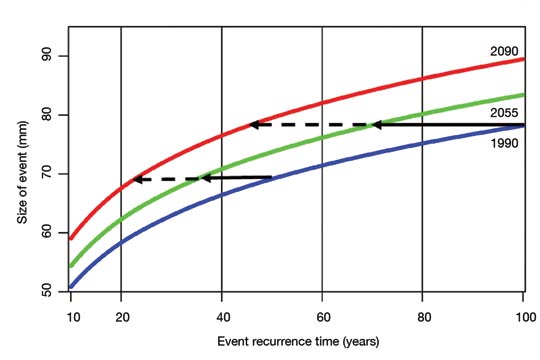
Seasonal changes in precipitation will generally have greater regional-scale impacts than the annual totals. Throughout most of southern Canada, precipitation increases are projected to be low (0 -10% by the 2050s) during the summer and fall months. In some regions, especially the south-central Prairies and southwestern British Columbia, precipitation is even expected to decline in the summer (Figure 14). This means less available precipitation during the growing season in important agricultural regions. Other important changes in precipitation include an increase in the percentage of precipitation falling as rain rather than snow, and an increase in extreme daily precipitation (Figure 20; Kharin and Zwiers, 2000).
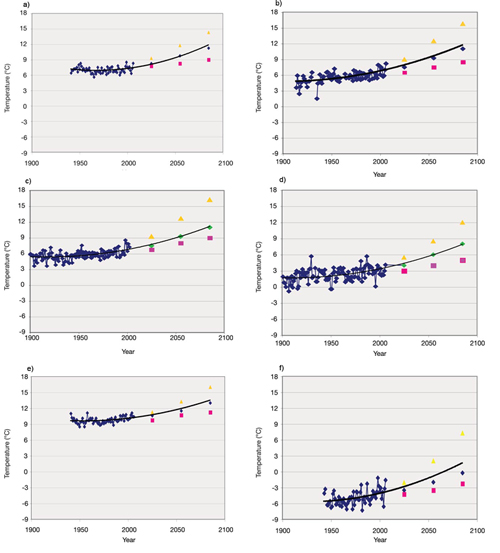
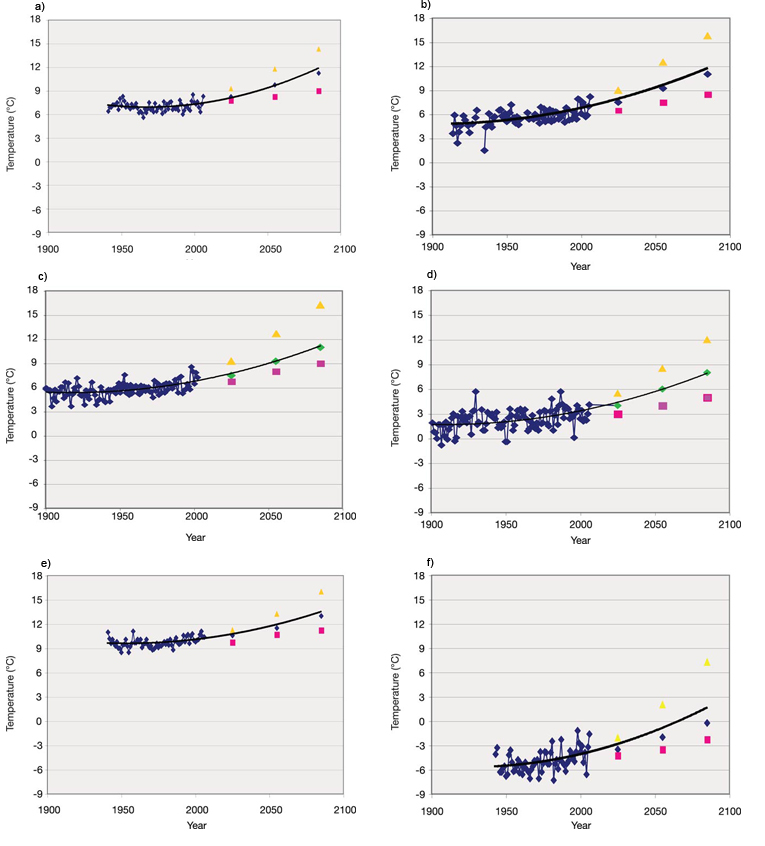
FIGURE 17: Historical trends (blue diamond) and projected maximum (yellow triangle), median (green diamond) and minimum (pink square) annual mean temperature scenarios for the 2020s, 2050s and 2080s for six cities across Canada: a) Yarmouth, NS; b) Drummondville, QC; c) Ottawa, ON; d) Regina, SK; e) Victoria, BC; and f) Yellowknife, NT. Note historical data presented are limited by data availability, and projected changes are derived from a range of global climate models using the emissions scenarios of the Special Report on Emissions Scenarios (SRES).
larger image

FIGURE 18: Number of days with temperatures exceeding 30ºC, during observed (1961-1990) and future (2020-2040; 2041-2069; and 2080-2100) time periods (Hengeveld et al., 2005)
larger image
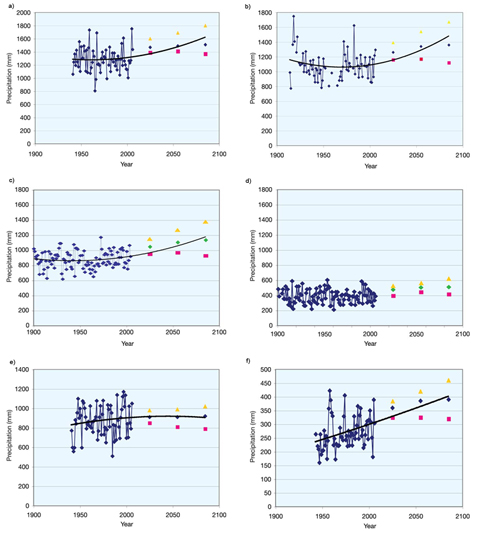
FIGURE 19: Historical trends (blue diamond) and projected maximum (yellow triangle), median (green diamond) and minimum (pink square) total annual precipitation scenarios for 2020s, 2050s and 2080s for six cities across Canada: a) Yarmouth, NS; b) Drummondville, QC; c) Ottawa, ON; d) Regina, SK; e) Victoria, BC; and f) Yellowknife, NT. Note historical data presented are limited by data availability, and projected changes are derived from a range of global climate models using the emissions scenarios of the Special Report on Emissions Scenarios (SRES).
larger image
Other Projected Changes
Sea level will continue to rise during the current century, with global projections of 0.18 to 0.59 m by 2100 (Intergovernmental Panel on Climate Change, 2007a). Relative sea-level changes in Canada will continue to exhibit similar patterns to those observed during the twentieth century. Therefore, regions of rebound (e.g. Hudson Bay, parts of the British Columbia coast and the Labrador coast) will generally experience lesser impacts as a result of sea-level change than areas that are currently subsiding (e.g. Beaufort Sea coast, much of the Atlantic coast and the Fraser River delta). The influence of sea-level rise on coastal communities and activities such as shipping and tourism are discussed in detail in Chapters 3, 4, 5 and 8. As sea level rises, the risk of storm-surge flooding increases. Such flooding will likely occur more frequently in the future, particularly in areas already impacted by these events. For example, storm-surge flooding in Charlottetown, which occurred six times between 1911 and 1998, is likely to occur every year by 2100 unless significant adaptation measures are implemented to protect the city (McCulloch et al., 2002).
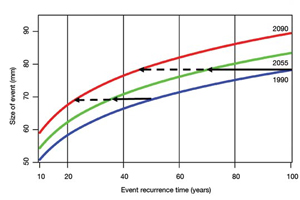
FIGURE 20: Projected changes in extreme 24-hour precipitation events, North America between latitudes 25°N and 65°N (based on Kharin and Zwiers, 2000). Source: Environment Canada.
larger image
There is not a simple direct relationship between sea ice and temperature because complex interactions, associated with changes in atmospheric and ocean circulation patterns (e.g. the Arctic and North Atlantic oscillations), strongly influence sea-ice patterns (Barrow et al., 2004). Patterns of sea-ice reduction will therefore continue to vary locally and regionally, as they have during the past century (Barrow et al., 2004). Arctic sea-ice extent will, however, decrease during the twenty-first century, and summer ice extent will change more than winter ice extent (Intergovernmental Panel on Climate Change 2007a; Anisimov et al., 2007). Although climate models vary in estimating the rate of ice decline (see Chapter 3), several scenarios indicate that large areas of the Arctic Ocean will be seasonally ice free before the end of the twenty-first century (Solomon et al., 2007).
Sea-level rise, storms and decreases in sea ice will all increase the rate of coastal erosion (see also Chapters 3 and 4; Manson et al., 2005). In northern regions, permafrost degradation will make coastal areas further susceptible to erosion.
4.4 CONCLUSIONS
Canada's climate is changing, and projections show that it will continue to change in the future. In addition to gradual shifts in average temperature and precipitation, changes in temperature and precipitation extremes, sea level, storm surges, sea ice and other climate and climate-related parameters have been both observed and projected. These changes will continue to occur across a backdrop of social and economic changes, which will greatly influence net impacts. Regional differences in projected climate, sensitivity and factors influencing adaptive capacity (e.g. access to economic resources, population demographics) mean that vulnerability varies greatly across the country, both within and between regions. These differences are highlighted throughout the regional chapters of the report.
Page details
- Date modified: