
Regional Context: Current and Future
This section provides an overview of several factors that influence vulnerability to climate change in Ontario. These include the many non-climatic factors that influence adaptive capacity, including demographics, human health determinants, economic activities and institutional capacity. Emphasis is placed on populations considered vulnerable to climate change, as well as factors deemed to be critical to ensuring continued economic development. Historical trends and future projections of climate provide context for assessing how changes in exposure are likely to influence vulnerability.
2.1 POPULATION AND HEALTH STATUS
Over the past 20 years, Ontario's population has increased by almost 3.3 million to more than 12.5 million, with growth concentrated in urban centres, particularly the Greater Toronto Area (GTA), the Kitchener-Waterloo-Cambridge region, the Hamilton and Niagara region, and Ottawa (Statistics Canada, 2002). Almost 85% of Ontario's population lives in urban areas, reflecting a continuing rural to urban migration trend. Of the approximately 250 000 annual immigrants to Canada, about half choose the GTA as their primary destination (McIsaac, 2003). The central and north subregions of the province are generally characterized by rural depopulation. Although the populations of some remote and resource-based communities have remained stable, others have experienced significant declines (Table 1). These trends are expected to continue.
| Community | Population | % change | |
|---|---|---|---|
| 1996 | 2001 | ||
| Greenstone | 6530 | 5662 | -13.3 |
| Kirkland Lake | 9905 | 8616 | -13.0 |
| Elliot Lake | 13 558 | 11 956 | -12.0 |
| Iroquois Falls | 5714 | 5217 | -8.7 |
| Timmins | 47 499 | 43 686 | -8.0 |
| Kapuskasing | 10 036 | 9238 | -8.0 |
Aboriginal communities are found throughout the province. In 2001, 1.7% of the provincial population was Aboriginal, of which more than 70% were First Nations peoples, with Inuit and Métis peoples representing less than 1% and about 26% of the total Aboriginal population, respectively. In Ontario, 78% of Aboriginal people live off-reserve, many them in the census metropolitan areas of Toronto (Statistics Canada, 2006a).
In general, the health of Ontario's population is high, compared to the Canadian average and that of other countries. Life expectancy is a widely used indicator of population health, and the Ontario average has been consistently higher than the national average (Federal, Provincial and Territorial Advisory Committee on Population Health, 1999). There are, however, some significant differences in health status among subpopulations. Urban populations, especially in and around the GTA, tend to be healthier than their rural counterparts (Altmayer et al., 2003). Women, and especially Aboriginal women, are at particular risk in rural areas due to social and environmental conditions, health behaviours and access to health care (Grace, 2002; Ontario's Women's Health Council, 2002). Studies also indicate that the health of women, children and youth tends to be lower in the central and north subregions, compared to the south (Northern Ontario Perinatal and Child Health Survey Consortium, 2002; Haque et al., 2006).
Population projections for 2031(Ontario Ministry of Finance, 2006) include the following:
- The population of Ontario will grow by 31%, to 16.4 million, with relatively steady growth rates of 140 000 to 160 000 people per year.
- In the south subregion, more than 60% of growth will occur in the GTA, which will increase from 5.8 million in 2005 to more than 8 million by 2031. Population in the remainder of the south subregion is also projected to increase, from about 6 million in 2005 to more than 7.5 million by 2031.
- The central and north subregions are projected to experience a 7.4% decline in population, falling from about 810 000 in 2005 to below 750 000 by 2031.
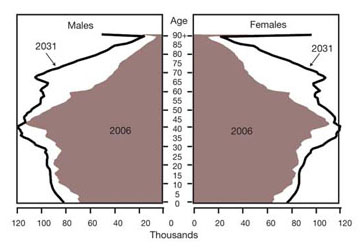
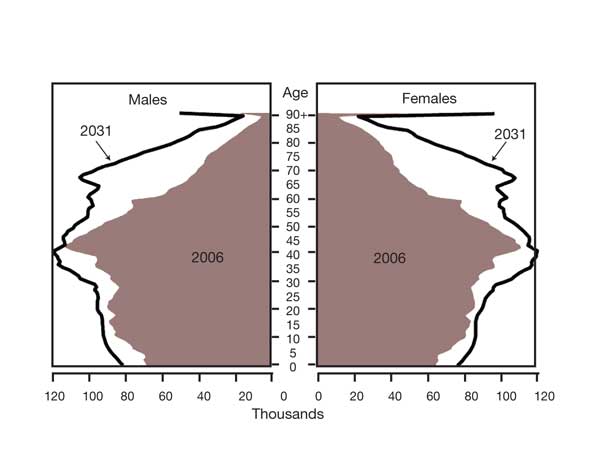
FIGURE 2: Ontario population pyramids, 2006 and 2031 (Ontario Ministry of Finance, 2006).
text version - figure 2
Figure 2: A population pyramid showing the age distribution of males and females in Ontario in 2006, and projected for 2031. The key message of this graphic is that by 2031, there would be a higher dependency ratio, with more children under 15 years of age and persons over 65 years of age compared to the core working age population. Projections are very similar for both males and females.
Ontario's population will also be aging over the next two decades, which will result in a considerably different age distribution (Figure 2) and higher dependency ratios (the ratio of children under 15 years of age and persons over 65 years of age to the core working age population). There are exceptions to this trend, however, most notably in northern First Nations communities, where a shift towards a more youthful population is projected, and in the case of immigrants, whose average age tends to be considerably younger than that of established Ontario residents (Ontario Ministry of Finance, 2006).
2.2 GOVERNMENT AND INSTITUTIONS
In Ontario, all three levels of government play a fundamental role in shaping the social, economic and institutional landscape of the province, and therefore also strongly influence the region's capacity to adapt to changing climate. The governance system is highly integrated and complex, combining formal and informal agencies, in some cases resulting in blurred areas of responsibility. Many sectors that will be impacted by climate change, such as managing natural resources, generating and delivering electricity, and providing health care services, fall largely under provincial authority. Municipalities implement and enforce national and provincial policies, supply essential services such as drinking water and play a fundamental role in land-use planning. Establishing national standards and guidelines, managing cross-border issues and providing essential services in Aboriginal communities fall under federal jurisdiction.
2.3 ECONOMIC GROWTH AND DEVELOPMENT
Economic growth in Ontario has been relatively strong during the past two decades, with gross domestic product (GDP) annual growth rates of around 3.0% (Ontario Ministry of Finance, 2005). Economic growth is expected to slow to 2.3% but remain strong until 2025. The Ontario economy has been shifting from manufacturing towards the service sector, and this trend is expected to continue. However, manufacturing productivity has risen and it is expected that the sector will continue to be an important part of the economy, particularly in southern Ontario (Ontario Ministry of Finance, 2005). Transportation continues to dominate the manufacturing sector, followed by food, petroleum products and chemicals, primary metals and forestry/paper products. Economic activity and growth are regionally diversified, and the agriculture and resource sectors will remain important in rural regions. Many Ontario communities obtain 30% or more of their employment income from the natural resource sectors, primarily agriculture and forestry (Figure 3).
In 2004, Ontario had Canada's largest tourism industry, which made a greater contribution to provincial GDP than agriculture, forestry/paper, commercial fishing/hunting and mining industries combined, and accounted for 3.3% of the province's total employment (Ontario Ministry of Tourism, 2006). Tourism has become increasingly important in many rural non-farm areas, and some communities are now highly dependent upon this sector. Through the ongoing industrialization of agriculture, farm numbers continue to decline, farm productivity continues to increase and conventional farm activity continues to become more spatially concentrated. In 2001, there were 186 000 people living on 60 000 farms across Ontario, a decline of 11 and 15%, respectively, from 1996 (Statistics Canada, 2003b). Some agricultural areas have undergone considerable change due to non-climatic factors, such as the rapid decline of the tobacco industry in the southwestern part of the south subregion and the replacement of tender fruit orchards (peaches, cherries) with vineyards (and the associated wine industry) in the Niagara region. Farmers have been adopting more ecologically sound management practices that should promote longer term sustainability. However, a rapidly aging farm population (Statistics Canada, 2003b) is placing substantial pressures on the agricultural sector.
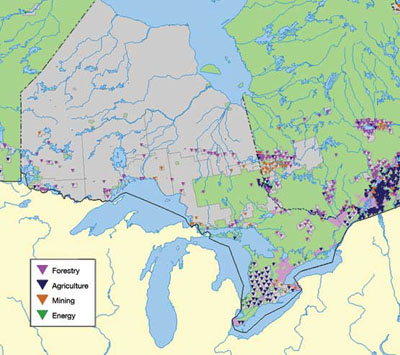
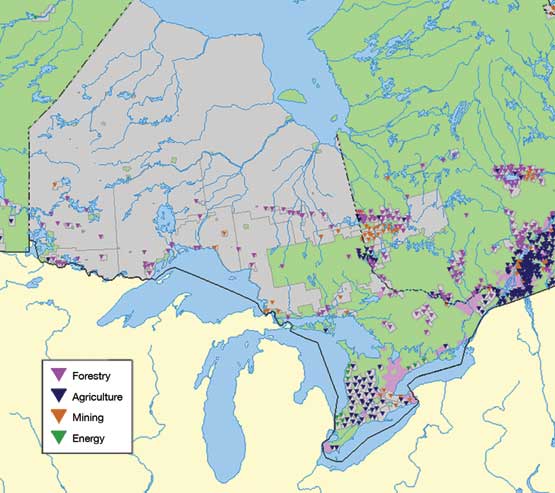
FIGURE 3: Communities in Ontario more than 30% reliant on resourcebased industry (Natural Resources Canada, 2001).
text version - figure 3
Figure 3: A map of Ontario illustrating the distribution of communities more than 30% reliant on resource-based industries, including mining, forestry, agriculture and energy. In the southern region of the province, there is a dense distribution of communities dependent on agriculture and a few mining dependent communities. Over the remainder of the province, there are several forest-dependent communities (spread throughout) and few mining and energy dependent communities
Many communities in the central and north subregions continue to be resource based, dependent on forestry, pulp-and-paper activities and mining, while many Aboriginal communities rely on hunting, trapping and agriculture to offset the high cost of non-traditional foods. Aboriginal communities throughout the province lead ways of life that are closely tied to the natural environment. The Walpole Island First Nation in the south subregion contains some of the most biologically diverse areas in Canada, which support traditional harvesting and practices such as hunting, fishing and trapping, in addition to a large market economy based on recreation and tourism (Resource Futures International, 2004).
2.4 ENERGY GENERATION, TRANSMISSION AND DEMAND
Ontario's socioeconomic outlook is very closely linked to availability of a stable source of power for industrial, commercial and residential use. Currently, Ontario's installed generation capacity of approximately 30 000 megawatts (MW) includes a diverse range of energy sources (nuclear, coal, natural gas and renewable sources) that are responsible for varying amounts of electricity production (Figure 4). There is an extensive electricity transmission grid throughout the populated areas of the province, whereas some northern communities remain off the grid and generate their own electricity. In the past decade, the electricity system has experienced two catastrophic events: a severe ice storm in 1998 that affected most of southeastern Ontario, Quebec and New Brunswick, and a blackout in August 2003 that affected most of Ontario and the northeastern United States. Most urban centres are well supplied with natural gas, whereas alternative fuels (in addition to electricity), such as propane, wood and diesel, predominate in rural, central and northern markets. Much of Ontario's electricity transmission grid is more than 50 years old. Most municipal electrical distribution lines tend to be above ground in older well-established neighbourhoods and underground in newer suburban developments and redeveloped commercial centres.
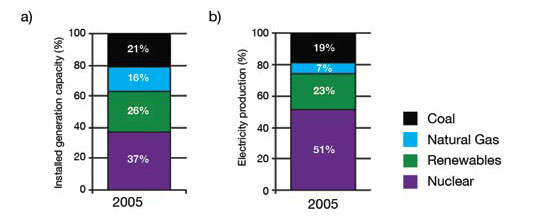
FIGURE 4: Ontario's electricity system, 2005 (Ontario Power Authority, 2005): a) installed generation capacity, and b) electricity production.
text version - figure 4
Figure 4: Two graphs illustrating Ontario’s electricity system in terms of
- installed generation capacity and
- electricity production.
Each bar graph is broken down in 4 sections – coal, natural gas, renewables and nuclear. In terms of generation capacity, nuclear dominates (at 37%), followed by renewables (26%), natural gas (16%) and coal (21%). In terms of electricity production, patterns are similar, with nuclear at 51%, renewables at 23%, natural gas at 7% and coal at 19%.
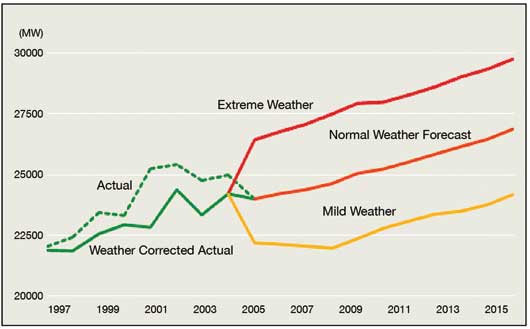
The Independent Electricity System Operator (IESO) forecasts that, without energy conservation strategies, energy consumption will grow from about 157 terawatt•hours (TW•h) in 2006 to about 170 TW•h in 2015, an average annual growth rate of 0.9% (Independent Electricity System Operator, 2005). However, effective energy conservation and efficiency measures could keep energy supply and demand in balance, even with increases in population (Gibbons and Fracassi, 2005; ICF Consulting, 2005, 2006). A stable electricity network must be able to handle peak demand. Ontario 's electricity demand now peaks in the summer months due to the increased use of air conditioners and other cooling devices during heat waves, whereas warmer winter temperatures, increased energy efficiency and wider use of natural gas for home heating have decreased winter peak demand. The IESO forecasts that normal-weather peak demands will increase by 11% from about 24 200 MW in 2006 to 26 900 MW in the summer of 2015, and possibly 30 000 MW under extreme weather conditions (Figure 5), depending upon the success of efficiency and conservation measures. The upper limit of these projections is based on cold winters and/or hot summers, whereas the lower limit considers mild winters and cool summers. Climate change is not factored into these forecasts. New demand records were set during the summers of 2005 (26 160 MW on July 13) and 2006 (27 005 MW on August 1), caused in part by prolonged heat waves and extremely warm night-time temperatures (Independent Electricity System Operator, 2006).
For much of the past decade, the Ontario government has been examining ways of phasing out coal-fired electricity generation. A commitment to phasing out 6500 MW of coal-fired generation in Ontario has been targeted for 2014; if implemented, this will result in a supply and demand gap that will have to be addressed through a combination of new sources and energy efficiency (Legislative Assembly of Ontario, 2002). To help meet this gap, the Ontario government announced in 2004 a Renewable Portfolio Standard of 5 percent (1350 megawatts) of new renewable energy by 2007 and 10 percent (2700 megawatts) by 2010 (Robson and Gruetzner, 2004). In addition to new sources within the province, such as wind and water power (Figures 6 and 7), long-distance transmission from large-scale hydroelectric projects in Manitoba, Quebec and Newfoundland are also options being considered. During the past 30 years, Ontario has demonstrated a substantial capacity for energy efficiency and greater energy intensity use, and there remains much potential for savings in both residential and industrial sectors (ICF Consulting, 2005, 2006).

FIGURE 5: Hourly peak demand forecasts under three weather scenarios (Independent Electricity System Operator, 2005).
text version - figure 5
Figure 5: A graph depicting observed and projected changes in hourly peak demand (measured in MW) under three weather scenarios -
- Mild Weather
- Normal Weather Forecast and
- Extreme Weather
- for the period 1997-2015. All projections show an increasing trend over time, with the highest MW projected for 2015. Greatest demand is projected under the Extreme Weather scenario, with demand reaching almost 30 000 MW by 2015. Current (2005) demand was observed at approximately 24 000 MW.
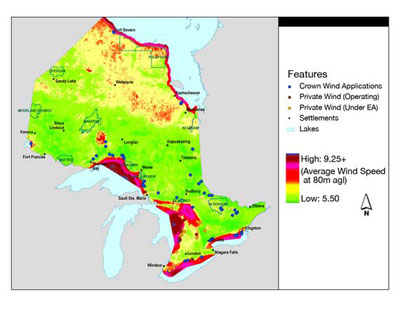
FIGURE 6: Wind power resources in Ontario (Ontario Ministry of Natural Resources, 2006a).
text version - figure 6
Figure 6: Map showing distribution of wind power resources in Ontario, including Crown Wind Applications, and Private Wind (operating and under EA). These are generally distributed along the northern shores of the Great Lakes and the eastern border of the province. The map also shows wind speeds, broken down into three main categories (high, average and low). High and average windspeeds are shown along the Great Lakes and Hudson’s Bay coasts.
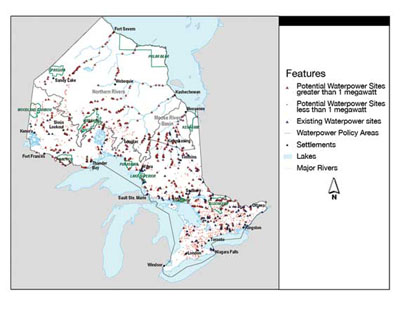
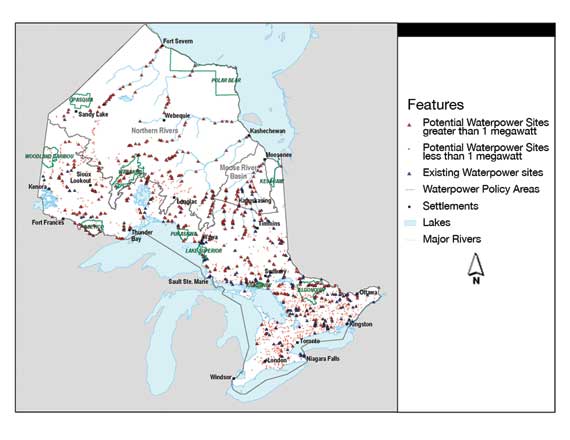
FIGURE 7: Water power resources in Ontario (Ontario Ministry of Natural Resources, 2006b).
text version - figure 7
Figure 7: A map of Ontario showing potential and existing water power resources in Ontario. The map shows that water power resources exist throughout most of the province, and there is great potential for more resources, with smaller operations (less than 1 megawatt) being possible in southern Ontario, and the potential for larger operations (more than 1 megawatt) over much of the rest of the province.
2.5 ATMOSPHERIC TRENDS AND PROJECTIONS
Ontario's climate and air quality vary widely from season to season and from one part of the province to another. In the south subregion and part of the central subregion, climate is highly modified by the influence of the Great Lakes, resulting in higher autumn and winter precipitation, protection from the worst of winter's cold and summer's heat, and very heavy snowfall in the regions to the lee of lakes Superior and Huron, and Georgian Bay. Spring and summer also include the tornado season in the south subregion, which has the highest frequency of tornadoes in Canada. Stagnant tropical air masses in the summer can bring poor air quality, heat waves and drought, although elevated levels of particulate matter can also occur during winter months. In autumn, remnants of hurricanes occasionally produce high winds and excessive rainfalls. The north subregion has cold winters and mild summers. Most precipitation falls in the form of summer showers and thunderstorms, although winter snowfall amounts can be significant. Low winter temperatures permit construction and operation of winter ice roads for community access and commercial mining and forestry operations.
Ontario experiences a variety of extreme weather events and associated natural disasters. In spring, rapid snowmelt or ice jamming can lead to flooding, especially in northern communities. Major storms hit most parts of Ontario at least once or twice per year, with high winds, rain, freezing rain or snow. In recent years, Ontario has experienced some exceptionally severe weather events, including the 1998 ice storm, which remains the costliest natural disaster in Canadian history. In that storm, eastern Ontario, southwestern Quebec, southern New Brunswick and Nova Scotia, and portions of the northeastern United States received 80 mm or more of freezing rain, double the amount received in any previous ice storm (Lecomte et al., 1998). In Canada, this event caused 28 deaths, cost more that $5.4 billion and left 250 000 people in Ontario without power, some for up to 24 days (Lecomte et al., 1998; Kerry et al., 1999).
Climate Trends
During the last half of the twentieth century (1948–2006), the period for which data are available for northern as well as southern Canada, national annual temperatures have increased by 1.3 °C (Environment Canada, 2006a; see Chapter 2). During the same time period, annual average temperatures across Ontario have increased between 0 and 1.4 °C, with larger increases observed in the spring. Examination of trends in warm days and warm nights between 1950 and 2003 shows that the largest increase in the number of warm days is found in the north subregion (Figure 8). During this same period, there has also been a significant decrease in the number of cold days in the central and western parts of the north subregion (Vincent and Mekis, 2005). The largest decrease in diurnal temperature range occurred in the central subregion (Vincent and Mekis, 2005).
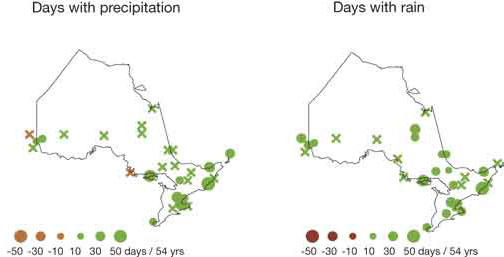
Annual precipitation in southern Canada has increased by about 5 to 35% since 1900 (Zhang et al., 2000), and the number of days with precipitation (rain and snow) has increased significantly in the south and central subregions. Furthermore, the number of days with rain only has increased in the south subregion and parts of the central and north subregions (Figure 9; Bruce et al., 2000; Vincent and Mekis, 2005). Precipitation in some parts of the province (e.g. Maitland River valley east of Lake Huron) has become more variable, with high-intensity storms becoming more common since the late 1950s (Mekis and Hogg, 1999). Snowfalls show a significant upward trend in the north subregion in the fall, but have declined in the central subregion in spring and winter. Snowfall trends in the south subregion are not statistically significant, although there is evidence of an increase in snow in the western part of the subregion and a decrease in the eastern part (Zhang et al., 2001).
A significant increase in lake-effect snow has been recorded since 1915 for areas of the United States in the lee of the Great Lakes (Burnett et al., 2003). Heavy lake-effect snow presents a hazard for communities and transportation networks, and its accumulation and subsequent melt play an important role in regional hydrology.
Between 1953 and 2001, days with freezing rain events occurred, on average, between 2 and almost 10 times per year, with Ottawa, North Bay and Sudbury having the highest annual averages and Thunder Bay, Kenora and Sioux Lookout the lowest. Risk of freezing rain has remained relatively stable during this period, with a statistically significant decreasing trend in Wiarton and London, and a slight (not statistically significant) increasing trend in much of the central subregion and Ottawa (Klaassen et al., 2003).
Climate Projections
The limited scale of Global Circulation Model (GCM) output precluded meaningful analysis at the scale of the subregions used in this chapter, so the province was divided into east and west sections for the purpose of this analysis. Projections of changes in temperature and precipitation from runs on seven GCMs, using seven different emission scenarios, are presented in Figure 10. These 49 scenarios provide a robust range of plausible climate futures, expressed in terms of change over the average values from 1961 to 1990 (see Chapter 2). All results (ranging from conservative to aggressive assumptions regarding future emission rates) indicate an increase in annual temperature, and the majority also project increases in annual amounts of precipitation within the next 20 to 50 years. The range of results increases over time, reflecting fundamental differences among emissions scenarios and among models.
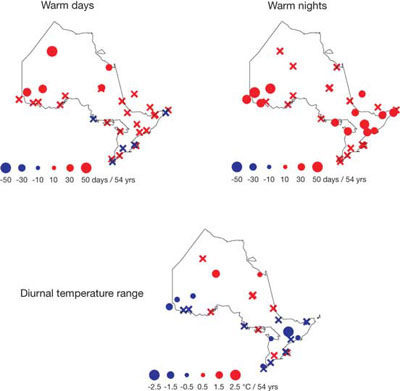
FIGURE 8: Trends for warm days, warm nights and diurnal temperature change, 1950-2003 (Vincent and Mekis, 2005). Blue and red dots indicate trends significant at the 5% level, and the size of the dots is proportional to the magnitude of the trend. Crosses denote non-significant trends.
text version - figure 8
Figure 8: Three maps of Ontario showing observed trends for
- warm days,
- warm nights and
- diurnal temperature change for the period 1950-2003
The graphs show that over much of Ontario there has been a trend of more warm days (especially in the northwestern portion of the province, where warm days have increased by 50 days/54 years) and more warm nights (especially in the northwestern and south-eastern portion of the province, where warm nights have increased by 50 days/54 years). Diurnal temperature range has decreased over much of Ontario, by up to 2.5 degrees C over 54 years.
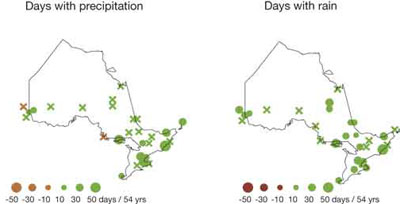
FIGURE 9: Trends in precipitation indices, 1950-2003 (Vincent and Mekis, 2005). Brown and green dots indicate trends significant at the 5% level, and the size of the dots is proportional to the magnitude of the trend. Crosses denote non-significant trends
text version - figure 9
Figure 9: Two maps of Ontario showing observed trends in two precipitation indices over the period 1950-2003:
- Days with precipitation, and
- Days with rain. The number of days with precipitation has increased over much of the province, by up to 50 days/54 years. The number of days with rain has also increased, by an average of about 30 days/54 years. For both, the majority of data is for the more southern regions of the province, with little data presented for northern Ontario.
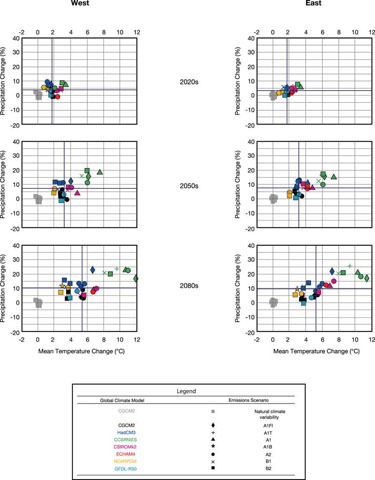
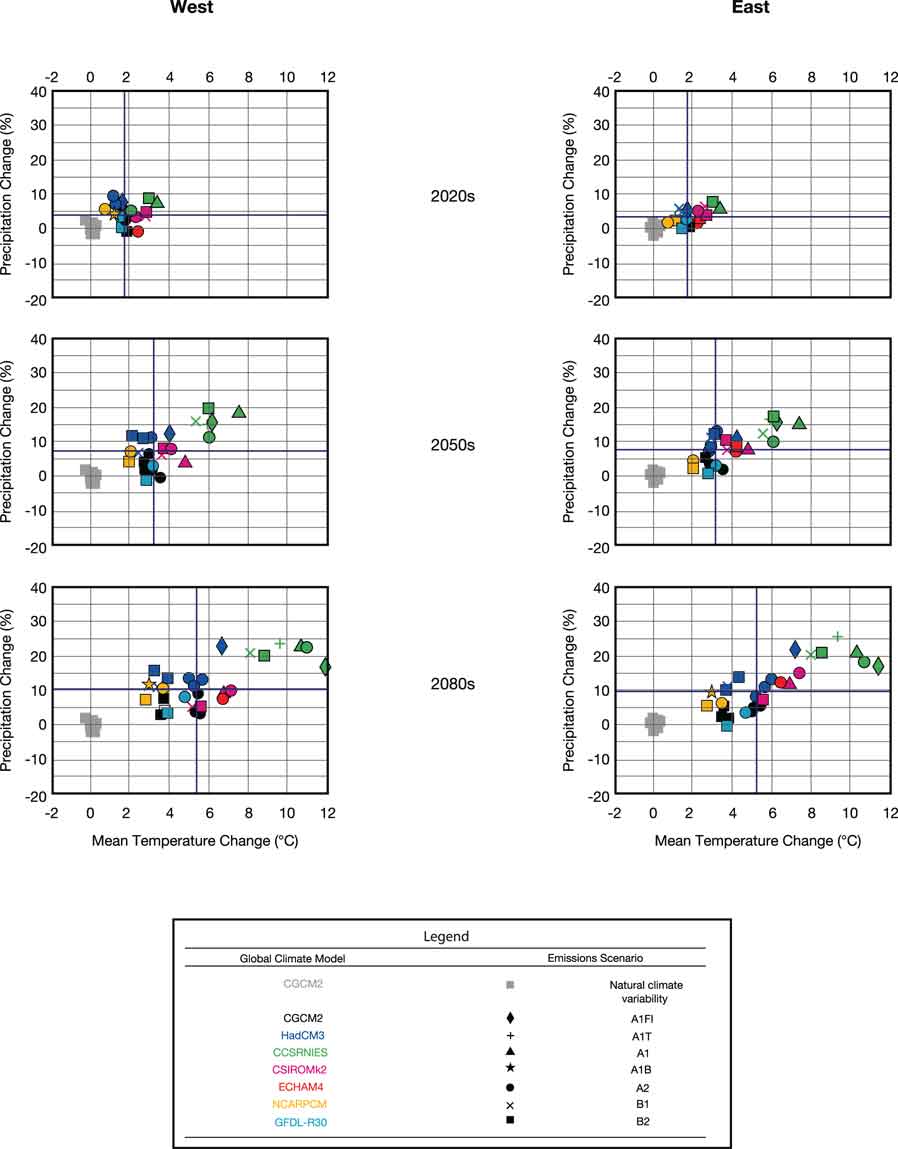
FIGURE 10: Scatterplots of projected change in annual mean temperature and precipitation. Blue lines represent median changes in mean temperature
text version - figure 10
Figure 10: Six scatterplots showing projected changes in annual mean temperature and precipitation for three time periods:
- 2020s
- 2050s and
- 2080s
for two regions of Ontario (west and east).
Results are based on the output of 7 different climate models, using 7 different emissions scenarios, as well as natural climate variability. The scatterplots illustrate the wide range of projections, as well as the decreasing agreement between models/scenarios farther into the future. Blue lines represent median changes in mean temperature and show that in all cases, temperature is projected to increase, by approximately 2 degrees Celsius by the 2020s, 3.5 degrees Celsius by the 2050s and 5 degrees Celsius by the 2080s.
Seasonal projections of temperature scenarios (Figure 11) indicate that maximum warming will occur in winter, in the north subregion. It is also expected that changes in extreme warm temperatures will be greater than changes in the annual mean (Kharin and Zwiers, 2005). The number of days exceeding 30 °C in the south subregion is projected to more than double by 2050 (Hengeveld and Whitewood, 2005). A separate study suggests that such severe heat days could triple in some cities by 2080 (Cheng et al., 2005).
There is greater variation in projections of precipitation than those of temperature, with the greatest precipitation increases projected for the north subregion (Figure 12). However, it must be noted that some of the projections indicate a slight decrease (<2.5%) in annual precipitation for most of the province in the next 50 years.
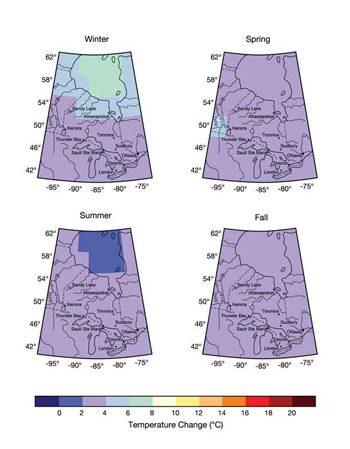
FIGURE 11: Projected seasonal change in temperature by the 2050s (relative to 1961-1990), based on the median of seven global climate models and using the emissions scenarios of the Special Report on Emissions Scenarios (SRES).
text version - figure 11
Figure 11: Four maps of Ontario showing projected temperature increases in the 1) winter, 2) spring, 3) summer and 4) fall by the 2050s, (relative to 1961-1990), based on the median of seven global climate models and using the emissions scenarios of the Special Report on Emissions Scenarios (SRES). Temperature in the winter is projected to increase between 4°C and 6°C in the upper area near Sandy Lake, and increase 2 -4°C in all other areas. Temperature in the spring is projected to increase approximately 2 -4°C over most of the province. In the summer, a 2 -4°C increase in temperature will occur in all areas but over Hudson Bay, where projected changes are 0-2°C. Temperature in the fall is projected to increase by 2 -4°C in all areas.
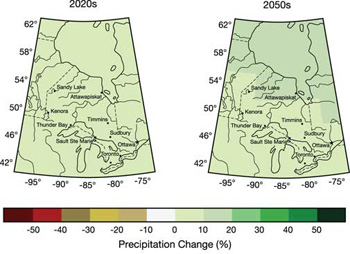
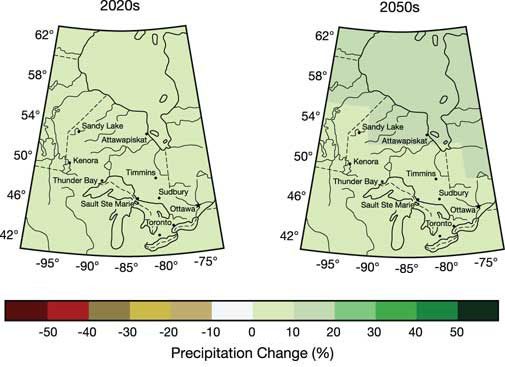
FIGURE 12: Projected annual change in precipitation (%) for the 2020s (left) and 2050s (right), relative to 1961-1990, based on the median of seven global climate models and using the emissions scenarios of the Special Report on Emissions Scenarios (SRES).and precipitation derived from suite of scenarios on plot. (see Appendix 1 of Chapter 2 for details).
text version - figure 12
Figure 12: two maps of Ontario showing projected annual change in precipitation for the 2020s and 2050s, relative to 1961-1990, based on the median of seven global climate models and using the emissions scenarios of the Special Report on Emissions Scenarios (SRES).In the 2020s, precipitation is projected to increase by 0-10% over the province. In the 2050s, precipitation is projected to increase by 0-10% near Sault-St. Marie, Timmins and Ottawa, while increasing by 10-20% north of Sandy Lake.

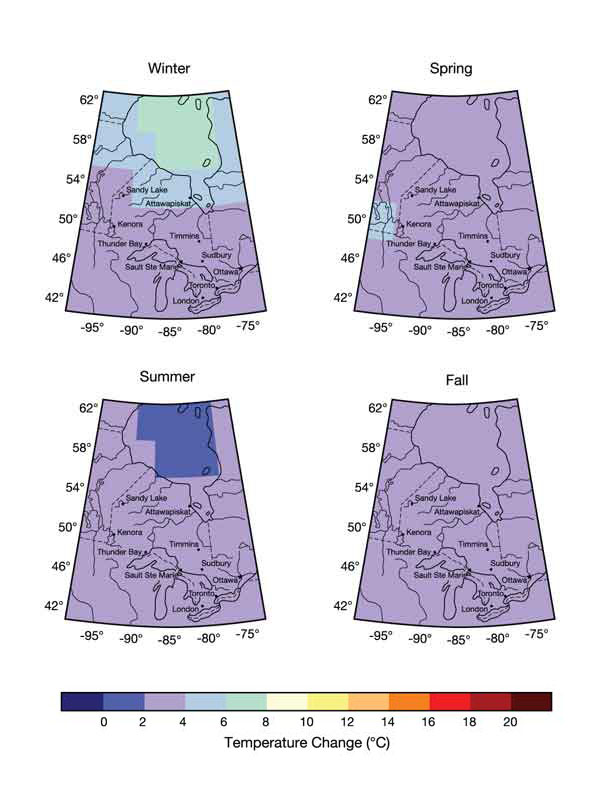
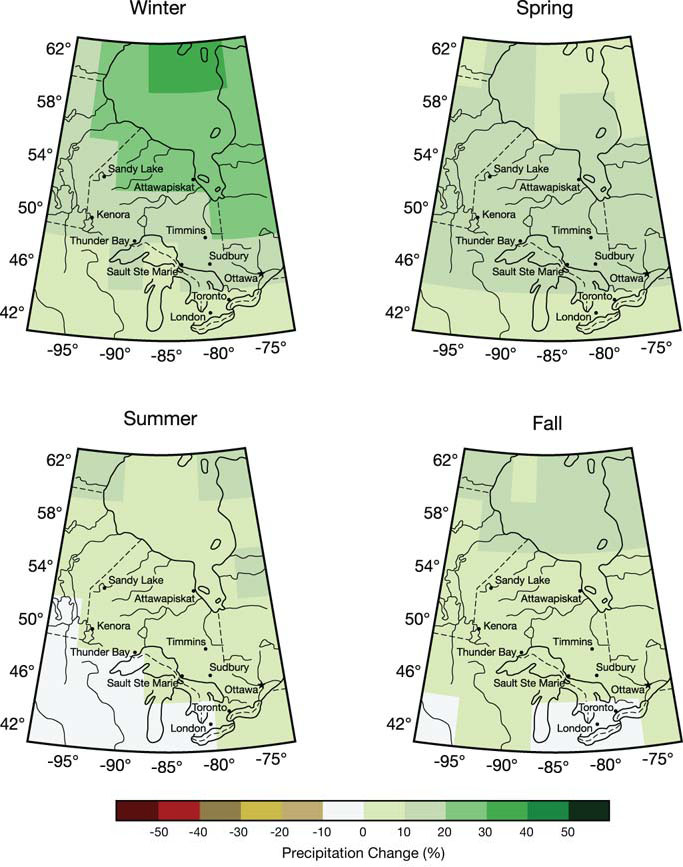
FIGURE 13: Seasonal change in precipitation (%) by the 2050s, relative to 1961-1990, based on the median of seven global climate models and using the emissions scenarios of the Special Report on Emissions Scenarios (SRES).
text version - figure 13
Figure 13: Four maps of Ontario showing seasonal change-
- winter
- spring
- summer and
- fall
in precipitation by the 2050s, relative to 1961-1990, based on the median of seven global climate models and using the emissions scenarios of the Special Report on Emissions Scenarios (SRES). Greatest increases in precipitation are projected for the northern region of the province in the winter. In the winter, an average increase of 30-50% north of Sandy Lake and an increase of 0-20% south of Sandy Lake are projected. In the spring, a 0-20% increase is projected, with a greater increase around Sandy Lake, Ottawa and Timmins, and a lesser increase near London and the northernmost area. In the summer, precipitation could decrease by up to 10% in the southwestern region, and increase in the rest of the province, with the greatest increase projected for the northern area. In the fall, an increase between -10% and 20% is projected with greatest increases in northern areas and decreases around Toronto.
Although annual precipitation totals are likely to increase, summer and fall decreases of up to 10% are projected for the south subregion by 2050. Net moisture availability will also be impacted by warmer temperatures and longer growing seasons, with resultant increases in evaporation and evapotranspiration rates. Winter projections show increases in precipitation, increasing from south to north and ranging from 10% to more than 40% (Figure 13).
Changes in the extreme daily precipitation amounts are expected to be greater than the changes projected in the annual mean amounts (Kharin and Zwiers, 2005), meaning that these types of events will become both more intense and more frequent (Hengeveld and Whitewood, 2005). It is likely that lake-effect snow will increase in the short to medium term as lake temperatures rise and winter air temperatures are still cool enough to produce snow. By the end of the twenty-first century, however, snowfall may decrease and possibly be replaced by heavy lake-effect rainfall events (Kunkel et al., 2002; Burnett et al., 2003).
Air Pollution
Air pollution has a significant impact on human and ecosystem health, causing illnesses and even death among vulnerable populations. It also reduces the yields of many agricultural crops. Climate change impacts ambient air pollution levels through changes in meteorological conditions and changes in atmospheric chemistry. There are also potential synergistic health impacts between warmer temperatures and air pollution, with emissions from fossil fuel –based electricity generators possibly increasing to meet the increased peak demands. In Ontario, air-quality problems related to ozone and fine particulate matter are extensive, particularly throughout the south subregion. On an episodic basis, particulate matter and ozone are issues in other parts of the province as well.
Concentrations of particulate matter and precursors to ozone have declined during the past 30 years, although this decline has generally levelled off or stagnated since the mid-1980s (Brown and Palacios, 2005; International Joint Commission, 2006). However, some cities, such as Toronto, have experienced increased levels of nitrogen dioxide and fine particulate matter, in part due to increases in emissions from coal-fired electricity generating plants and from the transportation sector (Campbell et al., 2004). Despite decreases in ozone precursor pollutants, Ontario has exhibited statistically significant increases in the seasonal means for summer and winter ozone from 1980 to 2005 (Ontario Ministry of the Environment, 2006a). In Canada, ozone concentrations are highest and are rising most rapidly in the south subregion of Ontario (Environment Canada et al., 2005; Ontario Ministry of the Environment, 2006a). In recent years, both large and small urban and rural monitoring sites in Ontario have exceeded the Canada-wide standard for ozone, with the exception of Thunder Bay. A significant part of the problem is transborder pollution, which can be equal to, if not greater than, that from local sources during smog episodes (Yap et al., 2005). Ontario is also a significant source of air pollution for downwind regions in Quebec, Atlantic Canada and parts of the American northeast.
Page details
- Date modified: