
Forest Change: more information
- What is uncertainty?
- What are the main sources of uncertainty?
- What are the limitations of the systems modelled here?
- Can these sources of uncertainty be reduced?
- How can these sources of uncertainty be minimized?
- What is certain?
- What is the relationship between uncertainty and risk?
- Is it okay to wait until uncertainty decreases before taking action?
- How can forest management decisions be made in an uncertain future?
- What is the forest pathogen database?
- Why is forest pathology important?
- Why map pathogen occurrence?
- Will the occurrence of forest pathogens change with climate change?
- Can future pathogen occurrence be projected?
- How can the forest pathogen database be used?
- What forest diseases are included in the forest pathogen database?
- How do I access the forest pathogen database?
- How do I navigate the site to find the different map products?
Climate Change Uncertainty
-
Uncertainty is having limited knowledge about an existing state or a future outcome. In the context of forest management, there is uncertainty about how much the climate will change and when and where the impacts will be felt in forest ecosystems and the forest sector. Although it is impossible to know the future, research can help increase our understanding by exploring plausible future states. People make decisions every day with incomplete information. The Forest Change indicators and adaptation tools have been developed to provide information to enable better decision-making for forest management in an uncertain future.
“Uncertainty is what keeps me up at night.” – Forest sector executive
“Uncertainty motivates me to do more research!” – Scientist -
What are the main sources of uncertainty?
Key sources of uncertainty in climate change research include:
- Natural variability – The Earth’s climate is a complex and dynamic system that varies naturally over months, years and decades. Climate change is causing a shift in the average climate variables, and greater extremes are being observed, outside the historical range of natural variability.
- Greenhouse gas emissions (forcing) scenarios – The Earth’s climate is affected by the concentration of greenhouse gases. The Representative Concentration Pathways (RCP) scenarios represent the combined radiative forcing that contributes to global warming. The lowest forcing scenario, RCP 2.6, means that the total forcing will be 2.6 watts per square metre added to the average solar radiation the earth receives each day. One of the greatest uncertainties in future climate projections involves human behaviour and how it will affect future levels of greenhouse gases. This is why several future scenarios must be considered.
- Data – Canada is a vast country with many remote areas, so it is challenging to maintain data collection sites and gather enough samples to define reality completely.
- Models – Models can help researchers understand climate, forest and human systems. However, since these systems are complex, many assumptions and approximations are required, leading to uncertainty in model results.
-
What are the limitations of the systems modelled here?
Each type of model has limitations, because it is trying to represent a complex system. But projections can still help researchers develop plausible future scenarios:
- Climate system – Climate models use simplified mechanistic representations of the complex behaviour and interactions of the climate system, and therefore provide an imperfect representation of reality.
- Forest system – Biophysical impact models are used to assess how the forest and forest ecosystems will adapt to new conditions. In addition to the uncertainty of climate projections, there is uncertainty as to how the ecosystems will react to these changes.
- Human system – Uncertainty increases from greenhouse gas emissions to climate projections to biophysical impacts to socio-economic implications. While researchers continue to learn more about climate change and its potential implications, it is difficult to model how humans will adapt.
-
Can these sources of uncertainty be reduced?
Sources of uncertainty can be reducible or irreducible. Uncertainty related to natural variability is irreducible because of the chaotic nature of the global atmosphere. This is why weather forecasts are never completely correct, and their accuracy falls off rapidly over a period of two or three days. In theory, the uncertainty around greenhouse gas emission scenarios can be reduced, but this requires humans to take action on a global scale. Continued research can help minimize reducible sources of uncertainty, such as data and modelling; however, research takes time and does not eliminate uncertainty. The impact of uncertainty can be minimized through different management approaches, such as exploring a range of plausible future scenarios.
-
How can these sources of uncertainty be minimized?
Understanding the causes of uncertainty can help guide actions to reduce its impact. Depending on the source, there are different practices that help minimize uncertainty:
- Natural variability – Since natural variability will always exist, it is common practice to average projections over longer time frames and larger geographic regions, so that general trends become more apparent. Annual average climate estimates will show greater variability than 10- or 30-year averages. In contrast to weather forecasting, climate forecasting looks at long-term (typically 30-year) averages and tracks how these average climate variables change over time.
- Greenhouse gas emissions (forcing) scenarios – To account for uncertainty in human behaviour, results on the Forest Change website are presented using three Intergovernmental Panel on Climate Change (IPCC) forcing scenarios: RCP 2.6 represents rapid emissions reductions, RCP 4.5 moderate emissions reductions, and RCP 8.5 continued emissions increases. Since the likelihood of each scenario is unknown, it is important to consider the range of projections resulting from all three scenarios. In short, RCP 2.6 and RCP 8.5 scenarios can be envisioned as lower and upper uncertainty bounds for plausible climate scenarios.
- Data – To minimize uncertainty in data, quality control and statistical analyses are applied to identify and account for outliers. Careful use of interpolation techniques helps provide information for areas between data points. Over time, the use of new technologies may help increase data availability and quality.
- Models – In order to decrease model bias, it is best practice to use more than one model to get a range of plausible results. The spread among model results allows some quantification of uncertainty. If only one model is used, researchers can conduct sensitivity analyses to see how much model results change with different inputs and assumptions.
-
The climate is changing; there have been and will continue to be impacts on forests. The historical data presented in the Forest Change indicators show trends. Combined with the biophysical impact model projections, there is reasonable certainty about the types of events to expect in the future. For example, insect outbreaks, such as mountain pine beetle, and increases in wildland fires have already been observed and have been related to generally warmer (and drier) conditions. The maps in the Forest Change indicators can be used to determine the general types of impacts to expect in specific areas. It isn’t possible to be certain about precisely where and when these impacts will occur or their magnitude, but it is certain that forests are becoming more exposed, and potentially vulnerable, to a range of impacts. The vulnerability of forest ecosystems and the forest sector to these impacts depends on human understanding of and capacities to manage these risks and uncertainties.
-
What is the relationship between uncertainty and risk?
From a decision-making standpoint, it may be practical to view uncertainty in terms of risk. Risk is described as the probability of the event times the severity of the impact of that event. Even if there is uncertainty about the likelihood of an event, the added dimension of its severity if it does occur can help prioritize actions and resources. For example, it is never certain that a large wildland fire will occur at a specific place during a given period, but in areas prone to increased fire probability, the negative social and economic consequences could justify substantial investment in fire-proofing, fire-prevention and fire suppression resources. In other regions, where the values at risk do not include safety of humans and infrastructure, a different management approach may be applied.
-
Is it okay to wait until uncertainty decreases before taking action?
Some people feel that uncertainty is a reason for inaction. However, there will always be a degree of uncertainty about future events. Even with additional research, many uncertainties will remain. There is also a cost associated with inaction. For the forest sector, some decisions and actions may be appropriate now in anticipation of future climate change, but care is needed to ensure that the decision is appropriate for the wide range of climates that are still possible in future decades. One way to take action even with uncertainty is to explore “no regrets” adaption options, or actions that are beneficial under a wide range of plausible future scenarios.
“Uncertainty is the most significant challenge, but it is not a reason to avoid action.”
(Lemprière et al., 2008, p. 36) -
How can forest management decisions be made in an uncertain future?
Even with uncertainty, there are many ways to inform decision-making and guide climate change adaptation. For example:
- Draw on expert opinion and the experiences of others
- Experts who have developed models have a general sense of how much projections fluctuate based on different inputs and assumptions. The indicators and adaptation tools presented on the Forest Change website have links to key contacts, who may offer opinions on applying model results.
- Groups involved in adaptation measures, such as the Forestry Adaptation Community of Practice, offer online forums so that members can share their experiences in adaptation planning and implementation.
- Conduct a vulnerability assessment and develop local scenarios
- Projections of climate change and forest impacts, found on the Forest Change website, can be used to determine potential impacts in a specific region. This can become part of a vulnerability assessment. The projections can also be used to help create local scenarios.
- The Canadian Council of Forest Ministers (CCFM) has developed a guidebook to walk users through the steps of a vulnerability assessment. Data and projections from the Forest Change website can be used to fill in the guidebook worksheets.
- Explore adaptation options, particularly “no regrets” options that will bring net benefits regardless of what may happen in the future. There are several sources for adaptation options relevant to the forest industry, to get you started:
- The Forest Change website contains a database of adaptation options.
- The CCFM guidebook lists adaptation options in Appendix 5.
Sources
Charron, I. 2016. A guidebook on climate scenarios: Using climate information to guide adaptation research and decisions [7.9 Mb PDF]. Ouranos (Consortium on Regional Climatology and Adaptation to Climate Change).
Hawkins, E., and Sutton, R. 2009. The potential to narrow uncertainty in regional climate predictions. Bulletin of the American Meteorological Society 90, 1095–1107.
Lemprière T.C., Bernier, P.Y., et al. 2008. The importance of forest sector adaptation to climate change (Information Report NOR-X-416E). Edmonton, AB: Natural Resources Canada, Canadian Forest Service.
Price, D.T., and Isaac, K.J. 2015. Adapting sustainable forest management to climate change: A comprehensive report on scenarios for vulnerability assessment (Information Report NOR-X-422E).Edmonton, AB: Natural Resources Canada, Canadian Forest Service.
- Draw on expert opinion and the experiences of others
Climate Modelling
-
Why is climate modelling important?
Climate modelling helps increase understanding of climate change and supports planning and decision-making to adapt to potential impacts. Since data and observations about the future are not available, climate modelling provides a sense of the expected range of future climate.
-
Which climate model should I use?
Numerous climate models have been developed by research groups around the world. There is no particular model that is known to be more accurate than the others, and there is uncertainty associated with all climate models. One way to deal with this uncertainty is to explore projections from a variety of models and then use the range of results to support planning and decision-making. This means finding adaptation options that would be effective over the range of plausible futures derived from a suite of models, rather than planning for the “best-case scenario” from one model.
-
What sources of uncertainty are associated with climate modelling?
In addition to the uncertainty associated with each model, there is uncertainty due to natural climate variability, which is important for short-term planning, and uncertainty related to greenhouse gas emissions scenarios, which have a greater influence in long-term planning. Before using climate data, it is important to understand the limitations and uncertainty associated with the data. Further information on uncertainty can be found in the Climate Change Uncertainty FAQ.
-
What climate modelling and data are available here?
- Historical:
- Long-term (30-year) mean climate grids for North America
- Monthly climate grids for North America for each year starting from 1901. View average monthly means of maximum temperature, minimum temperature or precipitation for each year, as well as other climatic variables
- Point estimates:
- Daily – Generate daily climate estimates (maximum temperature, minimum temperature or precipitation) for locations anywhere in Canada or the United States from 1951 to 2013
- Monthly – For a given location, generate monthly averages, long-term averages or model projections
- Climate change scenarios: View maps of model projections for short-, medium- and long-term 30-year averages (2011–2040, 2041–2070, 2071–2100) on primary variables such as minimum temperature, maximum temperature and precipitation, as well as other bioclimatic variables such as start and end of growing season
- Downscaled climate projections: Download data (maximum temperature, minimum temperature, precipitation, solar radiation, surface wind speed and water vapour) from four different climate models in ASCII or NetCDF format for further research, analysis and modelling
Models Available- Canadian Earth System Model, second-generation (CanESM2)
- Model for Interdisciplinary Research on Climate Earth System Model, chemistry coupled version (MIROC-ESM-CHEM)
- Hadley Centre Global Environment Model, version 2, earth systems model (HadGEM2-ES)
- Community Earth System Model, version 1; Community Atmospheric Model, version 5 (CESM1-CAM5)
- Historical:
Adaptation Options
-
Although forests have been naturally adapting to a changing climate, the rate of change is increasing and forests may not be able to keep up and continue to provide society with desired goods and services, such as timber and biodiversity.
For example, as discussed in detail in Climate change vulnerability and adaptation in the managed Canadian boreal forest, effects of climate change on the boreal forest include:
- an increase in the frequency of disturbances
- changes in forest productivity, which vary from one region to the next
- variability of the timber supply
- a decrease in the socio-economic resilience of forest communities
- a resurgence of issues related to the health and safety of these communities
-
How does adaptation fit within forest management planning?
Adaptation can be integrated as part of the regular forest management planning process. Research on climate change impacts can help guide future forest management planning. Adaptation actions can be reactive, taking place after an impact has occurred, or proactive, based on projected impacts. Currently, most adaptation actions in the forest sector are reactive. But proactive adaptation can be advantageous in helping to reduce risks. Since trees mature over decades, it is important to consider adaptation options in light of both current and projected climate conditions. In order to reduce future risks, it is important that decisions be made now.
-
Adaptation options include a range of actions that can be implemented to reduce vulnerabilities or explore opportunities related to climate change. Adaptation options can be implemented within the forest (biophysical) or the forest sector (human). Forest sector adaptations could include making changes to forest policies, practices or operations.
-
Is there a process for exploring adaptation options?
Conducting a vulnerability assessment, either formally or informally, can help identify vulnerabilities and opportunities. The database of adaptation options can then be used to view a range of possible actions organized by general or detailed vulnerability.
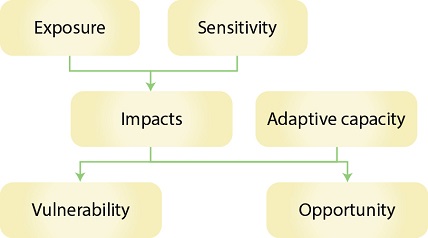
Figure 1. The vulnerability assessment diagram (from Gauthier et al. © Canadian Science Publishing or its licensors)
For example, in the boreal forest, significant changes in temperature and precipitation are forecast (Exposure); this can translate into a change in fire regime affecting the forest (Sensitivity). An increase in fire activity can affect forest composition or timber supply availability, or increase smoke emissions around communities (Impacts). As boreal forests are disturbance-dominated systems, species have the ability to adjust to these changes in fire activity; forest management can also adjust by increasing salvage logging (Adaptive capacity). Locally, large-scale disturbances may create a shortage in timber supply (Vulnerability). At the same time, an increase in demand for bioenergy can provide new markets for residual biomass (Opportunity).
-
How is the database of adaptation options organized?
The database is organized into the biophysical and human subsystems, three target areas of adaptation (reducing stressors, reducing sensitivity, and enhancing adaptive capacity), and both general and detailed vulnerabilities. The list can be filtered by typing key words from one of those categories. Alternatively, it can be filtered with desired search words, such as fire or drought. The arrows at the top of each column can be used to sort results alphabetically. The references in the final column give links to the articles that originally cited the given adaptation options. As well, the entire list of references and related adaptation options can be viewed by clicking “View adaptation options by reference.”
Mapping the occurrence of Canada’s forest pathogens
-
What is the forest pathogen database?
For over 60 years, the Canadian Forest Service collected data on the observed location of forest fungi and mistletoes through its Forest Insect and Disease Survey (FIDS); since about 1995, these data have been collected by provincial and territorial governments. The data come from both ground observations and aerial overviews. To preserve this wealth of information and make it accessible, it has been formatted into an electronic database. Users can access data and maps for almost 3000 forest fungi and mistletoes (plus about 8000 insects) at CFS-NRCan’s Pest Strategy Information System (PSIS) web portal.
-
Why is forest pathology important?
Forest pathology includes the study of biotic diseases, such as those caused by fungi, bacteria, viruses, nematodes and mistletoes. Forest pathologists also investigate abiotic stressors, such as drought, frost, pollutants, temperature extremes and high winds. Although forest diseases and their impacts are not as visible or immediate as those caused by some other disturbances, such as insects and fire, economic losses from tree diseases are estimated to be higher than those from insects and fire combined. Many fungal pathogens cause reduced growth of trees. Long-term studies have shown yield reductions in infected trees. In addition, the presence of forest pathogens often predisposes trees to damage by additional disturbance agents such as insects. The economic impact of this loss of productivity may not be felt for decades.
-
The mapping of pathogens provides an important part of the forest inventory. Accurate information on the geographical range of forest pathogens is needed to assess risk, and informs a range of forest management decisions. For example, when considering adaptation options such as assisted migration, the location of pathogens can guide decisions on species and planting locations. The location of forest diseases can also guide harvesting and replanting decisions, such as removing infected stumps to minimize spread of root disease fungi and planting resistant host species. In addition, a good base of information on current pathogen occurrences is essential for tracking the impacts of climate change and the spread of invasive pathogens.
-
Will the occurrence of forest pathogens change with climate change?
Most plant diseases are strongly influenced by environmental conditions, so climate change will very likely affect pathogens, hosts and their interactions. As the climate changes, many abiotic stressors (drought, frost, temperature extremes and high winds) are also expected to increase. The interactions of biotic diseases and these stressors may lead to increased disease outbreaks and forest declines. In addition, the activity of some forest disease agents, such as dwarf mistletoes, is currently limited by low winter temperatures. Since seasonal increases in temperature are expected to be greatest during winter, both overwintering survival of pathogens and disease severity are likely to increase. Increases in temperature may allow some diseases to expand their latitudinal and elevational ranges and may facilitate invasion by new non-native pathogens.
-
Can future pathogen occurrence be projected?
Projections are relatively feasible and credible for pathogens whose range or activities are primarily limited by temperature. It is more difficult to predict how climate change may affect pathogens dependent on interactions with other organisms, such as insect vectors. Researchers modelling forest insects and diseases have used historical and recent field observations and analyzed these distributions relative to climate to identify areas that would be climatically suitable for a species. The resulting models show a “climate envelope” where a species may be found, but do not indicate population levels; the models can be viewed on the Bioclimatic Mapping of Forest Insects and Diseases web application. In some cases, the location of potential hosts is also mapped. Information on climate envelopes for specific pathogens could assist in the planning of resources for early detection and monitoring.
-
How can the forest pathogen database be used?
Users can search the database for species of interest and access results in various ways, including:
- viewing data in a table format (separated into point and polygon data)
- exploring results with an interactive map viewer (see example in Figure 1)
- downloading data for analysis in a GIS
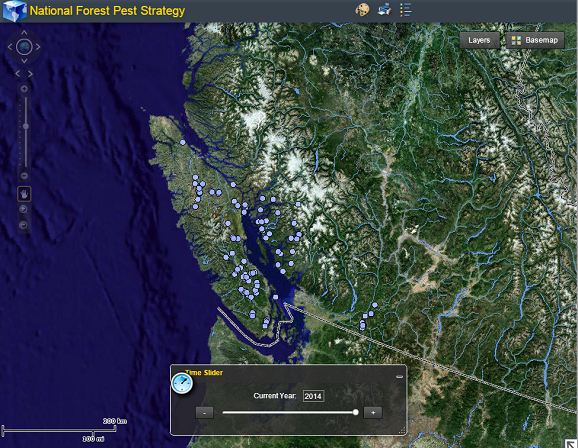
Figure 1: Screen capture of dynamic map for Armillaria ostoyae occurrence for 2014 (zoomed in to the southwest corner of British Columbia). The time slider can be adjusted to view results for different years.
-
What forest diseases are included in the forest pathogen database?
The database contains distribution maps for almost 3000 forest fungi and mistletoes, many of which cause forest diseases. Forest diseases can be classified into the following types: root diseases, stem decays, cankers, wilts, rusts, foliage diseases, shoot blights, and dwarf and true mistletoes. The following forest diseases and their causal species are proposed as Canada’s current Priority Pathogens:
- Native species:
- Armillaria root rot (Armillaria ostoyae)
- Ceratocystis canker (Ceratocystis fimbriata)
- Sphaerulina leaf spot and canker (Davidiella populorum anam. : Sphaerulina musiva)
- Dothistroma or red banded needle blight (Mycosphaerella pini anam.: Dothistroma septosporum)
- Invasive species established in Canada:
- Annosus root rot (Heterobasidion irregulare and H. occidentale)
- European larch canker (Lachnellula willkommii)
- Butternut canker (Ophiognomonia clavigignenti-juglandacearum)
- White pine blister rust (Cronartium ribicola)
- Invasive species to monitor:
- Bleeding canker of red oaks (Phytophthora ramorum)
- Phytophthora disease of alder (Phytophthora alni)
- Bleeding canker (Phytophthora kernoviae)
- Blue stain disease (Ceratocystis polonica complex (C. laricicola incl.))
- Oak wilt (Ceratocystis fagacearum)
- Ash dieback (Chalara fraxinea)
- Thousand cankers disease (Geosmithia morbida)
- Spruce rust (Chrysomyxa abietis)
- Native species:
-
How do I access the forest pathogen database?
You can access the forest pathogen database through the Pest Strategy Information System (PSIS) portal by going to the National Forest Information System (NFIS) Access page and clicking on “Account Registration.” Then send an email to ksg@nrcan-rncan.gc.ca to request access, stating your email address as your username. When your account has been registered, return to the Access page, select your jurisdiction and enter your username and password. Once signed in, you will be redirected to the PSIS Portal. Note: Even if you have used other NFIS resources, your account has to be registered via the above email in order to be redirected to the PSIS Portal.
-
How do I navigate the site to find the different map products?
Using either a standard search or an advanced search (which allows filtering by province, organization, year, latitude and longitude), type the name of species of interest. The results screen will list point data and polygon data, which you can view in a dynamic map or download by clicking the buttons at the bottom of the screen. The dynamic map viewer allows you to adjust the time slider to see various years and zoom in on a section by pressing Shift and highlighting the desired area. To view multiple years at the same time, you can download the desired data for analysis in a GIS.
Canada-Wide Maps of Forest Properties
-
What is the National Forest Inventory (NFI)?
Reliable, current and consistent data are needed for reporting on the state of Canada’s forests and for tracking forest change and reporting. Authoritative information on forest change is required to support the development of policy to address both immediate needs and new and emerging issues, such as climate change impacts and possible adaptive strategies.
Canada’s National Forest Inventory (NFI) monitors a network of sampling areas covering 1 percent of Canada’s land mass on an ongoing basis to provide consistent information on the state and sustainable development of Canada’s forests. NFI geospatial data has been used to produce a suite of continuous maps of forest properties.
-
What is the kNN mapping method?
The Canada-wide maps of forest properties were generated using the Nearest Neighbour (kNN) mapping method, which uses known values of forest properties from a few locations to estimate the value of those properties at a much larger number of other locations. In this case, estimates were provided for pixels of 250x250m in size covering Canada’s forests. This cost-effective method has been widely used by other countries to generate forest maps, and its application to the NFI data enables the production of continuous maps of forest properties across Canada.
The maps show statistically interpolated data, not real measurements. The soil maps (kNN-Soils) are based on soil measurements made in the NFI field plots and are documented in Digital mapping of soil properties in Canadian managed forests at 250 m of resolution using the k-nearest neighbor method. All other maps are part of the forest properties dataset created from the NFI photoplot data. Documented limitations of these maps are as follows:
- In general, large values will be underestimated and small ones overestimated.
- The accuracy of estimates is lower in mountainous regions and areas with very few trees.
- The pixel-level values are to be used with caution, but estimates improve when averaged over areas of a square kilometre or greater.
More details can be found in Mapping attributes of Canada’s forests at moderate resolution through kNN and MODIS imagery.
-
The resolution and accuracy of these map products are best suited to strategic-level forest reporting and informing policy and decision-making at regional to national levels. Since these maps also offer a coherent set of quantitative values for a large suite of forest attributes, they can be used as baseline information for modelling and in calculations such as merchantable forest volume or percentage of tree species. It is also possible to overlay these maps with other maps produced on the same pixel grid to assess disturbance impacts, such as from fire and harvesting.
-
What kNN mapping tools are available?
There are several mapping tools that use kNN data. The Maps Tool provides access to different thematic layers that illustrate the distribution of forest data across the country. The Biomass Calculator Tool estimates the biomass available, and the Statistical Reports provides access to standard and custom reports.
No software installation is required. All maps are interactive, allowing users to zoom in, zoom out and pan around the map. The controls for these actions are located on the left side of the screen.
-
How can the maps and data be accessed?
The information is available in two formats:
- The web viewer on the NFI website allows quick visualization of key data described above.
- Raw data files are available for download under “Grouped kNN Map Layers” and allow additional manipulations using desktop software such as ArcGIS. Supplementary material can be found in the “Read Me” file.
Page details
- Date modified: