
Ocean Colour & Phytoplankton Concentration
Background
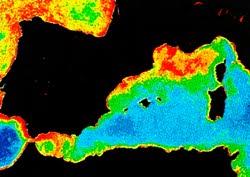
Ocean colour analysis refers to a method of indicating the "health" of the ocean, by measuring oceanic biological activity by optical means . Phytoplankton, are significant building blocks in the world's food chain and grow with the assistance of sunlight and the pigment chlorophyll. Chlorophyll, which absorbs red light (resulting in the ocean's blue-green colour) is considered a good indicator of the health of the ocean and its level of productivity. The ability to map the spatial and temporal patterns of ocean colour over regional and global scales has provided important insights into the fundamental properties and processes in the marine biosphere.
Mapping and understanding changes in ocean colour can assist in the management of fish stocks and other aquatic life, help define harvest quotas, monitor the water quality and allow for the identification of human and natural water pollution such as oil or algal blooms, which are dangerous to fish farms and other shell fish industries.
In general, ocean productivity appears highest in coastal areas due to their proximity to nutrient upwelling and circulation conditions that favour nutrient accummulation.
Why remote sensing?
Remotely sensed data can provide the necessary spatial perspective to collect information about the ocean surface on a regional scale. Optical data can detect such targets as suspended sediments, dissolved organic matter, and discern between algal blooms and oilslicks. SAR data can provide additional information on current, wave and mesoscale features so as to observe trends over time when optical data are not available due to periods of cloud cover. Many commercial fishing and aquaculture operators use this information to predict catch sizes and locate potential feeding areas.
Remote sensing provides a near-surface view of the ocean, but is limited in the amount of information it can derive from the water column. However, many applications of ocean colour are in their infancy and with the recent and upcoming missions of advanced sensors, the development and scope of applications will improve substantially.
Data requirements
Multispectral data are required for ocean colour measurements, and wide spatial coverage provides the best synoptic view of distribution and spatial variability of phytoplankton, water temperature and suspended matter concentration. Hyperspectral data, (collected in many and narrow ranges of the visible and infrared wavelengths), allows for greater precision in characterizing target spectral signatures. Monthly and seasonal imaging provides necessary data for modelling. For fish harvesting activities and for fish farm operators, information is required on a daily or weekly basis.
We are entering a new era of ocean colour data. The Coastal Zone Colour Scanner (CZCS) on-board the US Nimbus 7 satellite collected colour data from 1978 until 1986. In 1996 after a decade of limited data availability, the Germans launched the Modular Opto-electronic Sensor (MOS) and the Japanese followed with the Ocean Colour Thermal Sensor (OCTS). New sensors include SeaWiFs, launched in 1997 (NASA), MERIS (ESA) scheduled for launch in 1999, MODIS (NASA) in 2000 , GLI (Japan) in 1999, and OCI (Taiwan) in 1998. These advanced sensors will collect data on primary productivity, chlorophyll variablity and sea surface temperature using advanced algorithms. Their spectral channels are designed to optimize target reflectance and support quantitative measurements of specific biophysical properties. Most offer regional perspectives with relatively coarse (500-1200m) resolution and wide fields of view.
Case study (example)
El Nino and the Plankton Disappearance
Understanding the dynamics of ocean circulation can play a key role in predicting global weather patterns, which can directly impact agriculture and fishing industries around the world. Detecting the arrival of the El Nino Current off the coast of Peru is an example of how remote sensing can be used to improve our understanding of, and build prediction models for global climate patterns.
El Nino is a warm water current that appears off the coast of South America approximately every seven years. Nutrients in the ocean are associated with cold water upwelling, so the arrival of a warm water current such as El Nino, which displaces the cold current further offshore, causes changes in the migration of the fish population. In 1988, El Nino caused a loss in anchovy stocks near Peru, then moved north, altering the regional climatic patterns and creating an unstable weather system. The resulting storms forced the jet stream further north, which in turn blocked the southward flow of continental precipitation fromCanada over the central United States. Central and eastern American States suffered drought, reducing crop production, increasing crop prices, and raising commodity prices on the international markets.
Page details
- Date modified: