
Coastal zone applications
Shoreline detection
The coastal zone is a physically dynamic and ecologically sensitive environment which is subject to a variety of anthropogenic pressures (urban growth, industrial development, tourism) and natural (climatic induced) events resulting in significant coastal erosion. It is often densely populated and is a region of commercial, industrial, and recreational activity. It is an important environment to be monitored and managed effectively for sustainable use. Coastal applications that may benefit from the use of polarimetric SAR data include shoreline mapping, (in support of coastal change mapping) and substrate mapping (environmental sensitivity mapping/habitat mapping). The following sections provide examples of how multi-polarization or polarimetric data might help with these applications.
- Shoreline Detection
- Substrate Mapping
9.6.1 Shoreline Detection
The extraction of shoreline information from SAR imagery is possible due to the large contrast between backscatter from the water and from the land: If the water is relatively calm, it acts as a specular reflector (low backscatter) and this contrasts well with land that typically has higher backscatter. The delineation of shorelines can become more difficult due to wind induced surface roughness on the water which reduces the contrast between the water and land at the interface between the two. At moderate to high wind conditions and at shallow incidence angles, the microwaves interact primarily with the surface capillary waves resulting in increased backscatter as the surface roughness increases. This is particularly true for imagery in the VV polarization where poor contrast occurs between wind roughened water and land. Imagery in the HH and HV polarizations shows less sensitivity to wind induced surface roughness. Figure 9.44 (imagery in VV) shows high backscatter due to wind induced sea surface roughness and a relatively low water-land contrast. In the HH image, the backscatter from the sea surface is lower than that in the VV image although the surf results in a zone of higher backscatter along the shoreline. The image in the HV polarization shows the best contrast between land and water. Polarimetric data can be used to produce imagery with maximal contrast [ ] between selected features. This is seen in the sharp boundary between land and water in Figure 9.44d.
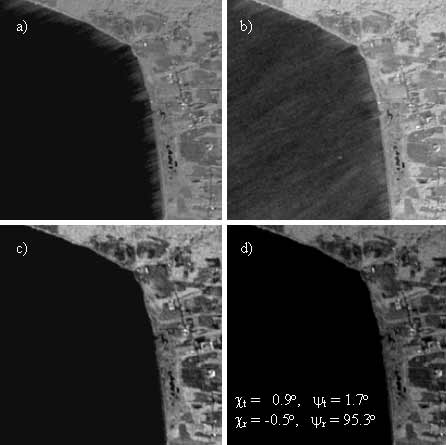
Figure 9-44. Water and land contrast as a function of polarization a) HH, b) VV, c) HV, d) maximum contrast image (Courtesy of CCRS).
Page details
- Date modified: