
Energy Benchmarking Data Snapshots For All Building Types

On this page
- All building types
- Population overview
- Fuel and population breakdown
- Benchmarking Growth
- Certification Trends
- Energy and area distribution
- Definitions and data information
All building types
ENERGY STAR® Portfolio Manager® is a tool used to track the energy use of 26,000 buildings in Canada. Energy benchmarking can help identify opportunities to save on energy costs and reduce environmental impact. This document provides a snapshot of the Canadian data for all building types entered into Portfolio Manager as of December 2020.
Population overview
Quick facts
- 26,000 buildings
- 318.5 million m2 floor area
- 0.9 GJ/m2 median site energy use intensity (EUI)
- 1.4 GJ/m2 median source EUI
- 214 ENERGY STAR certified buildings
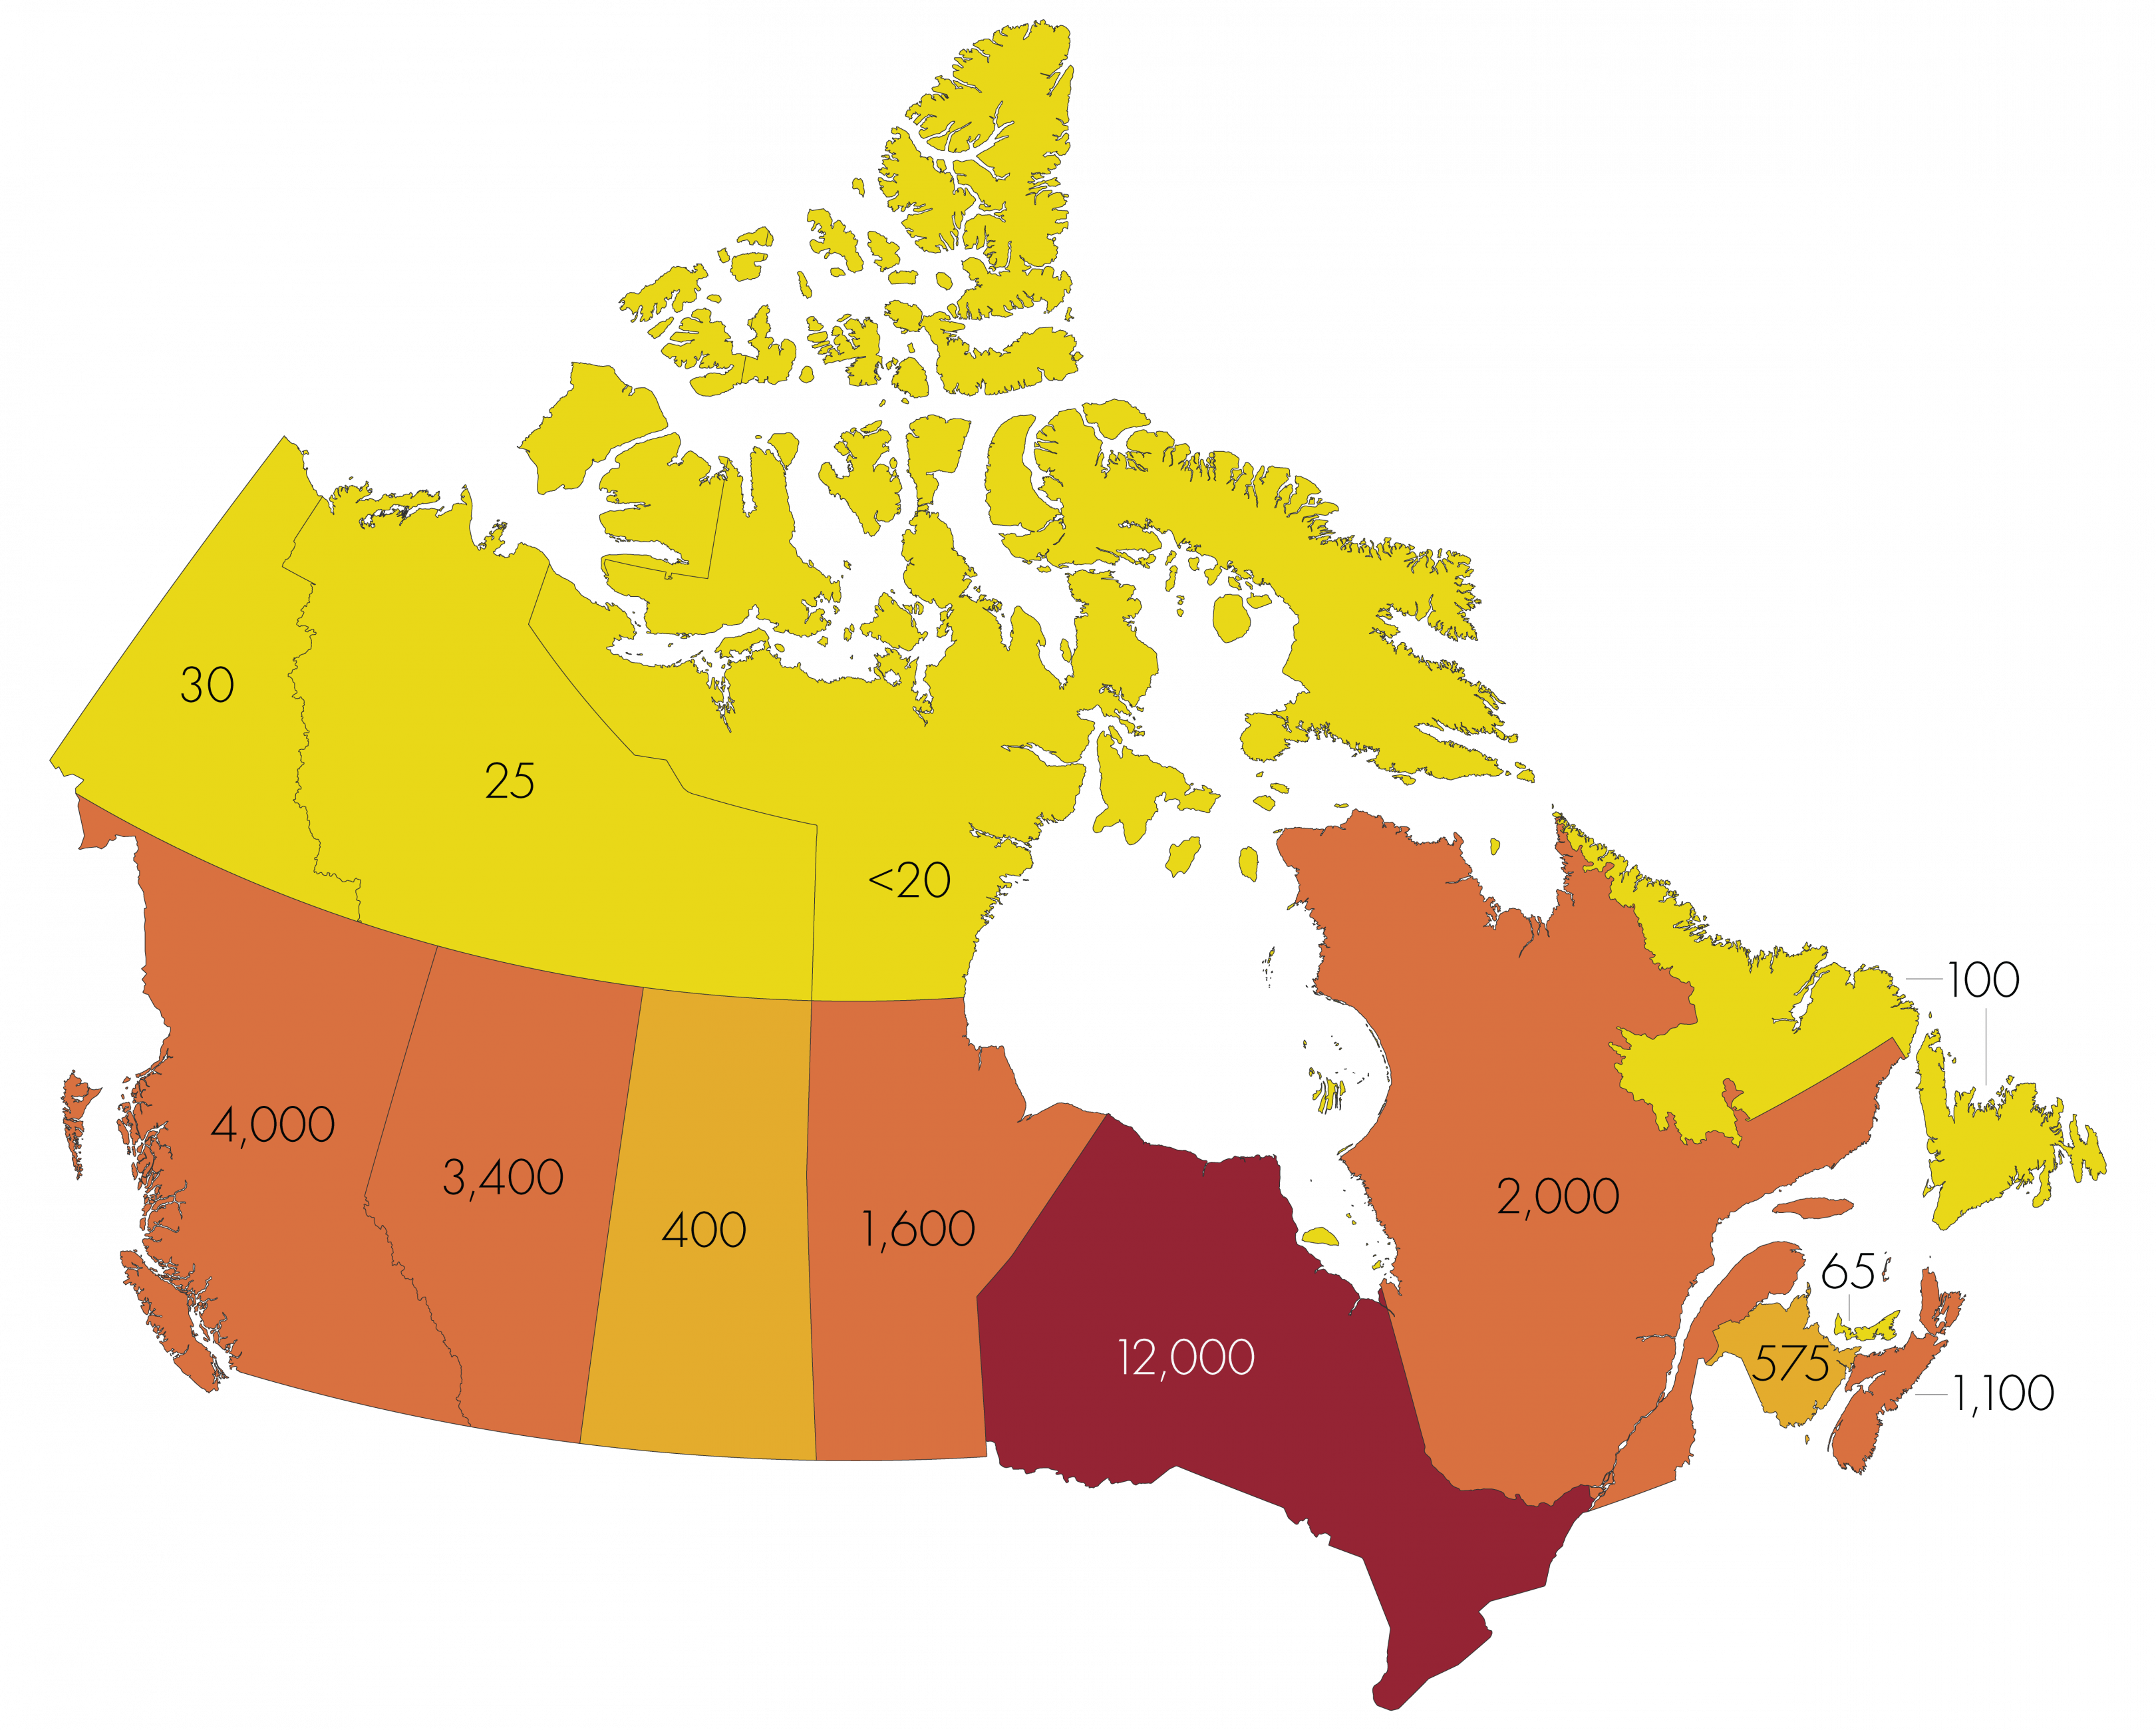
Text version - population overview map
| Province or Territory | Number of buildings benchmarking |
|---|---|
| Alberta | 3,400 |
| British Columbia | 4,000 |
| Manitoba | 1,600 |
| New Brunswick | 575 |
| Newfoundland and Labrador | 100 |
| Northwest Territories | 25 |
| Nova Scotia | 1,100 |
| Nunavut | <20 |
| Ontario | 12,000 |
| Prince Edward Island | 65 |
| Quebec | 2,000 |
| Saskatchewan | 400 |
| Yukon | 300 |
Fuel and population breakdown
Figure 1. Total energy use breakdown

This diagram shows the total energy use breakdown for all buildings in the tool for the given year.
Text version - total energy use breakdown
| Fuel | Energy use breakdown |
|---|---|
| Electricity | 52% |
| On-site Electricity | <1% |
| Natural Gas | 40% |
| Fuel Oil | <1% |
| District Steam | 5% |
| District Chilled Water | 1% |
| Propane | <1% |
| Other | 1% |
Figure 2. Benchmarking by building type

This diagram shows the number of buildings for each scorable type as a percentage of the tool number of buildings benchmarked in Portfolio Manager. Office is the most common building type.
Text version - benchmarking by building type
| Building type | Benchmarking by building type |
|---|---|
| Office | 27% |
| Medical Office | <1% |
| K-12 School | 10% |
| Senior Living | 2% |
| Warehouse | 3% |
| Hospital | 1% |
| Food Retail | 2% |
| Non-food retail | 4% |
| Other | 33% |
| Multifamily Housing | 16% |
| Hotels | <1% |
| Ice or Curling Rink | 1% |
Table 1. Benchmarking by city
| City | Buildings | Floor area(m2) |
|---|---|---|
| Greater Toronto | 7,200 | 135,500,000 |
| Greater Vancouver | 2,200 | 24,500,000 |
| Island of Montreal | 1,000 | 24,000,000 |
| Winnipeg | 975 | 6,000,000 |
| Calgary | 1,400 | 22,000,000 |
| Ottawa-Gatineau | 1,100 | 19,500,000 |
| Edmonton | 775 | 12,500,000 |
| Halifax Regional Municipality | 500 | 4,000,000 |
| Victoria | 175 | 1,000,000 |
| Quebec | 200 | 2,750,000 |
| Regina | 125 | 1,000,000 |
| Fredericton | 65 | 750,000 |
| Charlottetown | 40 | 200,000 |
| St John's | 30 | 250,000 |
Cities included are the capital cities and the largest metropolitan areas for each province. Only the top 14 cities are shown.
Table 2. Benchmarking by province and territory
| Province or territory | Buildings | Floor area(m2) |
|---|---|---|
| Alberta | 3,400 | 40,500,000 |
| British Columbia | 4,000 | 33,000,000 |
| Manitoba | 1,600 | 8,000,000 |
| New Brunswick | 575 | 3,000,000 |
| Newfoundland and Labrador | 100 | 350,000 |
| Northwest Territories | 25 | <100,000 |
| Nova Scotia | 1,100 | 6,000,000 |
| Nunavut | 25 | <100,000 |
| Ontario | 12,000 | 189,000,000 |
| Prince Edward Island | 65 | 300,000 |
| Quebec | 2,000 | 34,500,000 |
| Saskatchewan | 400 | 2,250,000 |
| Yukon | 300 | 450,000 |
| Total | 26,000 | 318,500,000 |
For privacy reasons, data are not provided for provinces and territories with fewer than 20 registered buildings and/or 100,000 m2 of gross floor area. Numbers may not sum to the total indicated due to rounding. Variations from previous snapshots are possible because of changes in user entry or improved filtering, and data cleaning.
Benchmarking Growth
Figure 3. Overall benchmarking growth

This diagram shows the overall growth of benchmarking buildings in the tool since its adoption in 2013.
Text version - overall benchmarking growth
| Year | Number of buildings benchmarking |
|---|---|
| 2013 | 6,100 |
| 2014 | 8,400 |
| 2015 | 10,500 |
| 2016 | 11,500 |
| 2017 | 16,000 |
| 2018 | 18,000 |
| 2019 | 22,500 |
| 2020 | 26,000 |
Figure 4. Benchmarking growth by Province and Territory

This diagram shows the growth of benchmarking buildings by province and territory in the tool since its adoption in 2013.
Text version - growth by Province and Territory
| Province and Territory | Number of buildings benchmarking by Year | |||||||
|---|---|---|---|---|---|---|---|---|
| 2013 | 2014 | 2015 | 2016 | 2017 | 2018 | 2019 | 2020 | |
| AB | 800 | 1,200 | 1,500 | 1,900 | 2,300 | 2,600 | 2,800 | 3,400 |
| BC | 1,100 | 1,800 | 2,000 | 2,200 | 3,000 | 3,200 | 3,400 | 4,000 |
| MB | 100 | 300 | 1,000 | 1,000 | 1,400 | 1,600 | 1,600 | 1,600 |
| NB | 20 | 100 | 100 | 100 | 200 | 200 | 400 | 500 |
| NL | - | 30 | 40 | 45 | 90 | 95 | 100 | 100 |
| NS | 100 | 100 | 300 | 300 | 500 | 700 | 800 | 1,100 |
| ON | 3,100 | 3,800 | 4,300 | 4,600 | 6,600 | 7,400 | 11,000 | 12,000 |
| PE | - | - | 35 | 40 | 60 | 60 | 60 | 65 |
| QC | 400 | 600 | 800 | 900 | 1,400 | 1,700 | 1,900 | 2,000 |
| SK | 100 | 200 | 200 | 200 | 200 | 300 | 300 | 400 |
| Territories | - | - | - | - | 50 | 50 | 50 | 325 |
Figure 5. Benchmarking growth by Census Metropolitan Area (CMA)

This diagram shows the growth of benchmarking buildings by Census metropolitan area (CMA) in the tool since its adoption in 2013.
Text version - growth by Census Metropolitan Area
| CMA | Number of buildings benchmarking by Year | |||||||
|---|---|---|---|---|---|---|---|---|
| 2013 | 2014 | 2015 | 2016 | 2017 | 2018 | 2019 | 2020 | |
| Calgary | 400 | 600 | 700 | 700 | 800 | 900 | 1,000 | 1,400 |
| Charlottetown | - | - | 30 | 30 | 40 | 40 | 45 | 45 |
| Edmonton | 100 | 100 | 300 | 300 | 500 | 600 | 700 | 800 |
| Fredericton | - | - | - | - | - | 30 | 50 | 65 |
| Greater Toronto | 2,300 | 2,500 | 2,700 | 2,800 | 4,100 | 4,500 | 6,800 | 7,300 |
| Greater Vancouver | 700 | 1,100 | 1,400 | 1,500 | 1,900 | 1,900 | 2,100 | 2,200 |
| Halifax Regional Municipality | 100 | 100 | 200 | 200 | 300 | 400 | 400 | 500 |
| Island of Montréal | 300 | 300 | 400 | 400 | 700 | 800 | 900 | 1,000 |
| Ottawa-Gatineau | 300 | 400 | 400 | 400 | 500 | 600 | 1,000 | 1,100 |
| Québec City | 40 | 55 | 85 | 85 | 100 | 100 | 100 | 200 |
| Regina | 100 | 95 | 100 | 100 | 100 | 100 | 100 | 100 |
| St. John's | - | - | - | - | 20 | 25 | 25 | 30 |
| Victoria | 25 | 60 | 95 | 95 | 100 | 100 | 100 | 100 |
| Winnipeg | 100 | 200 | 500 | 500 | 700 | 900 | 900 | 900 |
Figure 6. Benchmarking growth by building type

This diagram shows the growth of benchmarking buildings by province and territory in the tool since its adoption in 2013.
Text version - growth by building type
| Building type | Number of buildings benchmarking by Year | |||||||
|---|---|---|---|---|---|---|---|---|
| 2013 | 2014 | 2015 | 2016 | 2017 | 2018 | 2019 | 2020 | |
| Food Retail | 400 | 400 | 200 | 300 | 300 | 300 | 400 | 400 |
| Hospital | 65 | 200 | 200 | 200 | 200 | 200 | 200 | 300 |
| Hotel | 70 | 80 | 100 | 100 | 100 | 100 | 100 | 100 |
| Ice/Curling Rink | - | 40 | 75 | 80 | 100 | 200 | 200 | 200 |
| K-12 School | 400 | 600 | 1,100 | 1,100 | 1,600 | 1,700 | 2,000 | 2,500 |
| Medical Office | 25 | 25 | 35 | 40 | 75 | 85 | 100 | 100 |
| Multifamily Housing | 400 | 500 | 800 | 800 | 1,000 | 1,200 | 3,300 | 4,100 |
| Non-Food Retail | 80 | 100 | 200 | 200 | 300 | 300 | 700 | 1,100 |
| Office | 2,800 | 3,300 | 3,900 | 4,300 | 5,400 | 5,900 | 6,500 | 6,900 |
| Senior Living | 25 | 35 | 85 | 95 | 100 | 100 | 300 | 400 |
| Warehouse | 100 | 100 | 200 | 200 | 400 | 400 | 700 | 800 |
| Other | 1,500 | 2,700 | 3,400 | 3,800 | 6,200 | 7,000 | 7,900 | 8,800 |
Certification Trends
Table 3. Total certification by province and territory by year
| Province or territory | 2018 | 2019 | 2020 |
|---|---|---|---|
| Alberta | 28 | 29 | 33 |
| British Columbia | 15 | 32 | 35 |
| Manitoba | 4 | 6 | 6 |
| New Brunswick | 2 | 5 | 4 |
| Newfoundland and Labrador | 0 | 0 | 0 |
| Northwest Territories | 0 | 0 | 0 |
| Nova Scotia | 2 | 2 | 0 |
| Nunavut | 0 | 0 | 0 |
| Ontario | 55 | 76 | 93 |
| Prince Edward Island | 0 | 0 | 0 |
| Quebec | 13 | 10 | 6 |
| Saskatchewan | 0 | 1 | 5 |
| Yukon | 0 | 0 | 0 |
| Total | 119 | 161 | 182 |
This table shows the sum of certifications per year and province in Canada (this includes first-time certifications and re-certifications).
The certification program recognizes buildings that are in the upper 25% of energy performance compared to similar buildings across Canada. You can learn more here.
Energy and area distribution
Figure 7. Top performers by building type relative to median

This diagram shows the number of buildings in the tool with a Source EUI above or below the median as determined from the survey data.
Text version - top performers by building type relative to median
| Building type | Source EUI (GJ/m²) | |
|---|---|---|
| Office | 0.9 | P10 |
| Office | 1.56 | P50 |
| Office | 2.58 | P90 |
| Medical Office | 0.78 | P10 |
| Medical Office | 1.59 | P50 |
| Medical Office | 3.1 | P90 |
| K-12 School | 0.56 | P10 |
| K-12 School | 0.93 | P50 |
| K-12 School | 1.47 | P90 |
| Senior Living | 0.91 | P10 |
| Senior Living | 1.63 | P50 |
| Senior Living | 2.74 | P90 |
| Warehouse | 0.36 | P10 |
| Warehouse | 0.99 | P50 |
| Warehouse | 2.28 | P90 |
| Hospital | 1.9 | P10 |
| Hospital | 3.28 | P50 |
| Hospital | 4.78 | P90 |
| Food Retail | 1.47 | P10 |
| Food Retail | 3.36 | P50 |
| Food Retail | 5.31 | P90 |
| Non-Food Retail | 0.82 | P10 |
| Non-Food Retail | 1.41 | P50 |
| Non-Food Retail | 2.4 | P90 |
| Other | 0.53 | P10 |
| Other | 1.64 | P50 |
| Other | 5 | P90 |
| Multifamily Housing | 0.55 | P10 |
| Multifamily Housing | 1.06 | P50 |
| Multifamily Housing | 1.63 | P90 |
| Hotels | 0.89 | P10 |
| Hotels | 1.62 | P50 |
| Hotels | 2.71 | P90 |
| Ice or Curling Rink | 1.12 | P10 |
| Ice or Curling Rink | 2.24 | P50 |
| Ice or Curling Rink | 3.52 | P90 |
Figure 8. Source EUI distribution
Legend
Portfolio Manager distribution;
10th Percentile = 0.62 GJ/m2;
50th Percentile (Median) = 1.39 GJ/m2;
90th Percentile = 3.1 GJ/m2

This diagram shows the source EUI distribution for all buildings in ENERGY STAR Portfolio Manager. The median source EUI is 1.39 GJ/m2
Text version - source EUI distribution
| Building source EUI (GJ/m2) | Number of buildings |
|---|---|
| ALL p10 | 0.62 |
| ALL p50 | 1.39 |
| ALL p90 | 3.1 |
| 0 | 0 |
| 0.2 | 383 |
| 0.4 | 726 |
| 0.6 | 1,232 |
| 0.8 | 2,019 |
| 1 | 2,502 |
| 1.2 | 2,950 |
| 1.4 | 2,887 |
| 1.6 | 2,502 |
| 1.8 | 1,954 |
| 2 | 1,555 |
| 2.2 | 1,168 |
| 2.4 | 892 |
| 2.6 | 747 |
| 2.8 | 531 |
| 3 | 344 |
| 3.2 | 283 |
| 3.4 | 256 |
| 3.6 | 193 |
| 3.8 | 187 |
| 4 | 156 |
| 4.2 | 127 |
| 4.4 | 99 |
| 4.6 | 92 |
| 4.8 | 92 |
| 5 | 82 |
| 5.2 | 67 |
| 5.4 | 53 |
| 5.6 | 42 |
| 5.8 | 35 |
| 6 | 31 |
| 6.2 | 38 |
| 6.4 | 32 |
| 6.6 | 31 |
| 6.8 | 21 |
| 7 | 30 |
| 7.2 | 22 |
| 7.4 | 31 |
| 7.6 | 32 |
| 7.8 | 24 |
| 8 | 19 |
| 8.2 | 26 |
| 8.4 | 30 |
| 8.6 | 25 |
| 8.8 | 23 |
| 9 | 19 |
| 9.2 | 14 |
| 9.4 | 20 |
| 9.6 | 12 |
| 9.8 | 23 |
| 10 | 17 |
Figure 9. Distribution of floor area and buildings
Legend

% Floor Area

% Buildings

This diagram shows that larger buildings represent a relatively small portion of the number of buildings, but account for a majority of the floor space benchmarked in Portfolio Manager. The median gross floor area is 4,800 m2.
Text version - distribution of floor area and buildings
| Floor area | Percentage of population |
|---|---|
| less than 500 m2 | 0% |
| 500 to 1,000 m2 | 1% |
| 1,000 to 5,000 m2 | 6% |
| 5,000 to 10,000 m2 | 8% |
| 10,000 to 20,000 m2 | 19% |
| 20,000 to 50,000 m2 | 31% |
| Over 50,000 m2 | 36% |
| Buildings | Percentage of population |
|---|---|
| less than 500 m2 | 15% |
| 500 to 1,000 m2 | 9% |
| 1,000 to 5,000 m2 | 27% |
| 5,000 to 10,000 m2 | 14% |
| 10,000 to 20,000 m2 | 17% |
| 20,000 to 50,000 m2 | 13% |
| Over 50,000 m2 | 5% |
Definitions and data information
- ENERGY USE INTENSITY (EUI)
- EUI is the energy use per square metre at a property. EUI enables you to compare different size buildings.
- SITE ENERGY VERSUS SOURCE ENERGY
- There are two ways of measuring energy: at the site and at the source.
- Site
- SITE ENERGY is the simplest way to measure energy because it accounts only for the energy your property itself uses, as measured by your energy meters. The usage that appears on your utility bills is a site energy measurement.
- Source
-
SOURCE ENERGY not only measures the energy used by your property, but also accounts for energy losses incurred during the production, transmission and delivery of energy to your property, source energy is a more accurate measurement of the energy actually required to run your building.
ENERGY STAR Portfolio Manager uses source energy. This is the most equitable unit of evaluation, which enables a complete assessment of building-level energy efficiency.
For more information, see the ENERGY STAR Portfolio Manager Technical Reference: Source Energy.
Data quality
The data is self-reported and has been filtered to exclude outliers, buildings with less than a full year of consumption data, cases that are used for testing purposes, and an additional filter was applied. Variations from previous snapshots are possible because of changes in user entry, improved filtering, and data cleaning. Buildings registered in Portfolio Manager do not represent a randomly selected sample and are not the basis for the ENERGY STAR score.
For more information on ENERGY STAR Portfolio Manager, contact Natural Resources Canada at buildings-batiments@nrcan-rncan.gc.ca
The ENERGY STAR and PORTFOLIO MANAGER names and the ENERGY STAR symbol are trademarks registered in Canada by the United States Environmental Protection Agency and are administered and promoted by Natural Resources Canada.
Page details
- Date modified: