
Energy Benchmarking Data Snapshots for Multifamily Housing

On this page
- Multifamily housing buildings
- Population overview
- Fuel and population breakdown
- Energy and area distribution
- Building characteristics
- Definitions and data information
Multifamily housing buildings
ENERGY STAR® Portfolio Manager® is a tool used to track the energy use of 26,000 buildings in Canada. Energy benchmarking can help identify opportunities to save on energy costs and reduce environmental impact. This document provides a snapshot of the Canadian data for Multifamily Housing entered into Portfolio Manager as of December 2020.
Population overview
Quick facts
- 4,100 buildings
- 62.5 million m2 floor area
- 0.8 GJ/m2 median site energy use intensity (EUI)
- 1.1 GJ/m2 median source EUI
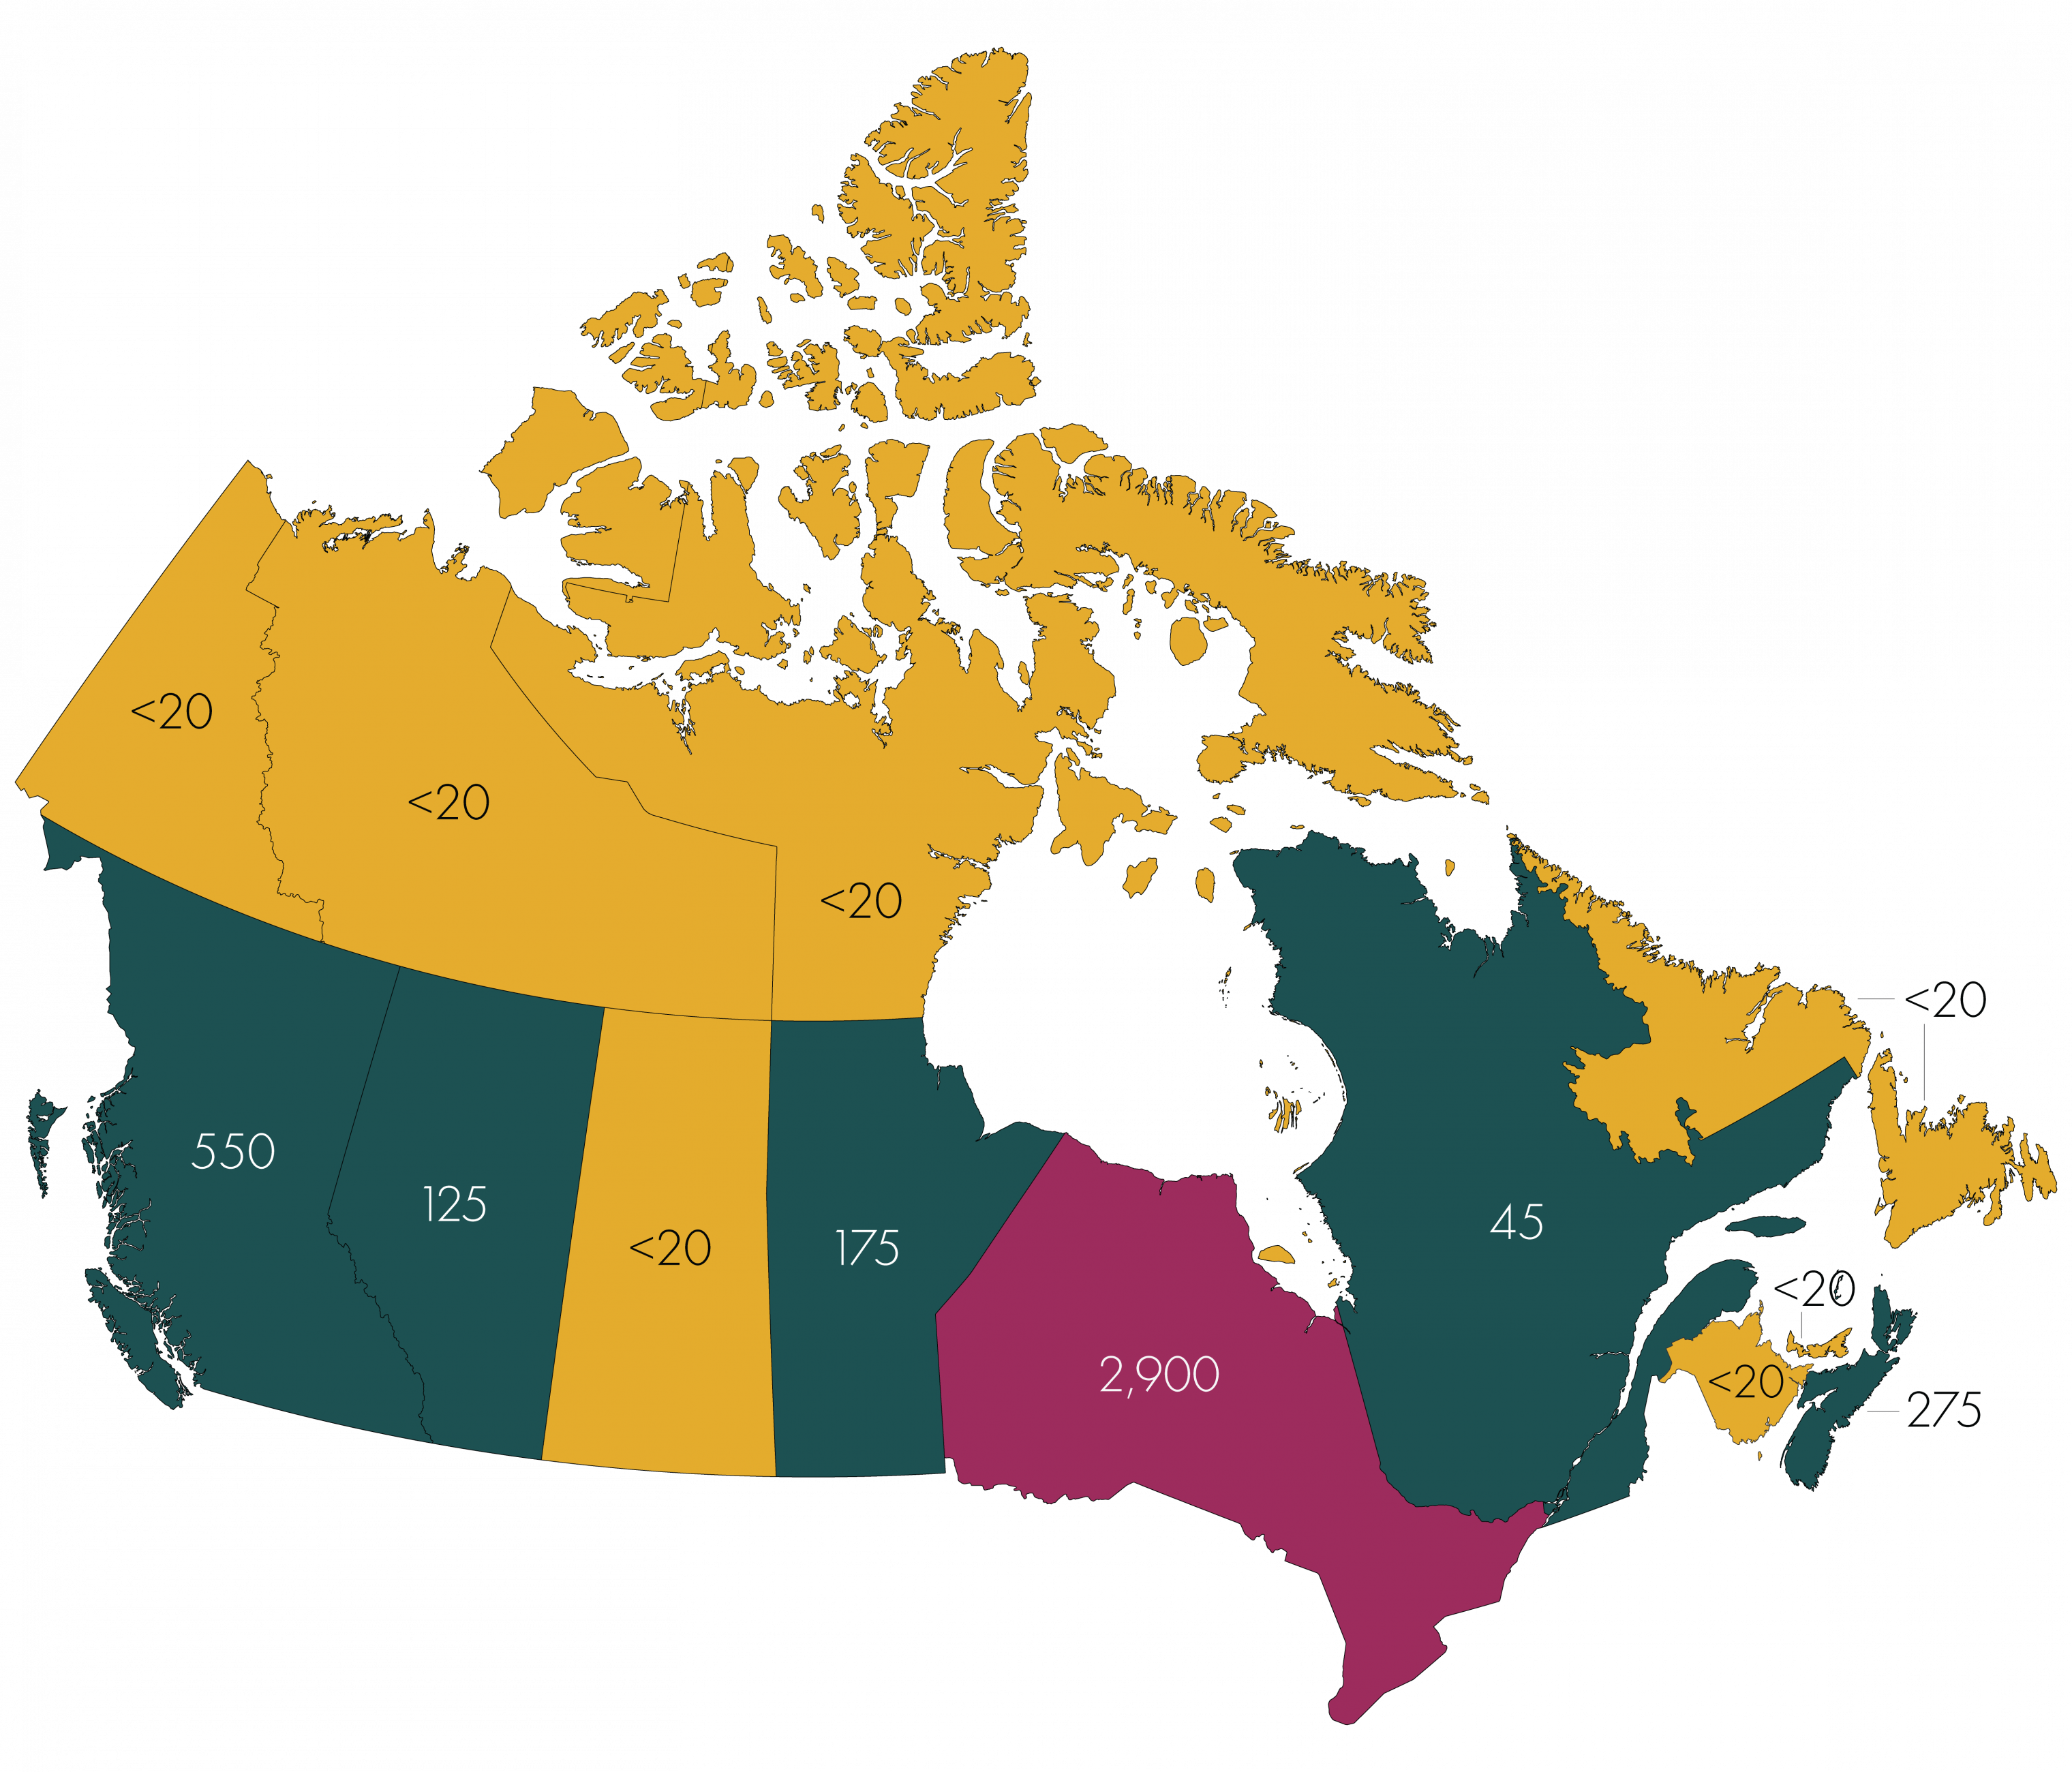
Text version - population overview map
| Province or Territory | Number of buildings benchmarking |
|---|---|
| Alberta | 125 |
| British Columbia | 550 |
| Manitoba | 175 |
| New Brunswick | <20 |
| Newfoundland and Labrador | <20 |
| Northwest Territories | <20 |
| Nova Scotia | 275 |
| Nunavut | <20 |
| Ontario | 2,900 |
| Prince Edward Island | <20 |
| Quebec | 45 |
| Saskatchewan | <20 |
| Yukon | <20 |
Fuel and population breakdown
Figure 1. Total energy use breakdown
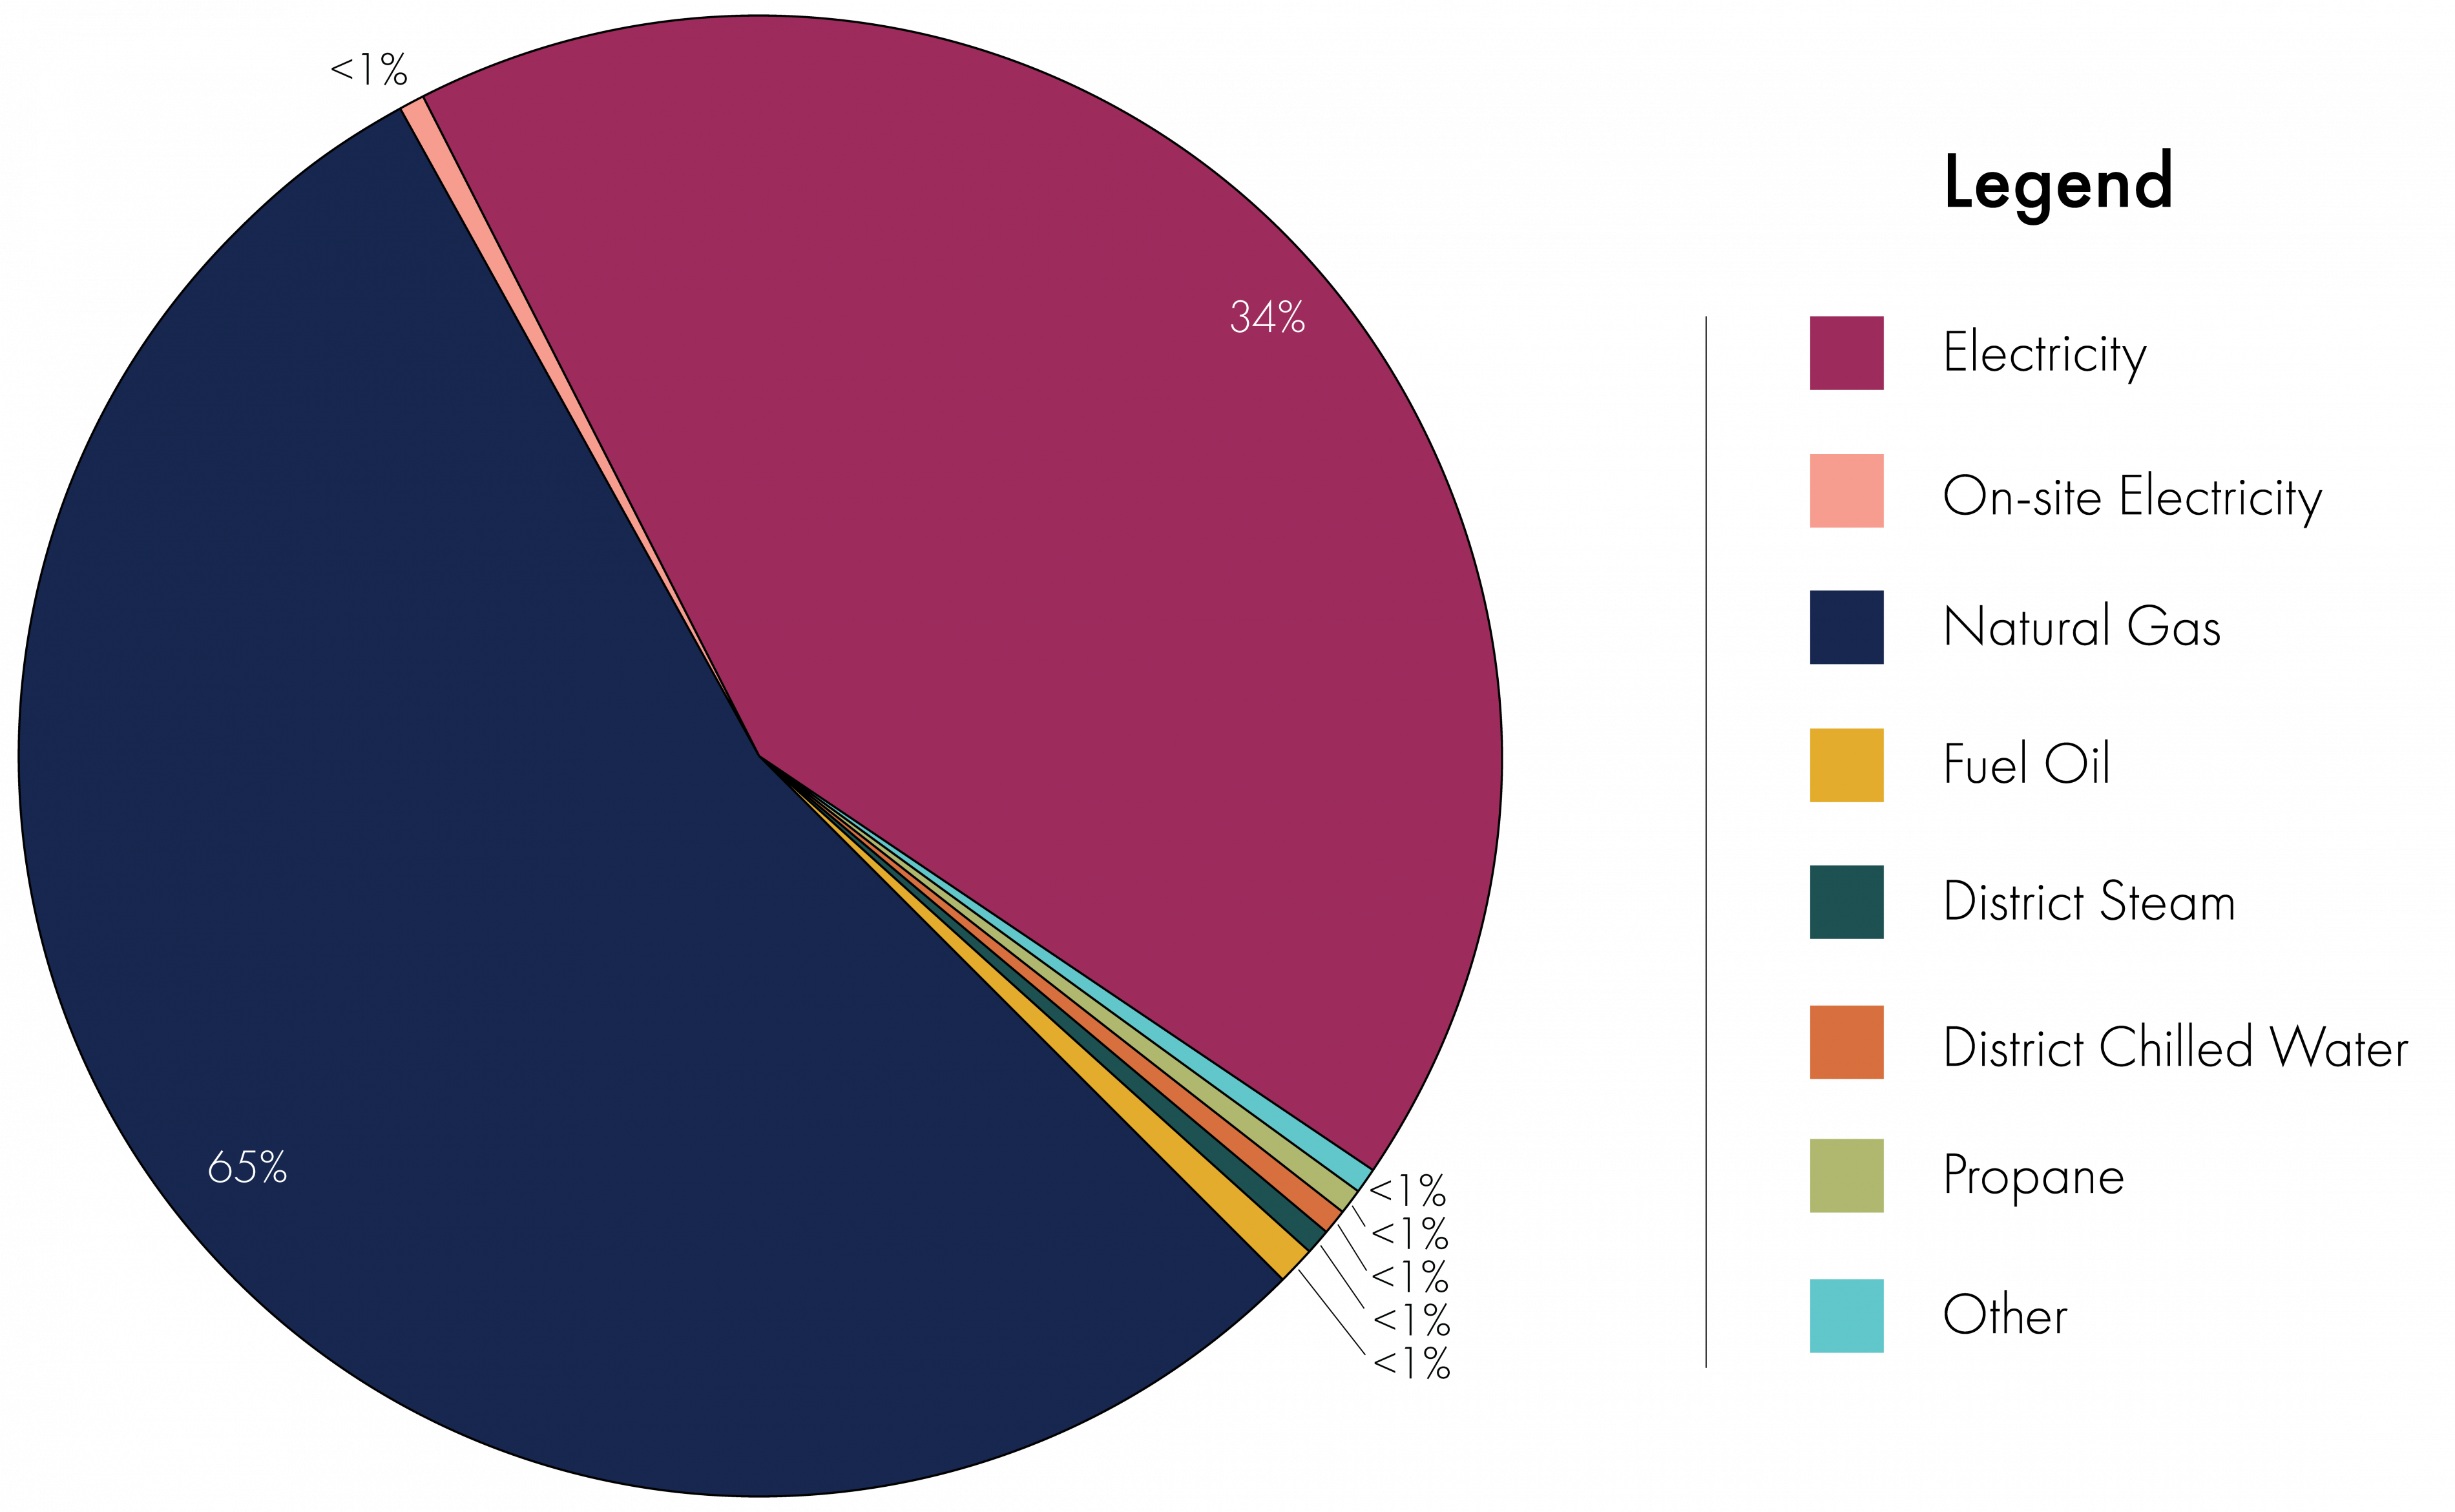
Text version - total energy use breakdown
| Fuel | Energy use breakdown |
|---|---|
| Electricity | 34% |
| On-site Electricity | <1% |
| Natural Gas | 65% |
| Fuel Oil | <1% |
| District Steam | <1% |
| District Chilled Water | <1% |
| Propane | <1% |
| Other | <1% |
Table 1. Benchmarking by province and territory
| Province or territory | Buildings | Floor area(m2) | Certified |
|---|---|---|---|
| Alberta | 125 | 1,250,000 | N/A |
| British Columbia | 550 | 3,500,000 | N/A |
| Manitoba | 175 | 500,000 | N/A |
| New Brunswick | <20 | <100,000 | N/A |
| Newfoundland and Labrador | <20 | <100,000 | N/A |
| Northwest Territories | <20 | <100,000 | N/A |
| Nova Scotia | 275 | 700,000 | N/A |
| Nunavut | <20 | <100,000 | N/A |
| Ontario | 2,900 | 55,000,000 | N/A |
| Prince Edward Island | <20 | <100,000 | N/A |
| Quebec | 45 | 850,000 | N/A |
| Saskatchewan | <20 | <100,000 | N/A |
| Yukon | <20 | <100,000 | N/A |
| Total | 4,100 | 62,500,000 | N/A |
For privacy reasons, data are not provided for provinces and territories with fewer than 20 registered buildings and/or 100,000 m2 of gross floor area. Numbers may not sum to the total indicated due to rounding. Variations from previous snapshots are possible because of changes in user entry or improved filtering, and data cleaning.
Energy and area distribution
Figure 2. Source EUI distribution
Legend
Portfolio Manager distribution;
10th Percentile = 0.55 GJ/m2;
50th Percentile (Median) = 1.06 GJ/m2;
90th Percentile = 1.63 GJ/m2
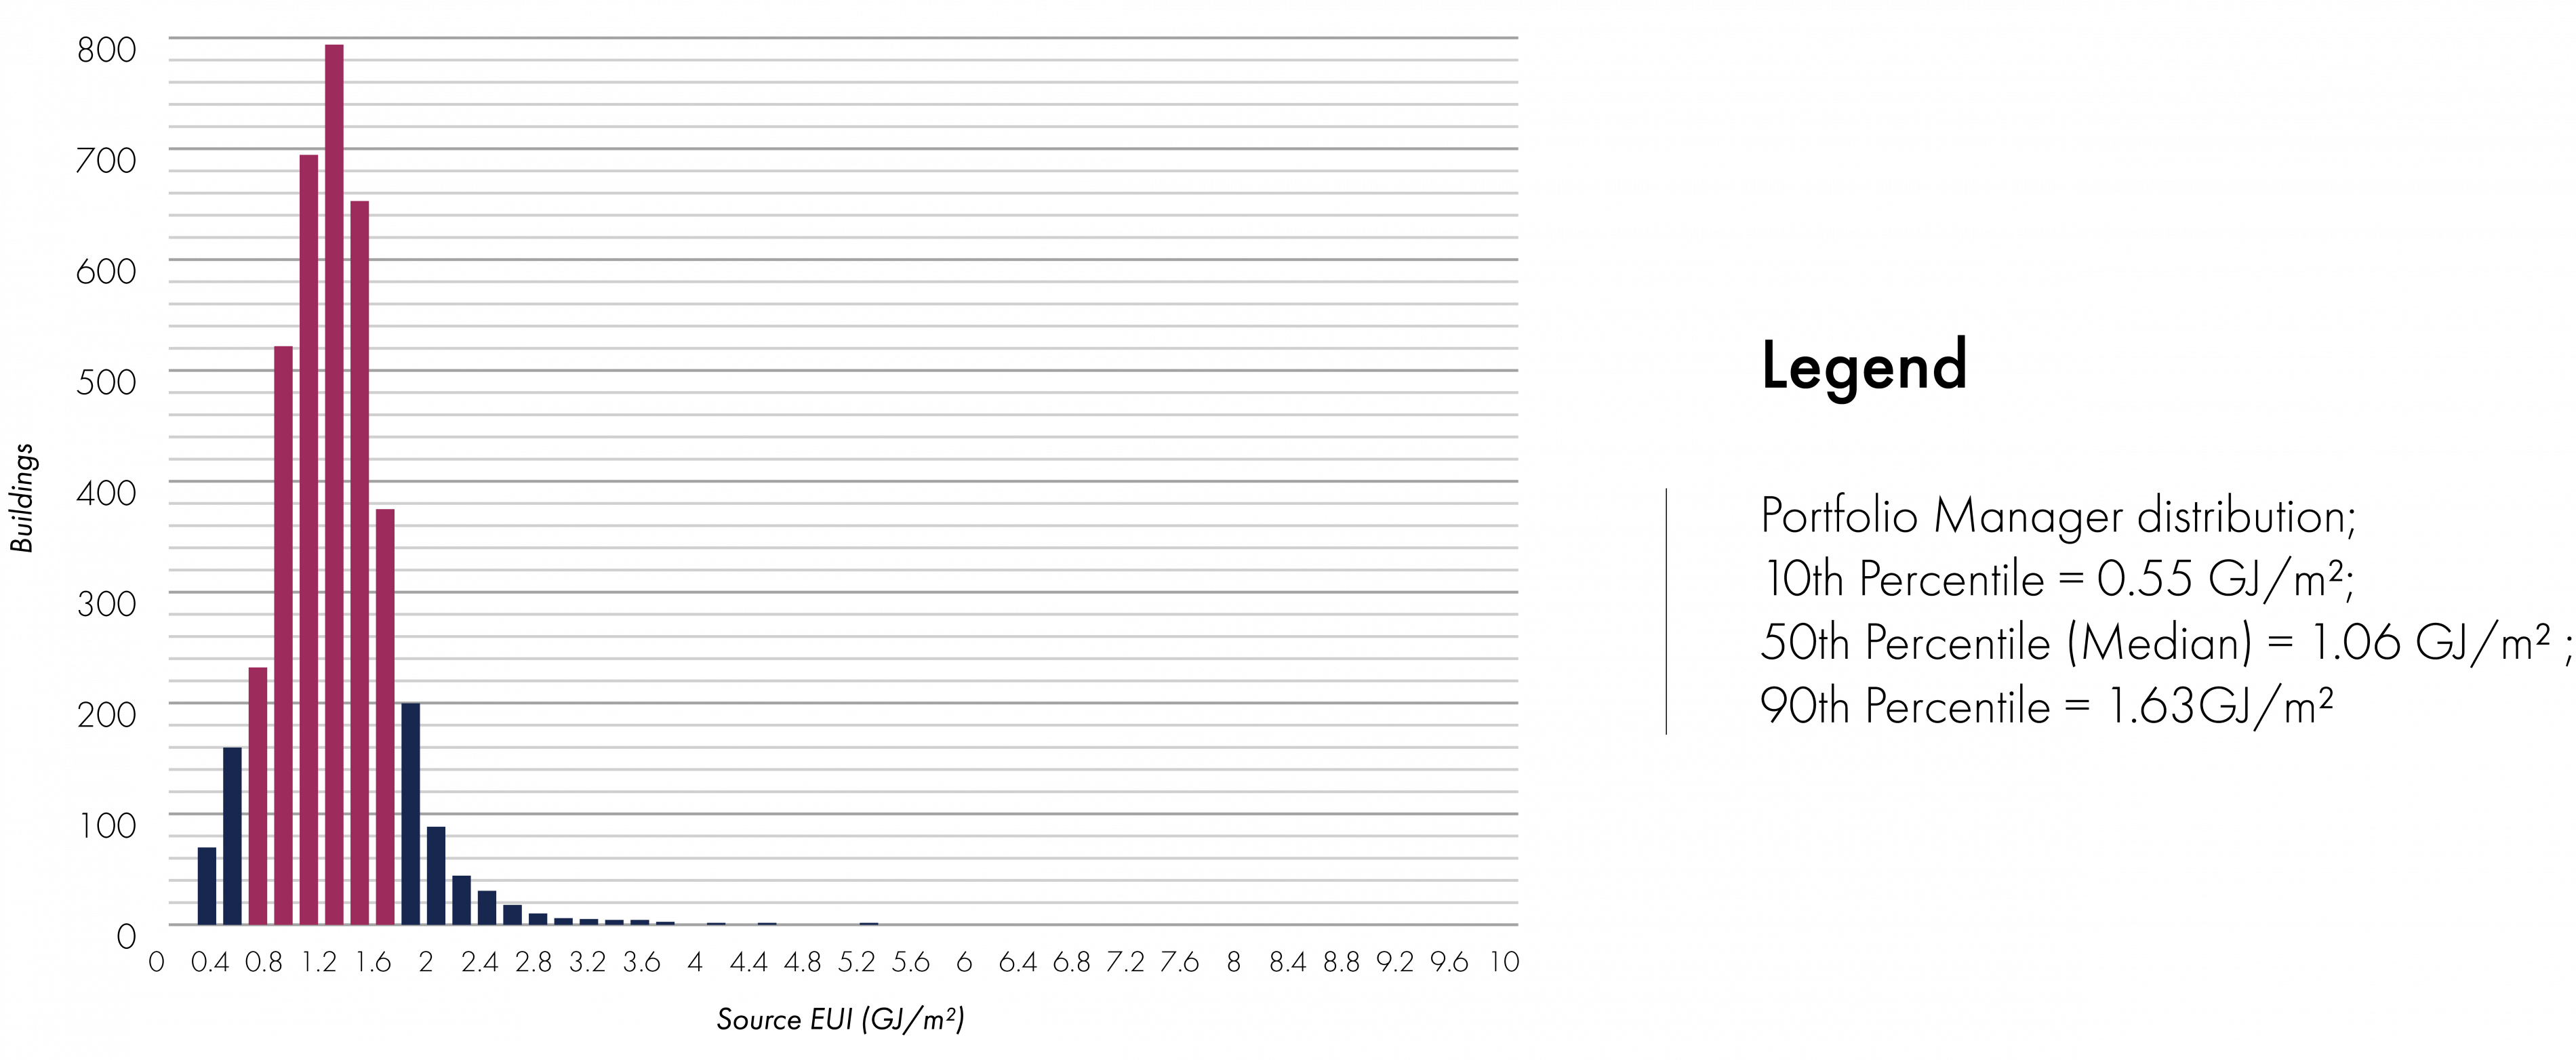
This diagram shows the source EUI distribution for this building type. The median source EUI is 1.06 GJ/m²
Text version - source EUI distribution
| Building source EUI (GJ/m2) | Number of buildings |
|---|---|
| 0 | 0 |
| 0.2 | 70 |
| 0.4 | 160 |
| 0.6 | 232 |
| 0.8 | 522 |
| 1 | 694 |
| 1.2 | 794 |
| 1.4 | 653 |
| 1.6 | 375 |
| 1.8 | 200 |
| 2 | 88 |
| 2.2 | 44 |
| 2.4 | 31 |
| 2.6 | 18 |
| 2.8 | 10 |
| 3 | 6 |
| 3.2 | 5 |
| 3.4 | 4 |
| 3.6 | 4 |
| 3.8 | 3 |
| 4 | 1 |
| 4.2 | 2 |
| 4.4 | 1 |
| 4.6 | 1 |
| 4.8 | 1 |
| 5 | 2 |
| 5.2 | 0 |
| 5.4 | 0 |
| 5.6 | 0 |
| 5.8 | 0 |
| 6 | 0 |
| 6.2 | 2 |
| 6.4 | 0 |
| 6.6 | 1 |
| 6.8 | 2 |
| 7 | 1 |
| 7.2 | 1 |
| 7.4 | 2 |
| 7.6 | 0 |
| 7.8 | 0 |
| 8 | 1 |
| 8.2 | 0 |
| 8.4 | 1 |
| 8.6 | 1 |
| 8.8 | 0 |
| 9 | 0 |
| 9.2 | 0 |
| 9.4 | 0 |
| 9.6 | 0 |
| 9.8 | 0 |
| 10 | 0 |
Figure 3. Distribution of floor area and buildings
Legend

% Buildings

% Floor Area

This diagram shows over half the multifamily buildings have a floor area between 10,000 and 50,000 m2. The average gross floor area is 16,100 m2, and the median is 13,000 m2.
Text version - distribution of floor area and buildings
| Floor area | Percentage of population |
|---|---|
| less than 500 m2 | 0% |
| 500 to 1,000 m2 | 0% |
| 1,000 to 5,000 m2 | 3% |
| 5,000 to 10,000 m2 | 7% |
| 10,000 to 20,000 m2 | 31% |
| 20,000 to 50,000 m2 | 47% |
| Over 50,000 m2 | 13% |
| Buildings | Percentage of population |
|---|---|
| less than 500 m2 | 0% |
| 500 to 1,000 m2 | 4% |
| 1,000 to 5,000 m2 | 19% |
| 5,000 to 10,000 m2 | 15% |
| 10,000 to 20,000 m2 | 34% |
| 20,000 to 50,000 m2 | 26% |
| Over 50,000 m2 | 3% |
Building characteristics
Table 2. Characteristics of multifamily housing – range of values
| Building characteristics | 10th percentile | Median | 90th percentile | Gross floor area(m2) | 1,600 | 13,000 | 32,500 |
|---|---|---|---|
| Heating degree days | 2,963 | 3,928 | 4,862 |
| Cooling degree days | 48 | 286 | 468 |
| Bedrooms per 100m2 | 1.2 | 1.51 | 1.87 |
| Residential Units per 100m2 | 0.69 | 1.27 | 1.51 |
The buildings in this table represent 19% of the floor area and 15% of buildings registered in Portfolio Manager in Canada.
Definitions and data information
- ENERGY USE INTENSITY (EUI)
- EUI is the energy use per square metre at a property. EUI enables you to compare different size buildings.
- SITE ENERGY VERSUS SOURCE ENERGY
- There are two ways of measuring energy: at the site and at the source.
- Site
- SITE ENERGY is the simplest way to measure energy because it accounts only for the energy your property itself uses, as measured by your energy meters. The usage that appears on your utility bills is a site energy measurement.
- Source
-
SOURCE ENERGY not only measures the energy used by your property, but also accounts for energy losses incurred during the production, transmission and delivery of energy to your property, source energy is a more accurate measurement of the energy actually required to run your building.
ENERGY STAR Portfolio Manager uses source energy. This is the most equitable unit of evaluation, which enables a complete assessment of building-level energy efficiency.
For more information, see the ENERGY STAR Portfolio Manager Technical Reference: Source Energy.
Data quality
The data is self-reported and has been filtered to exclude outliers, buildings with less than a full year of consumption data, cases that are used for testing purposes, and an additional filter was applied. Variations from previous snapshots are possible because of changes in user entry, improved filtering, and data cleaning. Buildings registered in Portfolio Manager do not represent a randomly selected sample and are not the basis for the ENERGY STAR score.
For more information on ENERGY STAR Portfolio Manager, contact Natural Resources Canada at buildings-batiments@nrcan-rncan.gc.ca
The ENERGY STAR and PORTFOLIO MANAGER names and the ENERGY STAR symbol are trademarks registered in Canada by the United States Environmental Protection Agency and are administered and promoted by Natural Resources Canada.
Page details
- Date modified: