Fuel Focus, November 13, 2015
Table of Contents
- National Overview
- Recent Developments
- Retail Gasoline Overview
- Wholesale Gasoline Prices
- Gasoline Refining and Marketing Margins
- Crude Oil Overview
- Download the report
National Overview
Canadian retail gasoline prices increased by 4 cents per litre over the last two weeks
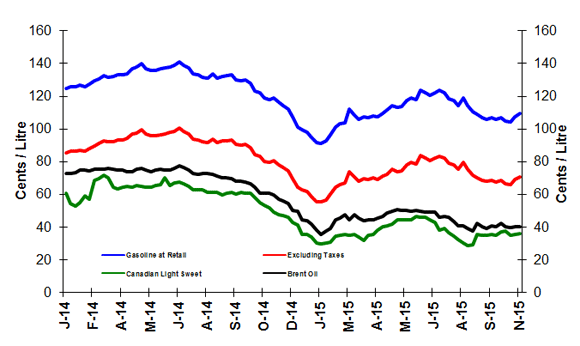
For the two-week period ending November 10, 2015, the Canadian average retail gasoline price reached $1.08 per litre. This is an increase of 4 cents compared to the two-week period ending October 27, 2015. Prices are 10 cents per litre lower than the same period last year.
Average retail diesel prices increased by 1 cent per litre over the past two weeks rising to $1.06. This is 22 cents less compared to the same period last year. Over the same period, furnace oil prices increased by 0.4 cents per litre to reach $1.00, almost 19 cents per litre less than a year ago.
Figure 1: Crude Oil and Regular Gasoline Price Comparison
(National Average)
Text version
Figure 1
The graph shows prices in cents per litre for gasoline at retail, gasoline excluding taxes, and Canadian Light Sweet and Brent crude oil prices. Gasoline prices ended the period of November10, 2015 at 109.4 cents per litre, excluding taxes at 70.9 cents per litre, Canadian Light Sweet at 36.1 cents per litre and Brent at 40.3cents per litre.
| Dates | Gasoline at retail | Excluding Taxes | Canadian Light Sweet | Brent crude |
|---|---|---|---|---|
| 07/01/2014 | 125.0 | 85.6 | 60.6 | 73.0 |
| 14/01/2014 | 125.6 | 86.2 | 54.6 | 72.6 |
| 21/01/2014 | 125.7 | 86.3 | 52.8 | 73.2 |
| 28/01/2014 | 126.6 | 87.0 | 55.1 | 74.9 |
| 04/02/2014 | 125.9 | 86.7 | 59.0 | 75.1 |
| 11/02/2014 | 127.6 | 88.2 | 57.0 | 74.4 |
| 18/02/2014 | 129.3 | 89.8 | 68.5 | 75.3 |
| 25/02/2014 | 130.7 | 91.0 | 69.7 | 75.4 |
| 04/03/2014 | 132.5 | 92.7 | 71.5 | 75.4 |
| 11/03/2014 | 131.8 | 92.1 | 70.3 | 75.9 |
| 18/03/2014 | 132.0 | 92.3 | 64.3 | 75.4 |
| 25/03/2014 | 132.9 | 93.2 | 63.4 | 74.7 |
| 01/04/2014 | 132.9 | 93.2 | 64.4 | 75.2 |
| 08/04/2014 | 133.9 | 94.1 | 65.1 | 73.7 |
| 15/04/2014 | 136.8 | 96.7 | 64.2 | 73.8 |
| 22/04/2014 | 137.7 | 97.4 | 65.5 | 75.7 |
| 29/04/2014 | 139.8 | 99.4 | 65.0 | 76.1 |
| 06/05/2014 | 136.9 | 96.8 | 64.2 | 74.8 |
| 13/05/2014 | 135.7 | 95.8 | 64.2 | 73.9 |
| 20/05/2014 | 136.0 | 95.9 | 65.2 | 75.0 |
| 27/05/2014 | 136.8 | 96.6 | 66.2 | 75.5 |
| 03/06/2014 | 137.4 | 97.2 | 70.3 | 75.0 |
| 10/06/2014 | 138.1 | 97.9 | 65.5 | 74.7 |
| 17/06/2014 | 138.8 | 98.5 | 67.1 | 76.0 |
| 24/06/2014 | 141.2 | 100.7 | 67.3 | 77.8 |
| 01/07/2014 | 138.7 | 98.4 | 66.5 | 76.7 |
| 08/07/2014 | 137.2 | 97.0 | 65.2 | 74.9 |
| 15/07/2014 | 133.8 | 93.9 | 62.9 | 72.9 |
| 22/07/2014 | 133.0 | 93.2 | 62.7 | 72.4 |
| 29/07/2014 | 131.8 | 92.1 | 63.0 | 72.9 |
| 05/08/2014 | 131.1 | 91.5 | 63.7 | 72.9 |
| 2014-08-12 | 133.6 | 93.8 | 61.0 | 72.3 |
| 2014-08-19 | 131.3 | 91.7 | 61.1 | 71.1 |
| 26/08/2014 | 132.1 | 92.5 | 59.8 | 70.2 |
| 02/09/2014 | 132.8 | 93.0 | 60.6 | 70.4 |
| 09/09/2014 | 133.0 | 93.3 | 61.2 | 69.5 |
| 16/09/2014 | 129.9 | 90.4 | 60.5 | 68.2 |
| 23/09/2014 | 129.4 | 90.0 | 61.1 | 68.0 |
| 30/09/2014 | 130.1 | 90.6 | 60.6 | 67.6 |
| 07/10/2014 | 128.0 | 88.8 | 60.8 | 66.4 |
| 14/10/2014 | 123.1 | 84.4 | 58.0 | 64.2 |
| 21/10/2014 | 121.9 | 83.2 | 54.8 | 60.5 |
| 28/10/2014 | 118.8 | 80.3 | 53.1 | 60.8 |
| 04/11/2014 | 117.8 | 79.5 | 51.7 | 60.8 |
| 11/11/2014 | 119.2 | 80.7 | 49.0 | 59.6 |
| 18/11/2014 | 116.2 | 78.1 | 47.5 | 57.2 |
| 25/11/2014 | 114.4 | 76.4 | 47.0 | 56.2 |
| 02/12/2014 | 112.3 | 74.4 | 45.9 | 54.3 |
| 09/12/2014 | 107.2 | 69.9 | 42.9 | 50.3 |
| 16/12/2014 | 101.1 | 64.4 | 41.4 | 49.7 |
| 23/12/2014 | 99.4 | 62.8 | 35.6 | 44.3 |
| 30/12/2014 | 98.1 | 61.6 | 35.7 | 44.2 |
| 06/01/2015 | 95.0 | 58.8 | 33.8 | 42.0 |
| 13/01/2015 | 91.5 | 55.7 | 30.5 | 38.1 |
| 20/01/2015 | 91.3 | 55.4 | 29.8 | 35.8 |
| 27/01/2015 | 92.5 | 56.5 | 30.3 | 37.6 |
| 03/02/2015 | 96.5 | 60.2 | 30.7 | 39.1 |
| 10/02/2015 | 101.2 | 64.5 | 34.7 | 44.2 |
| 17/02/2015 | 103.0 | 66.2 | 35.0 | 45.3 |
| 24/02/2015 | 103.7 | 66.8 | 35.7 | 47.7 |
| 03/03/2015 | 112.3 | 74.1 | 35.1 | 44.6 |
| 10/03/2015 | 108.6 | 70.6 | 35.4 | 47.4 |
| 17/03/2015 | 105.8 | 68.0 | 33.8 | 45.4 |
| 2015-03-24 | 107.3 | 69.5 | 31.6 | 43.7 |
| 2015-03-31 | 107.1 | 69.3 | 34.9 | 44.6 |
| 2015-04-07 | 108.1 | 70.2 | 35.6 | 44.2 |
| 2015-04-14 | 107.6 | 69.1 | 38.1 | 45.3 |
| 2015-04-21 | 109.70 | 72.8 | 40.5 | 46.8 |
| 2015-04-28 | 111.40 | 71.0 | 40.7 | 48.9 |
| 2015-05-05 | 114.5 | 75.3 | 41.8 | 49.9 |
| 2015-05-12 | 113.0 | 74.0 | 44.3 | 50.5 |
| 2015-05-19 | 113.6 | 74.6 | 44.5 | 50.1 |
| 2015-05-26 | 117.4 | 78.0 | 44.5 | 50.2 |
| 2015-06-02 | 119.0 | 79.4 | 44.6 | 49.8 |
| 2015-06-09 | 118.2 | 78.7 | 46.3 | 50.1 |
| 2015-06-16 | 123.6 | 83.7 | 46.0 | 50.0 |
| 2015-06-23 | 122.1 | 82.3 | 45.9 | 49.2 |
| 2015-06-30 | 120.6 | 80.9 | 44.4 | 49.4 |
| 2015-07-07 | 122.1 | 82.2 | 42.8 | 49.0 |
| 2015-07-14 | 123.5 | 83.5 | 38.1 | 46.0 |
| 2015-07-21 | 122.2 | 82.3 | 39.1 | 46.6 |
| 2015-07-28 | 118.4 | 78.9 | 36.5 | 45.8 |
| 2015-08-04 | 117.6 | 78.1 | 34.6 | 43.4 |
| 2015-08-11 | 114.5 | 75.5 | 30.3 | 40.7 |
| 2015-08-18 | 118.8 | 79.5 | 28.8 | 39.0 |
| 2015-08-25 | 114.1 | 75.3 | 29.0 | 37.8 |
| 2015-09-01 | 110.6 | 72.0 | 35.6 | 42.5 |
| 2015-09-08 | 108.9 | 70.4 | 35.1 | 40.4 |
| 2015-09-15 | 107.1 | 68.7 | 35.2 | 39.3 |
| 2015-09-22 | 106.1 | 67.9 | 35.2 | 39.3 |
| 2015-09-29 | 106.8 | 68.6 | 35.5 | 40.6 |
| 2015-10-06 | 105.7 | 67.6 | 35.2 | 40.2 |
| 2015-10-13 | 106.7 | 68.5 | 36.9 | 42.3 |
| 2015-10-20 | 104.6 | 66.7 | 37.8 | 40.0 |
| 2015-10-27 | 104.1 | 66.1 | 34.8 | 39.7 |
| 2015-11-03 | 107.2 | 68.9 | 35.4 | 40.1 |
| 2015-11-10 | 109.4 | 70.9 | 36.1 | 40.3 |
Figure 2: Weekly Regular Gasoline Prices

Text version
Figure 2
This graph shows the gasoline price trends from 2013 to 2015.
| Date | 2013 Gasoline at Retail | Date | 2014 Gasoline at Retail | Date | 2015 Gasoline at Retail |
|---|---|---|---|---|---|
| 13-01-01 | 118.90 | 14-01-07 | 125.00 | 15-01-06 | 95.00 |
| 13-01-08 | 120.60 | 14-01-14 | 125.60 | 15-01-13 | 91.50 |
| 13-01-15 | 118.90 | 14-01-21 | 125.70 | 15-01-20 | 91.30 |
| 13-01-22 | 119.70 | 14-01-28 | 126.60 | 15-01-27 | 92.50 |
| 13-01-29 | 123.30 | 14-02-04 | 125.90 | 15-02-03 | 96.50 |
| 13-02-05 | 129.20 | 14-02-11 | 127.60 | 15-02-10 | 101.20 |
| 13-02-12 | 127.70 | 14-02-18 | 129.30 | 15-02-17 | 103.00 |
| 13-02-19 | 130.50 | 14-02-25 | 130.70 | 15-02-24 | 103.70 |
| 13-02-26 | 131.20 | 14-03-04 | 132.50 | 15-03-03 | 112.30 |
| 13-03-05 | 131.20 | 14-03-11 | 131.80 | 15-03-10 | 108.60 |
| 13-03-12 | 129.90 | 14-03-18 | 132.00 | 15-03-17 | 105.80 |
| 13-03-19 | 130.10 | 14-03-25 | 132.90 | 15-03-24 | 107.30 |
| 13-03-26 | 129.40 | 14-04-01 | 132.90 | 15-03-31 | 107.10 |
| 13-04-02 | 128.70 | 14-04-08 | 133.90 | 15-04-07 | 108.10 |
| 13-04-09 | 126.50 | 14-04-15 | 136.80 | 15-04-14 | 107.60 |
| 13-04-16 | 125.00 | 14-04-22 | 137.70 | 15-04-21 | 109.70 |
| 13-04-23 | 125.10 | 14-04-29 | 139.80 | 15-04-28 | 111.40 |
| 13-04-30 | 126.30 | 14-05-06 | 136.90 | 15-05-05 | 114.50 |
| 13-05-07 | 126.00 | 14-05-13 | 135.70 | 15-05-12 | 113.00 |
| 13-05-14 | 129.30 | 14-05-20 | 136.00 | 15-05-19 | 113.60 |
| 13-05-21 | 131.40 | 14-05-27 | 136.80 | 15-05-26 | 117.40 |
| 13-05-28 | 132.90 | 14-06-03 | 137.40 | 15-06-02 | 119.00 |
| 13-06-04 | 131.10 | 14-06-10 | 138.10 | 15-06-09 | 118.20 |
| 13-06-11 | 132.90 | 14-06-17 | 138.80 | 15-06-16 | 123.60 |
| 13-06-18 | 133.10 | 14-06-24 | 141.20 | 15-06-23 | 122.10 |
| 13-06-25 | 130.50 | 14-07-01 | 138.70 | 15-06-30 | 120.60 |
| 13-07-02 | 128.30 | 14-07-08 | 137.20 | 15-07-07 | 122.10 |
| 13-07-09 | 132.40 | 14-07-15 | 133.80 | 15-07-14 | 123.50 |
| 13-07-16 | 134.40 | 14-07-22 | 133.00 | 15-07-21 | 122.20 |
| 13-07-23 | 134.70 | 14-07-29 | 131.80 | 15-07-28 | 118.40 |
| 13-07-30 | 132.70 | 14-08-05 | 131.10 | 15-08-04 | 117.60 |
| 13-08-06 | 131.50 | 14-08-12 | 133.60 | 15-08-11 | 114.50 |
| 13-08-13 | 130.00 | 14-08-19 | 131.30 | 15-08-18 | 118.80 |
| 13-08-20 | 132.00 | 14-08-26 | 132.10 | 15-08-25 | 114.10 |
| 13-08-27 | 133.00 | 14-09-02 | 132.80 | 15-09-01 | 110.60 |
| 13-09-03 | 133.90 | 14-09-09 | 133.00 | 15-09-08 | 108.90 |
| 13-09-10 | 132.10 | 14-09-16 | 129.90 | 15-09-15 | 107.10 |
| 13-09-17 | 130.60 | 14-09-23 | 129.40 | 15-09-22 | 106.10 |
| 13-09-24 | 126.40 | 14-09-30 | 130.10 | 15-09-29 | 106.80 |
| 13-10-01 | 124.30 | 14-10-07 | 128.00 | 15-10-06 | 105.70 |
| 13-10-08 | 123.60 | 14-10-14 | 123.10 | 15-10-13 | 106.70 |
| 13-10-15 | 124.80 | 14-10-21 | 121.90 | 15-10-20 | 104.60 |
| 13-10-22 | 125.50 | 14-10-28 | 118.80 | 15-10-27 | 104.10 |
| 13-10-29 | 124.40 | 14-11-04 | 117.80 | 15-11-03 | 107.20 |
| 13-11-05 | 123.70 | 14-11-11 | 119.20 | 15-11-10 | 109.40 |
| 13-11-12 | 122.60 | 14-11-18 | 116.20 | 15-11-17 | |
| 13-11-19 | 124.60 | 14-11-25 | 114.40 | 15-11-24 | |
| 13-11-26 | 126.40 | 14-12-02 | 112.30 | 15-12-01 | |
| 13-12-03 | 125.40 | 14-12-09 | 107.20 | 15-12-08 | |
| 13-12-10 | 125.90 | 14-12-16 | 101.10 | 15-12-15 | |
| 13-12-17 | 124.50 | 14-12-23 | 99.40 | 15-12-22 | |
| 13-12-24 | 125.00 | 14-12-30 | 98.10 | 15-12-29 | |
| 13-12-31 | 128.30 |
| ¢/L | Two week average ending: 2015-11-10 | Change from: 2 weeks ago | Change from: Last Year |
|---|---|---|---|
| Gasoline | 108.3 | 4.0 | -10.2 |
| Diesel | 105.8 | 1.1 | -22.4 |
| Furnace Oil | 100.3 | 0.4 | -18.7 |
| Natural Gas Prices in $CA/GJ | |||
| Alberta (NGX) | 2.41 | -0.04 | -1.41 |
| Ontario (Dawn) | 2.88 | -0.42 | -2.08 |
Source: NRCan, Bloomberg, NGX
Note: Effective this issue, Natural Gas prices in Alberta reflect AECO prices
| 2015-11-10 | ¢/kilogram | ¢/L gasoline equivalent | ¢/L diesel equivalent |
|---|---|---|---|
| Vancouver | 115.6 | 76.2 | 75.9 |
| Edmonton | 115.0 | 75.9 | 78.7 |
| Toronto | 128.4 | 84.7 | 87.8 |
Source: ¢/kg Kent Marketing Services Limited
Recent Developments
- Canadian drilling activity forecast for 2016
In its 2016 Canadian Drilling Activity Forecast, the Petroleum Services Association of Canada expectsthat 5,150 wells will be drilled in Canada for 2016 and that 2015 will close out with an estimated 5,340 wells drilled. These estimates represent a drop in activity of over 50% from a five-year average of 11,670 wells per year being drilled before oil prices fell at the beginning of 2015.
- Conference Board of Canada report forecasts significant overall losses for oil sector in 2015
On October 26, the Conference Board of Canada released its report: Canadian Industrial Outlook: Canada’s Oil Extraction Industry. According to the report, “the Canadian oil extraction industry is expected to report a pre-tax loss of $2.1 billion this year, compared with a profit of $5.6 billion in 2014.” The report notes that despite low prices, investment cutbacks, and a sharp decrease in conventional drilling activity, Canadian crude oil production is expected to continue growing over the next five years, as oil sands projects require large upfront capital investments and project construction times span several years.
- Quebec’s Action Plan for Transport Electrification
On October 26, 2015, the Government of Quebec released its second five year Action Plan for the electrification of the transport sector called Propelling Quebec Forward with Electricity. The goal of the Action Plan is to reach 100 000 plug-in electric and hybrid vehicles registered in Québec in 2020 through an investment of $420 million over 5 years. Among the specific measures are plans to continue the $8,000 subsidy for the purchase of electric vehicles, the installation of 785 public-access charging stations, including 60 quick-charging stations by the end of 2016, and the addition of 1,000 vehicles to the Government’s vehicle fleet by 2020.
Retail Gasoline Overview
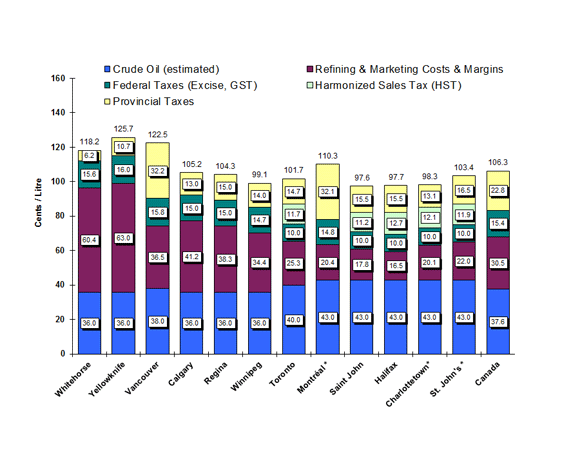
For the period ending November 10, 2015, the four-week average regular gasoline pump price in selected cities across Canada increased by 1 cents to $1.06 per litre, compared to the previous report of October 30, 2015. Compared to the same period in 2014, the average Canadian pump price is 13 cents per litre lower.
The four-week average crude oil price component of gasoline decreased by 0.3 cents, averaging 37.6 cents per litre over the four-week period. This is 22 cents per litre lower than this time last year.
Retail gasoline prices in Western centres decreased by less than 1 cent per litre compared to the previous report and ranged from $0.99 per litre to $1.23 per litre. Prices in Eastern cities were unchanged and ranged from $0.98 to $1.10 per litre.
At the national level, refining and marketing costs and margins were 30.5 cents per litre, 1.2 cents higher compared to the previous report and 9 cents higher than the same time last year.
Figure 3: Regular Gasoline Pump Prices in Selected Cities Four-Week Average (October 20 to November 10, 2015)
Text version
Figure 3
This graph shows the gasoline price components for 2 territories and 10 cities plus the national average.
Note that effective this report, transportation costs are included in the crude oil estimate for Vancouver (2 cents), Toronto (4 cents) and Eastern Canada (3 cents)
| Whitehorse | Yellowknife | Vancouver | Calgary | Regina | Winnipeg | Toronto | Montreal* | Saint John* | Halifax* | Charlottetown* | St. John's* | Canada | |
|---|---|---|---|---|---|---|---|---|---|---|---|---|---|
| Pump Price | 118.2 | 125.7 | 122.5 | 105.2 | 104.3 | 99.1 | 101.7 | 110.3 | 97.6 | 97.7 | 98.3 | 103.4 | 106.3 |
| Crude (est.) | 36.0 | 36.0 | 38.0 | 36.0 | 36.0 | 36.0 | 40.0 | 43.0 | 43.0 | 43.0 | 43.0 | 43.0 | 37.6 |
| Federal Taxes | 15.6 | 16.0 | 15.8 | 15.0 | 15.0 | 14.7 | 10.0 | 14.8 | 10.0 | 10.0 | 10.0 | 10.0 | 15.4 |
| Provincial Tax | 6.2 | 10.7 | 32.2 | 13.0 | 15.0 | 14.0 | 14.7 | 32.1 | 15.5 | 15.5 | 13.1 | 16.5 | 22.8 |
| HST | 11.7 | 11.2 | 12.7 | 12.1 | 11.9 | ||||||||
| Refining & Marketing Costs & Margins | 60.4 | 63.0 | 36.5 | 41.2 | 38.3 | 34.4 | 25.3 | 20.4 | 17.8 | 16.5 | 20.1 | 22.0 | 30.5 |
Source: NRCan
* Regulated Markets
Note: Transportation costs are included in the crude oil estimate for Vancouver ($2.20), Toronto ($4.50) and Eastern Canada ($3.40) all prices in USD.
Wholesale Gasoline Prices
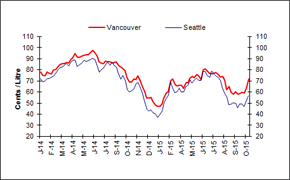
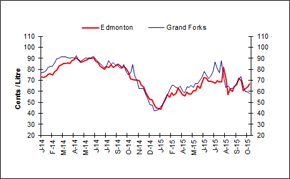
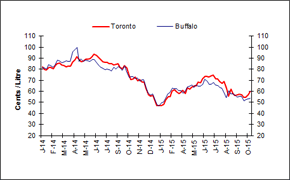
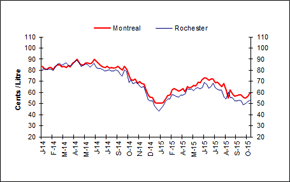
For the two-week period ending November 5, 2015, wholesale gasoline prices in selected Canadian and U.S. cities increased except in Grand Forks, North Dakota. Prices were up especially in Vancouver (21 percent increase) and in Seattle, Washington (21 percent increase).
Wholesale gasoline prices for the two week period averaged between 51 and 72 cents per litre. This is lower than the previous two week period, where prices were in the 47 to 62 cents per litre range.
In Western Cities, prices increased between 5 cents and nearly 13 cents per litre, except in Grand Forks where prices decreased slightly. Overall, prices in these markets ranged between 67 to 72 cents per litre.
Price changes in Eastern markets of Canada and the U.S. ranged between an increase of less than 1 cent to an increase of 5 cents per litre ending in the 51 to 59 cents per litre range.
Overall, prices have been trending upwards over the last four weeks. However, prices are between 7 and 19 cents per litre lower than in the same period last year, except for Vancouver where prices were higher than a year ago.
 |
 |
|
 |
 |
|
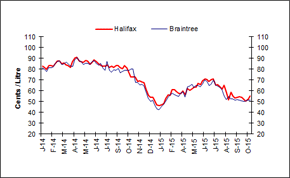 |
Text version
Figure 4
This graph shows the trend in wholesale gasoline prices for selected centres in Canada and the U.S.
| DATE | Halifax | Braintree | Montreal | Rochester | Toronto | Buffalo | Edmonton | Grand Forks | Vancouver | Seattle |
|---|---|---|---|---|---|---|---|---|---|---|
| Thu 02-Jan-14 | 83.00 | 81.60 | 83.90 | 81.26 | 82.40 | 81.49 | 72.90 | 77.05 | 77.80 | 72.33 |
| Thu 09-Jan-14 | 81.80 | 79.89 | 81.30 | 81.25 | 80.00 | 81.12 | 72.60 | 77.50 | 75.40 | 69.37 |
| Thu 16-Jan-14 | 79.90 | 78.10 | 80.80 | 80.69 | 79.20 | 80.27 | 73.60 | 78.54 | 74.50 | 69.50 |
| Thu 23-Jan-14 | 83.30 | 81.27 | 82.50 | 80.86 | 81.50 | 84.27 | 75.20 | 81.56 | 77.80 | 72.04 |
| Thu 30-Jan-14 | 83.60 | 81.57 | 82.50 | 81.27 | 81.60 | 83.07 | 75.90 | 82.75 | 77.20 | 72.24 |
| Thu 06-Feb-14 | 83.00 | 81.77 | 81.00 | 79.85 | 80.60 | 82.00 | 75.00 | 82.38 | 76.40 | 73.02 |
| Thu 13-Feb-14 | 85.40 | 84.58 | 83.50 | 82.68 | 83.50 | 83.54 | 77.70 | 86.24 | 79.80 | 74.26 |
| Thu 20-Feb-14 | 87.30 | 87.33 | 84.90 | 85.83 | 85.20 | 88.00 | 79.60 | 89.82 | 80.40 | 76.56 |
| Thu 27-Feb-14 | 87.60 | 87.64 | 84.60 | 86.29 | 85.70 | 87.43 | 83.00 | 89.92 | 82.60 | 80.13 |
| Thu 06-Mar-14 | 85.10 | 84.56 | 83.30 | 84.37 | 84.20 | 85.84 | 84.10 | 91.11 | 84.80 | 81.55 |
| Thu 13-Mar-14 | 85.90 | 84.97 | 83.80 | 85.80 | 83.50 | 86.75 | 85.30 | 91.48 | 85.40 | 82.23 |
| Thu 20-Mar-14 | 84.20 | 86.34 | 82.40 | 86.82 | 82.10 | 87.62 | 85.00 | 91.13 | 85.70 | 84.11 |
| Thu 27-Mar-14 | 83.40 | 84.62 | 84.00 | 84.72 | 82.80 | 87.34 | 85.90 | 90.80 | 86.80 | 85.82 |
| Thu 03-Apr-14 | 81.90 | 82.99 | 83.10 | 83.94 | 82.50 | 87.19 | 85.30 | 90.11 | 85.90 | 83.37 |
| Thu 10-Apr-14 | 86.70 | 82.53 | 86.50 | 85.36 | 86.00 | 95.70 | 88.00 | 91.01 | 89.40 | 86.71 |
| Thu 17-Apr-14 | 90.60 | 88.47 | 87.90 | 88.00 | 88.70 | 97.62 | 88.80 | 90.24 | 91.20 | 88.76 |
| Thu 24-Apr-14 | 91.30 | 91.03 | 90.10 | 89.26 | 91.40 | 99.92 | 90.50 | 92.66 | 94.50 | 88.79 |
| Thu 01-May-14 | 87.60 | 88.06 | 87.00 | 86.18 | 88.80 | 87.36 | 88.70 | 88.15 | 91.30 | 83.13 |
| Thu 08-May-14 | 86.90 | 87.20 | 84.80 | 83.61 | 86.60 | 89.49 | 86.60 | 87.11 | 91.00 | 84.56 |
| Thu 15-May-14 | 86.50 | 84.35 | 85.10 | 84.57 | 87.20 | 86.86 | 86.90 | 88.18 | 92.50 | 85.56 |
| Thu 22-May-14 | 88.30 | 85.62 | 86.70 | 85.75 | 89.30 | 88.24 | 88.30 | 90.07 | 93.20 | 88.76 |
| Thu 29-May-14 | 87.30 | 85.51 | 86.80 | 85.31 | 89.40 | 87.46 | 88.60 | 90.44 | 93.60 | 87.32 |
| Thu 05-Jun-14 | 84.80 | 84.40 | 86.10 | 82.54 | 89.80 | 86.83 | 90.60 | 89.57 | 93.60 | 88.04 |
| Thu 12-Jun-14 | 86.10 | 87.14 | 86.30 | 84.73 | 91.30 | 88.58 | 89.80 | 90.68 | 95.40 | 89.01 |
| Thu 19-Jun-14 | 88.80 | 87.87 | 89.70 | 86.27 | 93.50 | 88.82 | 90.50 | 91.88 | 97.40 | 90.68 |
| Thu 26-Jun-14 | 87.20 | 85.34 | 88.00 | 82.13 | 92.30 | 86.41 | 87.70 | 89.10 | 95.80 | 89.24 |
| Thu 03-Jul-14 | 85.20 | 83.69 | 86.20 | 81.51 | 91.00 | 83.83 | 86.10 | 87.49 | 92.60 | 84.50 |
| Thu 10-Jul-14 | 83.30 | 85.59 | 84.00 | 81.81 | 88.30 | 81.79 | 82.70 | 85.06 | 87.10 | 77.57 |
| Thu 17-Jul-14 | 83.00 | 80.56 | 83.20 | 80.28 | 87.00 | 80.73 | 81.10 | 83.27 | 85.90 | 80.33 |
| Thu 24-Jul-14 | 82.80 | 79.09 | 82.80 | 79.34 | 86.20 | 79.74 | 80.00 | 81.68 | 85.80 | 81.44 |
| Thu 31-Jul-14 | 83.80 | 87.46 | 83.40 | 80.18 | 86.40 | 80.24 | 82.20 | 83.30 | 87.80 | 84.44 |
| Thu 07-Aug-14 | 81.40 | 79.26 | 81.80 | 80.46 | 84.90 | 79.89 | 81.90 | 88.04 | 87.30 | 86.85 |
| Thu 14-Aug-14 | 82.60 | 77.16 | 82.40 | 79.65 | 84.90 | 78.55 | 84.30 | 84.66 | 87.00 | 84.17 |
| Thu 21-Aug-14 | 81.90 | 79.42 | 81.70 | 79.51 | 83.90 | 81.73 | 81.80 | 85.88 | 86.20 | 87.20 |
| Thu 28-Aug-14 | 83.10 | 78.90 | 82.80 | 80.35 | 84.40 | 80.39 | 82.90 | 83.88 | 86.70 | 83.98 |
| Thu 04-Sep-14 | 83.10 | 80.84 | 83.70 | 79.15 | 84.90 | 82.42 | 84.60 | 83.78 | 87.50 | 82.30 |
| Thu 11-Sep-14 | 81.50 | 76.41 | 81.80 | 76.36 | 81.60 | 81.51 | 83.70 | 81.38 | 84.00 | 76.59 |
| Thu 18-Sep-14 | 80.60 | 77.81 | 80.50 | 74.98 | 80.70 | 79.17 | 81.60 | 80.84 | 82.80 | 71.42 |
| Thu 25-Sep-14 | 83.60 | 78.95 | 83.50 | 80.27 | 83.20 | 82.88 | 82.40 | 84.63 | 81.10 | 74.90 |
| Thu 02-Oct-14 | 81.10 | 79.27 | 80.70 | 78.81 | 80.80 | 77.62 | 80.70 | 77.68 | 79.00 | 70.20 |
| Thu 09-Oct-14 | 76.90 | 79.26 | 76.00 | 68.83 | 75.10 | 72.60 | 76.90 | 75.00 | 73.00 | 62.09 |
| Thu 16-Oct-14 | 72.80 | 80.09 | 71.40 | 71.13 | 70.90 | 73.39 | 71.60 | 77.11 | 68.80 | 60.12 |
| Thu 23-Oct-14 | 73.00 | 79.88 | 71.20 | 68.07 | 71.40 | 73.20 | 71.00 | 84.35 | 68.90 | 61.00 |
| Thu 30-Oct-14 | 72.80 | 67.77 | 72.30 | 68.97 | 73.10 | 71.65 | 70.00 | 74.62 | 71.90 | 62.09 |
| Thu 06-Nov-14 | 68.60 | 67.60 | 68.40 | 68.48 | 69.50 | 72.40 | 70.10 | 69.67 | 71.40 | 67.60 |
| Thu 13-Nov-14 | 69.50 | 65.75 | 69.90 | 65.51 | 70.50 | 69.41 | 69.90 | 62.53 | 74.60 | 68.81 |
| Thu 20-Nov-14 | 68.20 | 65.89 | 68.10 | 64.70 | 68.40 | 70.32 | 65.70 | 62.55 | 70.30 | 64.40 |
| Thu 27-Nov-14 | 67.50 | 65.06 | 67.70 | 65.72 | 68.10 | 70.63 | 63.70 | 62.26 | 65.70 | 59.13 |
| Thu 04-Dec-14 | 61.90 | 58.14 | 62.40 | 58.98 | 62.70 | 62.97 | 59.20 | 56.59 | 60.20 | 51.92 |
| Thu 11-Dec-14 | 55.60 | 52.87 | 57.20 | 53.75 | 57.10 | 58.20 | 55.70 | 53.10 | 54.70 | 44.73 |
| Thu 18-Dec-14 | 53.90 | 50.11 | 55.60 | 52.37 | 55.80 | 56.36 | 52.20 | 48.09 | 54.70 | 42.88 |
| Thu 25-Dec-14 | 54.20 | 51.09 | 55.70 | 52.54 | 56.30 | 57.54 | 52.10 | 47.32 | 55.20 | 44.15 |
| Thu 01-Jan-15 | 50.20 | 45.88 | 51.30 | 47.82 | 51.70 | 52.04 | 47.20 | 42.25 | 51.20 | 41.16 |
| Thu 08-Jan-15 | 46.90 | 43.19 | 50.60 | 44.81 | 47.30 | 48.09 | 45.00 | 42.87 | 48.50 | 40.72 |
| Thu 15-Jan-15 | 46.60 | 42.30 | 50.30 | 43.50 | 47.20 | 46.68 | 44.20 | 43.28 | 47.00 | 37.04 |
| Thu 22-Jan-15 | 47.20 | 45.26 | 50.50 | 45.67 | 47.20 | 49.64 | 43.90 | 45.92 | 47.00 | 39.15 |
| Thu 29-Jan-15 | 48.20 | 47.00 | 51.00 | 48.37 | 48.00 | 50.44 | 48.40 | 48.80 | 48.80 | 42.85 |
| Thu 05-Feb-15 | 52.90 | 50.65 | 54.60 | 51.75 | 52.20 | 54.13 | 52.10 | 53.44 | 54.60 | 50.12 |
| Thu 12-Feb-15 | 56.20 | 53.56 | 57.40 | 54.19 | 55.40 | 57.51 | 56.70 | 56.48 | 59.40 | 53.76 |
| Thu 19-Feb-15 | 55.60 | 55.91 | 57.70 | 54.23 | 55.40 | 58.78 | 54.70 | 60.87 | 60.40 | 57.33 |
| Thu 26-Feb-15 | 60.80 | 57.71 | 62.30 | 58.17 | 60.20 | 62.69 | 58.60 | 65.23 | 70.30 | 68.96 |
| Thu 05-Mar-15 | 61.20 | 56.75 | 63.80 | 57.62 | 61.20 | 62.49 | 56.30 | 65.32 | 71.60 | 63.08 |
| Thu 12-Mar-15 | 59.30 | 55.45 | 62.70 | 56.74 | 62.36 | 62.36 | 58.20 | 63.71 | 66.40 | 59.34 |
| Thu 19-Mar-15 | 57.90 | 54.71 | 61.40 | 55.89 | 58.30 | 60.60 | 63.00 | 63.29 | 65.20 | 59.76 |
| Thu 26-Mar-15 | 58.10 | 58.24 | 62.00 | 57.84 | 58.90 | 60.60 | 60.10 | 64.71 | 66.30 | 63.29 |
| Thu 02-Apr-15 | 59.60 | 58.97 | 63.70 | 57.44 | 60.80 | 58.31 | 57.10 | 59.91 | 66.20 | 59.80 |
| Thu 09-Apr-15 | 59.60 | 54.12 | 60.70 | 58.63 | 57.80 | 60.01 | 55.90 | 58.28 | 63.30 | 59.94 |
| Thu 16-Apr-15 | 62.10 | 63.74 | 65.30 | 63.38 | 63.10 | 63.81 | 59.20 | 63.94 | 68.60 | 64.41 |
| Thu 23-Apr-15 | 60.70 | 64.33 | 64.20 | 62.59 | 62.20 | 64.43 | 57.80 | 63.33 | 68.60 | 66.20 |
| Thu 30 Apr-15 | 61.70 | 65.85 | 64.70 | 63.49 | 63.50 | 65.56 | 57.40 | 65.51 | 72.60 | 70.92 |
| Thu 7 May-15 | 63.50 | 63.07 | 66.60 | 61.79 | 65.20 | 63.39 | 60.20 | 63.71 | 73.80 | 67.87 |
| Thu 14 May-15 | 63.30 | 65.00 | 66.20 | 64.04 | 65.20 | 65.64 | 60.70 | 66.92 | 72.90 | 70.76 |
| Thu 21-May-15 | 66.80 | 64.92 | 69.10 | 64.28 | 68.40 | 64.92 | 65.00 | 67.13 | 75.70 | 72.83 |
| Thu 28-May-15 | 65.70 | 63.55 | 68.50 | 63.23 | 67.90 | 64.52 | 62.90 | 69.68 | 74.60 | 70.32 |
| Thu 04-Jun-15 | 69.00 | 66.58 | 71.90 | 64.27 | 71.40 | 66.25 | 68.20 | 72.51 | 71.20 | 70.54 |
| Thu 11-Jun-15 | 71.00 | 69.89 | 73.30 | 69.08 | 73.70 | 71.22 | 72.40 | 78.00 | 79.90 | 78.13 |
| Thu 18-Jun-15 | 70.30 | 68.14 | 72.70 | 67.49 | 73.80 | 69.44 | 71.70 | 74.98 | 81.20 | 78.24 |
| Thu 25-Jun-15 | 68.90 | 65.15 | 71.20 | 64.18 | 72.90 | 66.12 | 69.00 | 71.60 | 78.60 | 75.15 |
| Thu 02-Jul-15 | 70.50 | 65.89 | 72.40 | 65.23 | 74.20 | 66.54 | 68.90 | 73.39 | 76.80 | 73.39 |
| Thu 9-Jul-15 | 72.30 | 69.94 | 73.70 | 68.60 | 74.70 | 68.26 | 77.90 | 78.01 | 77.80 | 79.02 |
| Thu 16-Jul-15 | 65.40 | 65.29 | 68.50 | 64.60 | 71.10 | 65.97 | 67.40 | 86.48 | 77.10 | 76.57 |
| Thu 23-Jul-15 | 65.80 | 64.02 | 69.30 | 62.65 | 71.50 | 65.40 | 69.90 | 81.58 | 77.60 | 74.35 |
| Thu 30-Jul-15 | 63.80 | 63.32 | 67.20 | 62.28 | 69.20 | 63.66 | 68.50 | 77.08 | 75.60 | 72.95 |
| Thu 06-Aug-15 | 61.80 | 58.98 | 65.60 | 59.33 | 67.40 | 61.06 | 68.60 | 75.98 | 73.50 | 65.57 |
| Thu 13-Aug-15 | 64.90 | 61.15 | 68.10 | 61.84 | 69.10 | 62.88 | 81.80 | 87.41 | 74.20 | 69.79 |
| Thu 20-Aug-15 | 58.20 | 54.94 | 61.90 | 55.63 | 62.50 | 58.05 | 71.10 | 72.56 | 70.60 | 63.58 |
| Thu 27-Aug-15 | 51.80 | 52.64 | 55.30 | 54.73 | 55.50 | 54.73 | 56.70 | 64.15 | 62.30 | 58.92 |
| Thu 03-Sep-15 | 58.60 | 55.09 | 62.50 | 60.67 | 62.30 | 60.67 | 62.20 | 64.51 | 64.80 | 55.44 |
| Thu 10-Sep-15 | 55.40 | 52.73 | 58.70 | 55.18 | 58.00 | 57.62 | 59.80 | 62.51 | 59.50 | 48.89 |
| Thu 17-Sep-15 | 53.30 | 51.21 | 56.70 | 52.25 | 56.10 | 56.43 | 64.20 | 64.44 | 58.00 | 50.51 |
| Thu 24-Sep-15 | 54.10 | 51.85 | 57.10 | 52.20 | 56.70 | 55.02 | 66.20 | 67.01 | 60.50 | 49.73 |
| Thu 01-Oct-15 | 54.70 | 51.42 | 57.80 | 53.17 | 57.50 | 55.27 | 71.80 | 71.36 | 58.20 | 45.83 |
| Thu 08-Oct-15 | 54.00 | 50.55 | 58.00 | 52.62 | 57.10 | 55.71 | 69.90 | 73.59 | 58.80 | 49.18 |
| Thu 15-Oct-15 | 52.00 | 50.11 | 55.50 | 48.75 | 54.60 | 51.47 | 60.70 | 64.09 | 59.80 | 49.09 |
| Thu 22-Oct-15 | 50.60 | 50.83 | 55.20 | 50.13 | 54.50 | 52.55 | 62.00 | 59.81 | 59.30 | 47.02 |
| Thu 29-Oct-15 | 52.50 | 51.14 | 56.90 | 51.84 | 56.60 | 52.88 | 63.80 | 59.84 | 63.00 | 52.54 |
| Thu 05-Nov-15 | 55.20 | 51.13 | 59.50 | 52.87 | 59.70 | 53.57 | 66.50 | 58.09 | 71.90 | 56.70 |
Sources: NRCan, Bloomberg Oil Buyers Guide
Gasoline Refining and Marketing Margins
Four-week rolling averages are used for gasoline refining and marketing margins.
These gasoline refining margins refer to the difference between the cost of crude oil and the wholesale price at which the refiner can sell gasoline. The margin includes the cost associated with refining the product as well as a profit for the refiner.
The gasoline marketing margins represent the difference between the wholesale and retail prices of gasoline. This margin pays for the costs associated with operating a service station.
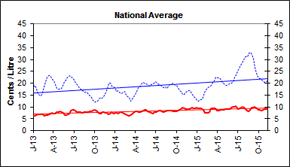
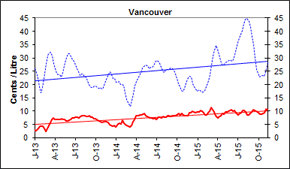
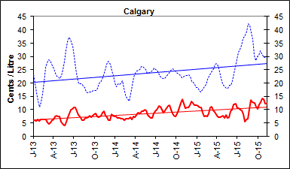
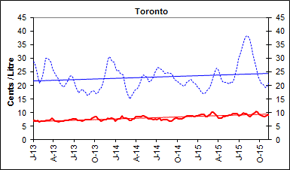
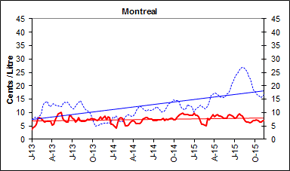
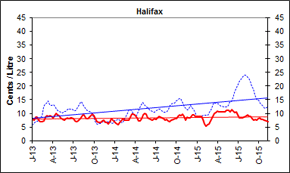
Gasoline refining margins have been trending downwards over recent weeks in all of the major Canadian markets shown below.
Nationally, the four-week rolling average ending November 10, 2015 was 21.4 cents per litre, an increase of approximately 1 cent over the past two weeks. Compared to the same time last year, margins in Canada are 5 cents per litre higher.
Canadian marketing margins have been fairly stable over the past two weeks, averaging almost 9 cents per litre.
 |
 |
|
 |
 |
|
 |
 |
Text version
Figure 5
These graphs show the trend in refining and marketing costs and margins for selected centres in Canada and the national average.
| 4-week rolling average | Canada | Vancouver | Calgary | Toronto | Montreal | Halifax | ||||||
|---|---|---|---|---|---|---|---|---|---|---|---|---|
| Marketing Margin | Refining Margin | Marketing Margin | Refining Margin | Marketing Margin | Refining Margin | Marketing Margin | Refining Margin | Marketing Margin | Refining Margin | Marketing Margin | Refining Margin | |
| 2013-01-01 | 6.2 | 18.6 | 2.8 | 25.9 | 6.1 | 23.1 | 7.1 | 28.9 | 3.6 | 7.3 | 7.7 | 5.6 |
| 2013-01-08 | 6.4 | 19.0 | 2.7 | 24.5 | 6.0 | 19.8 | 7.1 | 27.6 | 4.4 | 8.0 | 7.5 | 6.6 |
| 2013-01-15 | 6.5 | 17.5 | 3.5 | 22.2 | 5.9 | 16.3 | 6.8 | 25.5 | 4.6 | 8.2 | 8.5 | 7.2 |
| 2013-01-22 | 6.9 | 15.6 | 4.4 | 20.2 | 6.3 | 14.3 | 7.0 | 23.9 | 5.5 | 8.3 | 8.5 | 7.6 |
| 2013-01-29 | 6.9 | 15.0 | 4.2 | 16.8 | 5.8 | 11.0 | 6.5 | 20.7 | 7.7 | 8.4 | 7.6 | 7.9 |
| 2013-02-05 | 7.0 | 14.6 | 4.2 | 18.2 | 6.4 | 12.3 | 6.8 | 21.1 | 8.1 | 9.5 | 7.1 | 9.2 |
| 2013-02-12 | 6.8 | 16.2 | 3.4 | 22.2 | 6.4 | 16.1 | 6.9 | 23.6 | 7.8 | 9.4 | 7.1 | 9.1 |
| 2013-02-19 | 6.4 | 18.5 | 2.4 | 25.6 | 6.2 | 19.9 | 6.8 | 25.7 | 7.0 | 11.0 | 7.4 | 10.8 |
| 2013-02-26 | 6.6 | 20.8 | 3.4 | 31.1 | 6.3 | 26.0 | 7.0 | 30.0 | 6.3 | 13.7 | 8.6 | 13.6 |
| 2013-03-05 | 6.7 | 22.7 | 4.7 | 32.0 | 5.2 | 27.8 | 7.0 | 30.1 | 6.7 | 13.9 | 9.3 | 14.0 |
| 2013-03-12 | 6.8 | 23.3 | 5.8 | 32.1 | 4.7 | 28.9 | 7.1 | 29.7 | 6.8 | 14.3 | 9.0 | 14.6 |
| 2013-03-19 | 7.2 | 23.1 | 7.0 | 31.5 | 5.1 | 29.1 | 7.4 | 29.4 | 6.8 | 12.3 | 9.1 | 12.8 |
| 2013-03-26 | 7.5 | 21.7 | 7.3 | 27.8 | 6.0 | 26.5 | 7.8 | 26.4 | 6.7 | 12.3 | 9.0 | 12.9 |
| 2013-04-02 | 7.1 | 20.9 | 6.9 | 26.5 | 6.4 | 25.8 | 7.5 | 25.6 | 5.2 | 12.6 | 8.4 | 12.9 |
| 2013-04-09 | 7.3 | 19.4 | 6.8 | 24.2 | 7.4 | 23.6 | 6.8 | 24.1 | 5.7 | 13.2 | 9.2 | 12.6 |
| 2013-04-16 | 7.8 | 17.9 | 6.9 | 22.7 | 7.7 | 21.6 | 6.7 | 22.2 | 7.2 | 11.6 | 10.1 | 10.5 |
| 2013-04-23 | 7.9 | 17.6 | 7.0 | 23.6 | 7.3 | 22.4 | 6.6 | 22.5 | 8.4 | 12.6 | 9.5 | 11.1 |
| 2013-04-30 | 8.2 | 17.6 | 7.2 | 24.1 | 7.4 | 22.9 | 6.8 | 22.2 | 9.5 | 12.2 | 9.2 | 10.6 |
| 2013-05-07 | 7.8 | 17.9 | 6.8 | 24.4 | 5.6 | 23.0 | 6.9 | 20.1 | 9.9 | 12.1 | 8.3 | 10.3 |
| 2013-05-14 | 7.4 | 19.2 | 6.7 | 27.0 | 4.4 | 25.1 | 6.9 | 19.3 | 10.2 | 12.4 | 7.8 | 10.2 |
| 2013-05-21 | 6.6 | 20.7 | 6.3 | 29.2 | 4.1 | 28.2 | 7.0 | 19.6 | 7.7 | 13.4 | 7.6 | 10.7 |
| 2013-05-28 | 6.7 | 21.3 | 6.3 | 31.3 | 5.4 | 32.2 | 7.0 | 20.8 | 6.9 | 13.8 | 8.1 | 10.9 |
| 2013-06-04 | 7.0 | 22.6 | 6.6 | 31.4 | 7.2 | 35.6 | 7.2 | 22.0 | 6.3 | 13.7 | 8.4 | 11.2 |
| 2013-06-11 | 7.3 | 23.3 | 6.8 | 29.9 | 8.5 | 36.8 | 7.2 | 22.9 | 6.4 | 13.9 | 8.1 | 11.8 |
| 2013-06-18 | 8.5 | 22.7 | 7.5 | 29.4 | 9.9 | 36.5 | 7.4 | 23.5 | 9.0 | 13.0 | 8.2 | 11.5 |
| 2013-10-22 | 7.3 | 13.2 | 5.9 | 18.8 | 7.3 | 20.0 | 7.4 | 18.8 | 6.9 | 5.1 | 6.8 | 6.3 |
| 2013-10-29 | 7.3 | 13.9 | 5.7 | 18.1 | 7.8 | 20.1 | 6.9 | 19.1 | 7.6 | 5.1 | 6.7 | 6.3 |
| 2013-11-05 | 7.8 | 13.6 | 5.9 | 18.8 | 8.9 | 21.3 | 7.2 | 20.8 | 8.4 | 5.7 | 7.3 | 6.9 |
| 2013-11-12 | 7.8 | 14.5 | 6.0 | 18.5 | 9.5 | 21.2 | 7.4 | 21.2 | 7.6 | 6.0 | 7.4 | 7.0 |
| 2013-11-19 | 7.6 | 16.2 | 6.1 | 21.9 | 7.7 | 24.7 | 7.3 | 25.6 | 8.3 | 5.9 | 6.6 | 7.0 |
| 2013-11-26 | 7.6 | 17.8 | 5.8 | 23.7 | 7.2 | 26.9 | 7.9 | 28.3 | 8.8 | 6.8 | 6.6 | 7.8 |
| 2013-12-03 | 7.0 | 19.9 | 4.9 | 24.8 | 6.1 | 28.1 | 7.7 | 30.5 | 7.3 | 5.9 | 6.1 | 6.9 |
| 2013-12-10 | 7.3 | 20.2 | 4.5 | 24.3 | 6.1 | 27.8 | 7.9 | 30.9 | 8.3 | 6.2 | 6.9 | 7.0 |
| 2013-12-17 | 7.8 | 18.9 | 4.3 | 22.2 | 8.2 | 24.6 | 7.8 | 28.9 | 8.0 | 6.1 | 8.0 | 6.4 |
| 2013-12-24 | 7.2 | 18.4 | 4.7 | 22.3 | 7.6 | 22.9 | 7.7 | 28.5 | 5.6 | 6.8 | 7.6 | 6.5 |
| 2013-12-31 | 7.5 | 18.1 | 4.0 | 21.0 | 7.5 | 20.0 | 6.8 | 26.3 | 5.6 | 8.2 | 6.9 | 7.3 |
| 2014-01-07 | 7.7 | 16.4 | 5.2 | 20.8 | 7.6 | 18.6 | 7.4 | 25.3 | 4.7 | 8.1 | 6.3 | 7.4 |
| 2014-01-14 | 7.3 | 16.7 | 5.5 | 21.2 | 6.8 | 19.7 | 7.6 | 25.6 | 4.1 | 8.7 | 5.8 | 8.1 |
| 2014-01-21 | 7.9 | 16.3 | 5.2 | 20.1 | 7.0 | 19.4 | 7.6 | 24.3 | 6.4 | 8.1 | 6.6 | 7.7 |
| 2014-01-28 | 7.9 | 15.6 | 6.6 | 20.1 | 6.7 | 20.1 | 8.7 | 24.1 | 7.8 | 6.9 | 7.4 | 6.7 |
| 2014-02-04 | 7.6 | 16.1 | 5.5 | 20.0 | 6.7 | 21.3 | 8.0 | 24.2 | 8.2 | 6.5 | 8.1 | 6.7 |
| 2014-02-11 | 7.3 | 16.4 | 5.0 | 16.9 | 6.1 | 18.0 | 8.0 | 20.7 | 7.8 | 6.5 | 7.6 | 7.3 |
| 2014-02-18 | 7.0 | 15.0 | 4.6 | 16.4 | 6.7 | 17.7 | 7.9 | 20.3 | 6.6 | 7.2 | 7.6 | 8.7 |
| 2014-02-25 | 6.5 | 14.3 | 4.3 | 12.5 | 6.5 | 14.3 | 7.8 | 16.8 | 5.1 | 8.2 | 7.4 | 10.2 |
| 2014-03-04 | 6.3 | 14.1 | 4.0 | 11.8 | 6.7 | 13.3 | 7.2 | 15.0 | 5.0 | 9.1 | 7.4 | 11.6 |
| 2014-03-11 | 6.7 | 12.6 | 4.7 | 14.0 | 7.3 | 16.0 | 7.1 | 16.0 | 5.3 | 9.1 | 8.8 | 11.2 |
| 2014-03-18 | 7.1 | 13.3 | 5.9 | 15.3 | 6.5 | 17.9 | 7.6 | 15.7 | 6.3 | 8.5 | 9.6 | 10.4 |
| 2014-03-25 | 7.7 | 14.3 | 6.8 | 19.7 | 7.4 | 22.1 | 7.8 | 18.0 | 6.6 | 8.4 | 9.6 | 9.7 |
| 2014-04-01 | 8.1 | 15.1 | 8.3 | 21.5 | 7.3 | 24.1 | 8.4 | 18.9 | 7.0 | 8.4 | 9.4 | 8.7 |
| 2014-04-08 | 8.1 | 16.6 | 8.3 | 22.4 | 8.1 | 24.5 | 8.5 | 19.0 | 6.8 | 9.5 | 8.4 | 9.3 |
| 2014-04-15 | 7.8 | 18.2 | 8.5 | 23.7 | 9.0 | 24.9 | 8.4 | 20.3 | 5.8 | 11.1 | 7.1 | 11.0 |
| 2014-04-22 | 7.8 | 18.9 | 8.6 | 24.4 | 8.5 | 25.2 | 8.6 | 21.3 | 5.7 | 11.5 | 7.2 | 12.1 |
| 2014-04-29 | 8.0 | 20.0 | 8.7 | 26.0 | 9.3 | 26.1 | 8.7 | 23.0 | 5.9 | 12.2 | 8.2 | 13.2 |
| 2014-05-06 | 8.4 | 20.3 | 9.0 | 26.7 | 9.6 | 26.3 | 8.8 | 23.7 | 6.4 | 12.3 | 9.4 | 14.0 |
| 2014-05-13 | 8.7 | 19.8 | 8.4 | 27.4 | 9.9 | 26.0 | 8.5 | 23.5 | 7.4 | 11.5 | 10.0 | 13.3 |
| 2014-05-20 | 8.6 | 19.6 | 8.1 | 27.2 | 9.7 | 25.2 | 8.2 | 22.9 | 8.0 | 11.0 | 9.6 | 12.3 |
| 2014-05-27 | 8.0 | 19.4 | 7.7 | 27.2 | 7.9 | 24.8 | 7.8 | 22.5 | 8.0 | 10.8 | 8.4 | 12.1 |
| 2014-06-03 | 7.7 | 18.8 | 7.4 | 26.4 | 7.4 | 23.9 | 7.7 | 21.4 | 8.1 | 10.6 | 8.1 | 11.3 |
| 2014-06-10 | 7.4 | 19.4 | 7.3 | 26.4 | 6.9 | 24.3 | 7.6 | 22.0 | 7.7 | 11.2 | 7.8 | 11.3 |
| 2014-06-17 | 7.3 | 19.8 | 7.1 | 26.9 | 6.8 | 24.7 | 7.3 | 23.0 | 7.6 | 10.8 | 7.7 | 10.7 |
| 2014-06-24 | 7.8 | 19.9 | 7.3 | 28.5 | 8.6 | 25.7 | 7.7 | 24.8 | 7.6 | 11.0 | 8.0 | 10.5 |
| 2014-07-01 | 7.8 | 20.7 | 6.9 | 29.1 | 9.3 | 25.1 | 7.3 | 25.8 | 6.9 | 11.3 | 7.8 | 10.7 |
| 2014-07-08 | 8.2 | 20.0 | 7.7 | 28.0 | 10.0 | 24.0 | 7.7 | 25.6 | 7.1 | 10.8 | 8.2 | 10.3 |
| 2014-07-15 | 8.6 | 19.4 | 7.6 | 27.9 | 11.4 | 23.8 | 7.8 | 26.4 | 6.9 | 12.2 | 8.9 | 11.6 |
| 2014-07-22 | 8.4 | 19.0 | 7.3 | 26.2 | 11.2 | 22.4 | 7.1 | 25.6 | 7.2 | 11.6 | 8.7 | 11.3 |
| 2014-07-29 | 8.3 | 18.4 | 7.9 | 25.1 | 9.9 | 22.0 | 7.4 | 25.2 | 7.1 | 11.1 | 8.3 | 11.0 |
| 2014-08-05 | 7.9 | 18.2 | 7.6 | 24.6 | 8.9 | 21.6 | 7.2 | 24.4 | 7.2 | 10.4 | 8.1 | 10.4 |
| 2014-08-12 | 8.0 | 18.4 | 8.1 | 25.1 | 9.7 | 21.8 | 7.3 | 24.4 | 7.8 | 10.3 | 7.6 | 10.5 |
| 2014-08-19 | 8.6 | 17.8 | 8.3 | 25.2 | 10.5 | 22.3 | 7.3 | 24.2 | 7.0 | 10.1 | 7.8 | 10.4 |
| 2014-08-26 | 8.6 | 18.6 | 8.1 | 25.9 | 11.4 | 23.4 | 6.9 | 24.5 | 7.5 | 11.3 | 7.2 | 11.6 |
| 2014-09-02 | 8.4 | 19.5 | 7.9 | 26.6 | 11.8 | 24.5 | 6.8 | 24.7 | 7.4 | 12.2 | 7.0 | 12.5 |
| 2014-09-09 | 8.5 | 19.6 | 7.6 | 26.4 | 10.1 | 25.2 | 7.1 | 24.1 | 7.6 | 13.4 | 7.5 | 13.3 |
| 2014-09-16 | 8.0 | 20.1 | 8.2 | 25.4 | 8.5 | 25.4 | 7.6 | 22.9 | 7.7 | 13.4 | 7.8 | 13.3 |
| 2014-09-23 | 8.2 | 19.3 | 8.3 | 24.1 | 7.8 | 24.8 | 8.0 | 21.8 | 7.8 | 13.8 | 8.1 | 13.7 |
| 2014-09-30 | 8.1 | 19.2 | 8.6 | 22.2 | 7.5 | 24.4 | 7.9 | 21.6 | 7.3 | 14.3 | 8.0 | 14.2 |
| 2014-10-07 | 8.4 | 18.1 | 9.2 | 20.2 | 9.2 | 23.7 | 7.6 | 20.8 | 7.2 | 14.5 | 8.9 | 14.9 |
| 2014-10-14 | 8.8 | 17.0 | 8.6 | 17.9 | 11.0 | 22.1 | 7.7 | 19.2 | 8.0 | 13.2 | 9.6 | 13.9 |
| 2014-10-21 | 9.2 | 15.7 | 9.2 | 17.7 | 12.4 | 23.0 | 7.7 | 20.4 | 8.8 | 14.5 | 9.3 | 15.4 |
| 2014-10-28 | 9.6 | 13.4 | 8.5 | 16.5 | 13.8 | 21.1 | 8.0 | 18.8 | 9.2 | 12.5 | 9.6 | 13.5 |
| 2014-11-04 | 9.3 | 15.2 | 8.1 | 18.5 | 12.3 | 22.2 | 8.4 | 19.9 | 9.4 | 11.5 | 8.9 | 12.3 |
| 2014-11-11 | 9.2 | 16.2 | 8.3 | 19.7 | 10.5 | 21.9 | 8.7 | 20.2 | 9.9 | 10.6 | 7.5 | 11.1 |
| 2014-11-18 | 9.2 | 16.4 | 8.4 | 22.4 | 10.7 | 22.9 | 8.8 | 21.4 | 9.1 | 11.0 | 8.5 | 11.3 |
| 2014-11-25 | 9.2 | 16.8 | 9.4 | 22.7 | 10.9 | 22.7 | 8.7 | 21.4 | 9.4 | 10.8 | 8.3 | 11.0 |
| 2014-12-02 | 9.4 | 16.8 | 9.4 | 22.9 | 11.8 | 22.4 | 8.8 | 22.2 | 9.1 | 13.1 | 8.5 | 12.9 |
| 2014-12-09 | 9.7 | 15.7 | 9.9 | 19.4 | 13.2 | 19.6 | 8.8 | 20.1 | 8.9 | 11.5 | 9.4 | 11.1 |
| 2014-12-16 | 9.5 | 14.2 | 9.5 | 19.2 | 12.5 | 20.2 | 8.5 | 20.9 | 9.1 | 12.5 | 9.3 | 11.7 |
| 2014-12-23 | 9.4 | 13.8 | 9.5 | 18.3 | 11.8 | 19.4 | 8.8 | 20.1 | 9.1 | 11.9 | 9.0 | 10.4 |
| 2014-12-30 | 9.6 | 12.9 | 9.8 | 17.5 | 11.8 | 18.4 | 8.9 | 19.0 | 9.7 | 10.3 | 9.0 | 8.9 |
| 2015-01-06 | 9.4 | 12.5 | 9.7 | 18.1 | 11.3 | 18.3 | 9.1 | 18.9 | 8.8 | 11.2 | 9.0 | 9.0 |
| 2015-01-13 | 9.6 | 13.0 | 10.1 | 17.6 | 10.7 | 17.1 | 9.4 | 17.8 | 8.9 | 11.6 | 9.0 | 8.9 |
| 2015-01-20 | 9.5 | 12.9 | 9.9 | 17.1 | 10.9 | 16.7 | 9.4 | 17.1 | 8.3 | 12.1 | 8.8 | 9.0 |
| 2015-01-27 | 8.7 | 13.9 | 9.4 | 17.2 | 8.9 | 17.4 | 9.3 | 17.0 | 7.0 | 12.7 | 7.9 | 9.2 |
| 2015-02-03 | 7.6 | 16.1 | 8.6 | 18.9 | 7.5 | 19.3 | 8.5 | 18.3 | 5.7 | 14.0 | 6.1 | 11.0 |
| 2015-02-10 | 7.5 | 17.2 | 8.6 | 19.3 | 7.6 | 19.6 | 8.6 | 18.0 | 5.5 | 11.8 | 5.4 | 9.4 |
| 2015-02-17 | 7.6 | 18.0 | 9.3 | 21.9 | 7.6 | 21.9 | 9.0 | 19.4 | 5.3 | 12.5 | 5.8 | 10.6 |
| 2015-02-24 | 7.8 | 18.5 | 10.1 | 23.7 | 8.6 | 22.5 | 9.3 | 20.0 | 5.0 | 12.0 | 6.2 | 10.4 |
| 2015-03-03 | 9.5 | 19.1 | 11.3 | 27.3 | 10.8 | 23.7 | 10.2 | 21.7 | 7.7 | 13.2 | 7.7 | 11.6 |
| 2015-03-10 | 9.5 | 20.2 | 10.5 | 30.6 | 11.0 | 24.4 | 10.1 | 23.6 | 7.3 | 14.5 | 8.9 | 12.6 |
| 2015-03-17 | 9.4 | 20.9 | 9.7 | 32.1 | 9.7 | 24.7 | 9.6 | 24.4 | 8.3 | 15.8 | 9.9 | 13.4 |
| 2015-03-24 | 9.5 | 22.6 | 8.2 | 34.7 | 9.2 | 27.1 | 8.6 | 26.2 | 9.2 | 16.8 | 10.3 | 13.9 |
| 2015-03-31 | 8.6 | 22.3 | 7.5 | 33.3 | 7.6 | 27.3 | 8.0 | 25.7 | 8.4 | 17.3 | 10.9 | 13.9 |
| 2015-04-07 | 8.6 | 22.4 | 7.9 | 31.2 | 7.2 | 26.5 | 7.9 | 24.4 | 9.1 | 17.2 | 10.6 | 13.4 |
| 2015-04-14 | 8.7 | 21.9 | 8.3 | 30.1 | 7.4 | 25.1 | 8.1 | 23.5 | 9.2 | 17.1 | 10.6 | 13.2 |
| 2015-04-21 | 8.6 | 20.7 | 9.2 | 27.3 | 7.5 | 21.7 | 8.5 | 21.4 | 8.7 | 16.4 | 10.6 | 12.6 |
| 2015-04-28 | 8.8 | 20.0 | 9.0 | 27.3 | 7.8 | 19.6 | 8.4 | 21.2 | 8.6 | 16.0 | 10.6 | 12.3 |
| 2015-05-05 | 9.2 | 19.6 | 9.6 | 28.2 | 6.8 | 18.9 | 8.8 | 21.2 | 8.3 | 15.7 | 10.5 | 12.4 |
| 2015-05-12 | 9.3 | 19.2 | 9.7 | 29.7 | 7.9 | 19.0 | 8.8 | 21.8 | 7.8 | 15.8 | 11.0 | 12.5 |
| 2015-05-19 | 9.2 | 19.3 | 10.0 | 29.6 | 7.0 | 18.5 | 9.1 | 21.2 | 7.9 | 16.0 | 11.1 | 12.9 |
| 2015-05-26 | 9.0 | 20.1 | 10.3 | 30.0 | 7.1 | 19.7 | 9.0 | 21.9 | 7.9 | 17.0 | 10.6 | 14.0 |
| 2015-06-02 | 9.8 | 20.0 | 10.6 | 29.1 | 9.4 | 19.5 | 9.7 | 21.3 | 8.9 | 17.1 | 11.3 | 14.1 |
| 2015-06-09 | 9.9 | 20.7 | 10.0 | 29.6 | 9.9 | 20.9 | 9.6 | 22.4 | 9.2 | 18.2 | 10.9 | 15.4 |
| 2015-06-16 | 10.2 | 22.6 | 10.1 | 30.6 | 12.0 | 23.0 | 9.6 | 23.8 | 8.9 | 20.1 | 10.2 | 17.4 |
| 2015-06-23 | 10.2 | 23.5 | 9.4 | 31.3 | 12.3 | 24.0 | 9.7 | 24.4 | 8.7 | 20.7 | 10.6 | 18.1 |
| 2015-06-30 | 9.2 | 25.0 | 8.4 | 33.6 | 10.6 | 26.9 | 8.7 | 27.4 | 7.9 | 22.5 | 9.6 | 20.2 |
| 2015-07-07 | 9.4 | 26.1 | 9.2 | 34.1 | 10.5 | 28.1 | 9.1 | 28.7 | 8.2 | 23.3 | 8.4 | 21.1 |
| 2015-07-14 | 9.6 | 27.6 | 9.2 | 37.0 | 9.8 | 30.8 | 9.4 | 32.4 | 9.1 | 23.7 | 8.4 | 21.6 |
| 2015-07-21 | 10.0 | 28.6 | 10.3 | 37.8 | 6.9 | 31.5 | 9.8 | 33.3 | 9.7 | 23.7 | 8.4 | 21.4 |
| 2015-07-28 | 9.6 | 30.0 | 10.2 | 42.8 | 8.2 | 36.5 | 9.7 | 37.6 | 9.1 | 26.6 | 8.8 | 23.9 |
| 2015-08-04 | 9.1 | 31.2 | 9.8 | 44.6 | 5.6 | 38.2 | 9.7 | 38.4 | 8.6 | 27.0 | 8.9 | 23.9 |
| 2015-08-11 | 8.5 | 31.2 | 8.7 | 44.8 | 6.2 | 39.6 | 8.8 | 38.0 | 7.5 | 26.7 | 9.3 | 23.3 |
| 2015-08-18 | 6.2 | 32.8 | 8.5 | 43.7 | 6.6 | 42.3 | 8.6 | 36.9 | 6.7 | 26.4 | 8.9 | 22.9 |
| 2015-08-25 | 6.9 | 33.0 | 9.1 | 41.4 | 10.2 | 41.6 | 9.1 | 34.6 | 6.4 | 25.1 | 8.9 | 21.6 |
| 2015-09-01 | 5.1 | 32.0 | 9.8 | 38.5 | 13.8 | 39.5 | 9.6 | 32.2 | 6.5 | 23.1 | 8.0 | 19.7 |
| 2015-09-08 | 5.2 | 30.0 | 10.4 | 36.0 | 12.8 | 37.4 | 10.0 | 30.6 | 6.2 | 22.6 | 7.4 | 19.0 |
| 2015-09-15 | 6.5 | 26.4 | 10.3 | 30.9 | 12.4 | 31.6 | 10.4 | 27.2 | 6.3 | 20.3 | 7.8 | 16.7 |
| 2015-09-22 | 6.1 | 24.0 | 10.0 | 26.0 | 11.2 | 28.7 | 10.1 | 23.6 | 7.0 | 18.6 | 7.5 | 15.0 |
| 2015-09-29 | 8.0 | 22.7 | 9.3 | 24.8 | 10.2 | 30.5 | 9.3 | 22.9 | 7.1 | 18.6 | 8.1 | 15.1 |
| 2015-10-06 | 8.2 | 22.1 | 8.7 | 23.1 | 11.9 | 30.7 | 9.2 | 21.1 | 7.3 | 16.6 | 8.3 | 13.4 |
| 2015-10-13 | 8.6 | 21.9 | 8.8 | 23.4 | 12.8 | 32.3 | 8.7 | 20.5 | 6.9 | 15.8 | 7.9 | 12.6 |
| 2015-10-20 | 8.8 | 20.9 | 9.1 | 23.4 | 14.1 | 30.9 | 8.5 | 19.8 | 6.5 | 15.9 | 7.7 | 12.6 |
| 2015-10-27 | 8.9 | 20.4 | 9.4 | 22.8 | 13.9 | 29.3 | 8.6 | 18.9 | 6.4 | 15.3 | 7.6 | 11.6 |
| 2015-11-03 | 9.0 | 20.6 | 10.8 | 24.9 | 12.3 | 29.8 | 9.0 | 19.6 | 6.9 | 16.1 | 7.2 | 12.1 |
| 2015-11-10 | 9.1 | 21.4 | 10.6 | 28.4 | 12.3 | 29.5 | 9.0 | 20.9 | 7.0 | 16.7 | 7.1 | 12.4 |
Source: NRCan
Crude Oil Overview
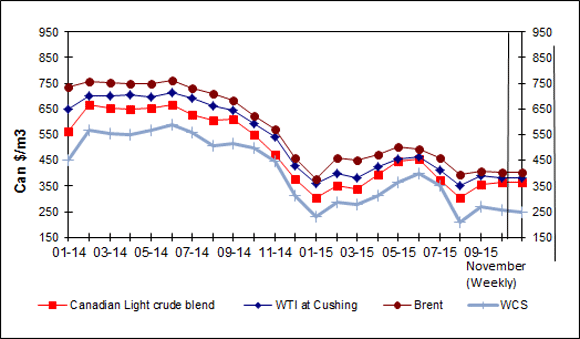
For the two weeks ending November 10, 2015, prices for the three light crude benchmarks averaged between CAD$360.15 /m3 and CAD$402.25/m3 (US$43.46 and US$48.54 per barrel).
Canadian light crude oil prices at Edmonton increased by CAD 7.64$/m3 (US$ 0.52 per barrel) from two weeks ago, West Texas Intermediate (WTI) increased by CAD$ 7.26/m3 (US$ 0.45 per barrel) and Brent increased by CAD$ 6.37/m3 (a increase of US$0.32 per barrel).
The differential between Canadian light crude and WTI for the two weeks ending November 10 was CAD $18.20/m3, (US$ 2.19 per barrel), a slight decrease from the previous two weeks where it averaged CAD $18.58/m3 (US$2.26 per barrel). Meanwhile, for the same period, the differential between Canadian light crude and Brent was CAD $42.10/m3 (US$5.08 per barrel). This differential decreased from the previous two week period where it averaged CAD $43.37/m3 (US$5.28 per barrel).
The discount for Canadian heavy oil, as measured by the Western Canadian Select (WCS) price differential to WTI averaged CAD$122.70/m3 (US $14.81 per barrel) for the two weeks ending November 10, 2015.
For the week ending October 30, the US Energy Information Administration (EIA) data showed that US crude inventories increased by 2.8 million barrels. At 482.8 million barrels, US crude oil inventories remain near record levels for this time of year.
In the U.S., gasoline stockpiles decreased by 3.3 million barrels and are above the upper limit of the average range. Distillate fuel inventories decreased by 3.0 million barrels last week but are in the average range for this time of year. EIA data showed a slight rise in US refinery utilization, with rates increasing 1.1 percentage points to 88.7%.
Figure 6: Crude Oil Price Comparisons
Text version
Figure 6
This graph shows crude oil prices for Canadian Light Sweet, WTI, Brent and WCS. The average weekly prices for the period ending November 6 , 2015, were $362.48/cubic metres, $380.71/cubic metres, $403.01/cubic metres and $248.11/cubic metres for the Canadian Light, WTI, Brent and WCS, respectively.
| Dates | (Canadian Light Sweet) | WTI | Brent | WCS |
|---|---|---|---|---|
| 01/13 | 549.97 | 592.14 | 699.83 | 387.55 |
| 02/13 | 553.76 | 605.29 | 736.06 | 370.93 |
| 03/13 | 560.66 | 598.93 | 705.36 | 430.10 |
| 04/13 | 571.20 | 590.06 | 663.78 | 441.27 |
| 05/13 | 598.81 | 608.31 | 662.59 | 519.16 |
| 06/13 | 577.25 | 630.51 | 680.52 | 489.10 |
| 07/13 | 664.03 | 685.36 | 703.73 | 592.16 |
| 08/13 | 665.21 | 697.44 | 722.47 | 595.65 |
| 09/13 | 647.06 | 691.84 | 723.16 | 543.60 |
| 10/13 | 592.41 | 655.54 | 713.92 | 483.77 |
| 11/13 | 511.65 | 620.13 | 711.21 | 413.23 |
| 12/13 | 524.69 | 655.42 | 740.65 | 394.48 |
| 01/14 | 561.87 | 651.27 | 735.43 | 452.06 |
| 02/14 | 665.35 | 699.89 | 756.56 | 566.93 |
| 03/14 | 655.67 | 701.90 | 752.47 | 554.81 |
| 04/14 | 647.62 | 704.92 | 747.57 | 550.77 |
| 05/14 | 652.85 | 697.62 | 748.13 | 566.87 |
| 06/14 | 665.50 | 715.93 | 762.22 | 589.57 |
| 07/14 | 629.45 | 690.70 | 730.08 | 558.81 |
| 08/14 | 606.25 | 660.32 | 710.46 | 507.84 |
| 09/14 | 608.92 | 644.03 | 681.65 | 515.00 |
| 10/14 | 551.84 | 594.78 | 621.20 | 497.90 |
| 11/14 | 474.20 | 540.12 | 569.75 | 447.90 |
| 12/14 | 378.11 | 430.68 | 459.36 | 313.77 |
| 01/15 | 304.92 | 359.85 | 377.71 | 232.32 |
| 02/15 | 350.67 | 399.16 | 461.37 | 287.18 |
| 03-15 | 339.32 | 379.25 | 452.57 | 269.44 |
| 04-15 | 394.52 | 422.81 | 471.56 | 313.37 |
| 05-15 | 444.34 | 455.08 | 502.89 | 387.66 |
| 06-15 | 453.67 | 444.84 | 472.46 | 377.74 |
| 07-15 | 373.96 | 411.43 | 457.53 | 353.39 |
| 08-15 | 303.26 | 351.68 | 395.72 | 210.71 |
| 09-15 | 356.80 | 389.09 | 406.85 | 267.30 |
| 10-15 | 363.10 | 380.00 | 404.44 | 258.44 |
| 06-Nov | 362.48 | 380.71 | 403.01 | 248.11 |
Sources: NRCan
| Crude Oil Types | Two- Weeks Ending: 2015-11-10 |
Change From: Two weeks prior |
Change From: Last Year |
|||
|---|---|---|---|---|---|---|
| $Can/ m3 |
$US/ bbl |
$Can/ m3 |
$US/ bbl |
$Can/ m3 |
$US/ bbl |
|
| Canadian Light | 360.15 | 43.46 | +7.64 | +0.52 | -136.89 | -26.38 |
| WTI | 378.34 | 45.65 | +7.26 | +0.45 | -184.23 | -33.04 |
| Brent | 402.25 | 48.54 | +6.37 | +0.32 | -195.64 | -35.47 |
| WCS | 255.64 | 30.85 | +3.64 | +0.15 | -193.42 | -48.17 |
Source: NRCan
Download the report
Fuel Focus - Printable Version [PDF, 326 KB]
To read Adobe Acrobat® files, you will need to download and install the free Acrobat Reader® software available from Adobe Systems Incorporated.
Page details
- Date modified:
