
Fuel Focus, February 19, 2016
Table of Contents
- National Overview
- Recent Developments
- Retail Gasoline Overview
- Wholesale Gasoline Prices
- Gasoline Refining and Marketing Margins
- Crude Oil Overview
- Download the report
National Overview
Canadian Retail Gasoline Prices Decreased by 5 Cents over the Last Two Weeks
For the two-week period ending February 16, 2016, the Canadian average retail gasoline price was $0.88 per litre. This is a decrease of 5 cents compared to the two-week period ending February 2, 2016. Prices are 14 cents per litre lower than the same period last year.
Average retail diesel prices decreased by les than 1 cent per litre over the same two week time period to $0.89 per litre. This is 24 cents less compared to the same period last year. Over the same period, furnace oil prices increased by less than 1 cent to $0.92, 17 cents per litre less than a year ago.
Figure 1: Crude Oil and Regular Gasoline Price Comparison
(National Average)
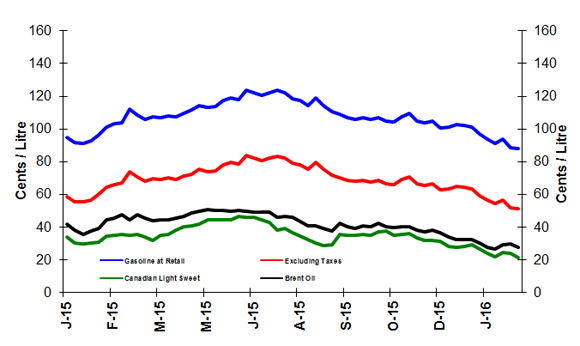
Text version
Figure 1
The graph shows prices in cents per litre for gasoline at retail, gasoline excluding taxes, and Canadian Light Sweet and Brent crude oil prices. Gasoline prices ended the period of February 16, 2016 at 88.2 cents per litre, excluding taxes at 51.5 cents per litre, Canadian Light Sweet at 21.4 cents per litre and Brent at 27.5 cents per litre.
| Dates | Gasoline at retail | Excluding Taxes | Canadian Light Sweet | Brent crude |
|---|---|---|---|---|
| 06/01/2015 | 95.0 | 58.8 | 33.8 | 42.0 |
| 13/01/2015 | 91.5 | 55.7 | 30.5 | 38.1 |
| 20/01/2015 | 91.3 | 55.4 | 29.8 | 35.8 |
| 27/01/2015 | 92.5 | 56.5 | 30.3 | 37.6 |
| 03/02/2015 | 96.5 | 60.2 | 30.7 | 39.1 |
| 10/02/2015 | 101.2 | 64.5 | 34.7 | 44.2 |
| 17/02/2015 | 103.0 | 66.2 | 35.0 | 45.3 |
| 24/02/2015 | 103.7 | 66.8 | 35.7 | 47.7 |
| 03/03/2015 | 112.3 | 74.1 | 35.1 | 44.6 |
| 10/03/2015 | 108.6 | 70.6 | 35.4 | 47.4 |
| 17/03/2015 | 105.8 | 68.0 | 33.8 | 45.4 |
| 2015-03-24 | 107.3 | 69.5 | 31.6 | 43.7 |
| 2015-03-31 | 107.1 | 69.3 | 34.9 | 44.6 |
| 2015-04-07 | 108.1 | 70.2 | 35.6 | 44.2 |
| 2015-04-14 | 107.6 | 69.1 | 38.1 | 45.3 |
| 2015-04-21 | 109.70 | 72.8 | 40.5 | 46.8 |
| 2015-04-28 | 111.40 | 71.0 | 40.7 | 48.9 |
| 2015-05-05 | 114.5 | 75.3 | 41.8 | 49.9 |
| 2015-05-12 | 113.0 | 74.0 | 44.3 | 50.5 |
| 2015-05-19 | 113.6 | 74.6 | 44.5 | 50.1 |
| 2015-05-26 | 117.4 | 78.0 | 44.5 | 50.2 |
| 2015-06-02 | 119.0 | 79.4 | 44.6 | 49.8 |
| 2015-06-09 | 118.2 | 78.7 | 46.3 | 50.1 |
| 2015-06-16 | 123.6 | 83.7 | 46.0 | 50.0 |
| 2015-06-23 | 122.1 | 82.3 | 45.9 | 49.2 |
| 2015-06-30 | 120.6 | 80.9 | 44.4 | 49.4 |
| 2015-07-07 | 122.1 | 82.2 | 42.8 | 49.0 |
| 2015-07-14 | 123.5 | 83.5 | 38.1 | 46.0 |
| 2015-07-21 | 122.2 | 82.3 | 39.1 | 46.6 |
| 2015-07-28 | 118.4 | 78.9 | 36.5 | 45.8 |
| 2015-08-04 | 117.6 | 78.1 | 34.6 | 43.4 |
| 2015-08-11 | 114.5 | 75.5 | 30.3 | 40.7 |
| 2015-08-18 | 118.8 | 79.5 | 28.8 | 39.0 |
| 2015-08-25 | 114.1 | 75.3 | 29.0 | 37.8 |
| 2015-09-01 | 110.6 | 72.0 | 35.6 | 42.5 |
| 2015-09-08 | 108.9 | 70.4 | 35.1 | 40.4 |
| 2015-09-15 | 107.1 | 68.7 | 35.2 | 39.3 |
| 2015-09-22 | 106.1 | 67.9 | 35.2 | 39.3 |
| 2015-09-29 | 106.8 | 68.6 | 35.5 | 40.6 |
| 2015-10-06 | 105.7 | 67.6 | 35.2 | 40.2 |
| 2015-10-13 | 106.7 | 68.5 | 36.9 | 42.3 |
| 2015-10-20 | 104.6 | 66.7 | 37.8 | 40.0 |
| 2015-10-27 | 104.1 | 66.1 | 34.8 | 39.7 |
| 2015-11-03 | 107.2 | 68.9 | 35.4 | 40.1 |
| 2015-11-10 | 109.4 | 70.9 | 36.1 | 40.3 |
| 2015-11-17 | 104.8 | 66.7 | 33.6 | 38.1 |
| 2015-11-24 | 103.6 | 65.6 | 32.1 | 37.1 |
| 2015-12-01 | 104.7 | 66.5 | 31.9 | 38.1 |
| 2015-12-08 | 100.7 | 62.9 | 31.2 | 36.7 |
| 2015-12-15 | 101.3 | 63.5 | 28.3 | 34.0 |
| 2015-12-22 | 102.7 | 64.9 | 27.7 | 32.6 |
| 2015-12-29 | 102.1 | 64.3 | 28.4 | 32.3 |
| 2016-01-05 | 101.3 | 63.4 | 29.1 | 32.3 |
| 2016-01-12 | 96.8 | 59.4 | 26.6 | 30.5 |
| 2016-01-19 | 93.7 | 56.5 | 23.9 | 27.5 |
| 2016-01-26 | 91.3 | 54.3 | 22.1 | 26.5 |
| 2016-02-02 | 93.8 | 56.5 | 24.4 | 29.1 |
| 2016-02-09 | 88.6 | 51.8 | 23.7 | 29.8 |
| 2016-02-16 | 88.2 | 51.5 | 21.4 | 27.5 |
Figure 2: Weekly Regular Gasoline Prices
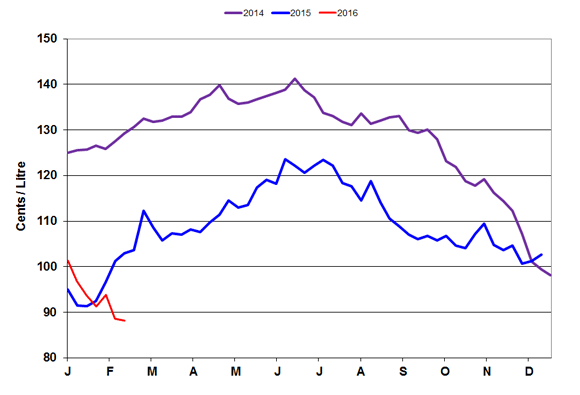
Text version
Figure 2
This graph shows the gasoline price trends from 2014 to 2016.
| Date | 2014 Gasoline at Retail | Date | 2015 Gasoline at Retail | Date | 2016 Gasoline at Retail |
|---|---|---|---|---|---|
| 14-01-07 | 125.00 | 15-01-06 | 95.00 | 16-01-05 | 101.30 |
| 14-01-14 | 125.60 | 15-01-13 | 91.50 | 16-01-12 | 96.80 |
| 14-01-21 | 125.70 | 15-01-20 | 91.30 | 16-01-19 | 93.70 |
| 14-01-28 | 126.60 | 15-01-27 | 92.50 | 16-01-26 | 91.30 |
| 14-02-04 | 125.90 | 15-02-03 | 96.50 | 16-02-02 | 93.80 |
| 14-02-11 | 127.60 | 15-02-10 | 101.20 | 16-02-09 | 88.60 |
| 14-02-18 | 129.30 | 15-02-17 | 103.00 | 16-02-16 | 88.20 |
| 14-02-25 | 130.70 | 15-02-24 | 103.70 | 16-02-23 | |
| 14-03-04 | 132.50 | 15-03-03 | 112.30 | 16-03-01 | |
| 14-03-11 | 131.80 | 15-03-10 | 108.60 | 16-03-08 | |
| 14-03-18 | 132.00 | 15-03-17 | 105.80 | 16-03-15 | |
| 14-03-25 | 132.90 | 15-03-24 | 107.30 | 16-03-22 | |
| 14-04-01 | 132.90 | 15-03-31 | 107.10 | 16-03-29 | |
| 14-04-08 | 133.90 | 15-04-07 | 108.10 | 16-04-05 | |
| 14-04-15 | 136.80 | 15-04-14 | 107.60 | 16-04-12 | |
| 14-04-22 | 137.70 | 15-04-21 | 109.70 | 16-04-19 | |
| 14-04-29 | 139.80 | 15-04-28 | 111.40 | 16-04-26 | |
| 14-05-06 | 136.90 | 15-05-05 | 114.50 | 16-05-03 | |
| 14-05-13 | 135.70 | 15-05-12 | 113.00 | 16-05-10 | |
| 14-05-20 | 136.00 | 15-05-19 | 113.60 | 16-05-17 | |
| 14-05-27 | 136.80 | 15-05-26 | 117.40 | 16-05-24 | |
| 14-06-03 | 137.40 | 15-06-02 | 119.00 | 16-05-31 | |
| 14-06-10 | 138.10 | 15-06-09 | 118.20 | 16-06-07 | |
| 14-06-17 | 138.80 | 15-06-16 | 123.60 | 16-06-14 | |
| 14-06-24 | 141.20 | 15-06-23 | 122.10 | 16-06-21 | |
| 14-07-01 | 138.70 | 15-06-30 | 120.60 | 16-06-28 | |
| 14-07-08 | 137.20 | 15-07-07 | 122.10 | 16-07-05 | |
| 14-07-15 | 133.80 | 15-07-14 | 123.50 | 16-07-12 | |
| 14-07-22 | 133.00 | 15-07-21 | 122.20 | 16-07-19 | |
| 14-07-29 | 131.80 | 15-07-28 | 118.40 | 16-07-26 | |
| 14-08-05 | 131.10 | 15-08-04 | 117.60 | 16-08-02 | |
| 14-08-12 | 133.60 | 15-08-11 | 114.50 | 16-08-09 | |
| 14-08-19 | 131.30 | 15-08-18 | 118.80 | 16-08-16 | |
| 14-08-26 | 132.10 | 15-08-25 | 114.10 | 16-08-23 | |
| 14-09-02 | 132.80 | 15-09-01 | 110.60 | 16-08-30 | |
| 14-09-09 | 133.00 | 15-09-08 | 108.90 | 16-09-06 | |
| 14-09-16 | 129.90 | 15-09-15 | 107.10 | 16-09-13 | |
| 14-09-23 | 129.40 | 15-09-22 | 106.10 | 16-09-20 | |
| 14-09-30 | 130.10 | 15-09-29 | 106.80 | 16-09-27 | |
| 14-10-07 | 128.00 | 15-10-06 | 105.70 | 16-10-04 | |
| 14-10-14 | 123.10 | 15-10-13 | 106.70 | 16-10-11 | |
| 14-10-21 | 121.90 | 15-10-20 | 104.60 | 16-10-18 | |
| 14-10-28 | 118.80 | 15-10-27 | 104.10 | 16-10-25 | |
| 14-11-04 | 117.80 | 15-11-03 | 107.20 | 16-11-01 | |
| 14-11-11 | 119.20 | 15-11-10 | 109.40 | 16-11-08 | |
| 14-11-18 | 116.20 | 15-11-17 | 104.80 | 16-11-15 | |
| 14-11-25 | 114.40 | 15-11-24 | 103.60 | 16-11-22 | |
| 14-12-02 | 112.30 | 15-12-01 | 104.70 | 16-11-29 | |
| 14-12-09 | 107.20 | 15-12-08 | 100.70 | 16-12-06 | |
| 14-12-16 | 101.10 | 15-12-15 | 101.30 | 16-12-13 | |
| 14-12-23 | 99.40 | 15-12-22 | 102.70 | 16-12-20 | |
| 14-12-30 | 98.10 | 15-12-29 | 102.10 | 16-12-27 |
| ¢/L | Two week average ending: 2016-02-16 | Change from: 2 weeks ago | Change from: Last Year |
|---|---|---|---|
| Gasoline | 88.4 | -4.5 | -13.7 |
| Diesel | 89.1 | -0.5 | -23.8 |
| Furnace Oil | 91.5 | 0.4 | -16.9 |
| Natural Gas Prices in $CA/GJ | |||
| Alberta (NGX) | 1.86 | -0.21 | -0.43 |
| Ontario (Dawn) | 2.80 | -0.21 | -0.92 |
Source: NRCan, Bloomberg, NGX
| 2016-02-16 | ¢/kilogram | ¢/L gasoline equivalent | ¢/L diesel equivalent |
|---|---|---|---|
| Vancouver | 120.1 | 79.2 | 82.1 |
| Edmonton | 115.0 | 75.9 | 78.7 |
| Toronto | 128.4 | 84.7 | 87.8 |
Source: ¢/kg Kent Marketing Services Limited
Recent Developments
- U.S. Short Term Energy Outlook
On February 9, 2016, the U.S. Energy Information Administration released its Short-Term Energy Outlook. The EIA forecasts that the annual average U.S. retail gasoline price will be below $2.00 per gallon (69 CAD cents per litre) in 2016. This would be the lowest U.S. annual average gasoline price since 2004. The forecast also notes that that growing crude oil inventories continue to put downward pressure on global oil prices. They forecast Brent and WTI crudes will both average $38 per barrel in 2016, and $50 per barrel in 2017.
- International Energy Agency – Oil Market Report
On February 9, 2016, the International Energy Agency (IEA) released is monthly Oil Market Report. The report identifies a number of factors that continue to weigh on oil prices. On the supply side, there have been recent production increases by Organization of the Petroleum Exporting Countries (OPEC) members including Iraq, Saudi Arabia and Iran. However, non-OPEC production has not declined as fast as expected in response to low oil prices. In addition, the IEA is forecasting that crude oil demand will grow slowly, by only 1.2 million barrels per day (bpd) in 2016, down from 1.5 million bpd in 2015. The IEA notes that the surplus of supply is greater than forecasted in their previous report in January. The IEA concludes that these factors will continue to put downward pressure on global oil prices in the short term.
- Ontario Electric Vehicle Incentive Program
On February 10, 2016, the Government of Ontario announced a new modernized Electric Vehicle Incentive Program. The program will increase the current incentives ($5,000- to $8,500 per vehicle) to $6,000 to $10,000 per vehicle. The program will also include additional incentives for vehicles with larger battery capacities, and for the purchase of electric chargers for home and business use. This program is in addition to the $20 million announced in December 2015 for the building of public fast charging stations for electric vehicles in the province.
Retail Gasoline Overview
For the period ending February 16, 2015, the four-week-average regular gasoline pump price in selected cities across Canada decreased to $0.91 per litre compared to the previous report of February 2, 2016. Compared to the same period in 2015, the average Canadian pump price is 8 cents per litre lower.
The four-week-average crude oil component decreased by 1 cent, averaging 25 cents over the period. The crude oil price component of gasoline is 15 cents per litre lower than this time last year.
Retail gasoline prices in Western centres decreased by 5 cents per litre compared to the previous report and ranged from $0.71 per litre to $1.07 per litre. Prices in Eastern cities decreased by 3 cents and ranged from $0.88 to $0.97 per litre.
At the national level, refining and marketing costs and margins were 29 cents per litre, 2 cents lower than in the previous report and 8 cents higher than the same time last year.
Figure 3: Regular Gasoline Pump Prices in Selected Cities Four-Week Average (January 26 to February 16, 2016)
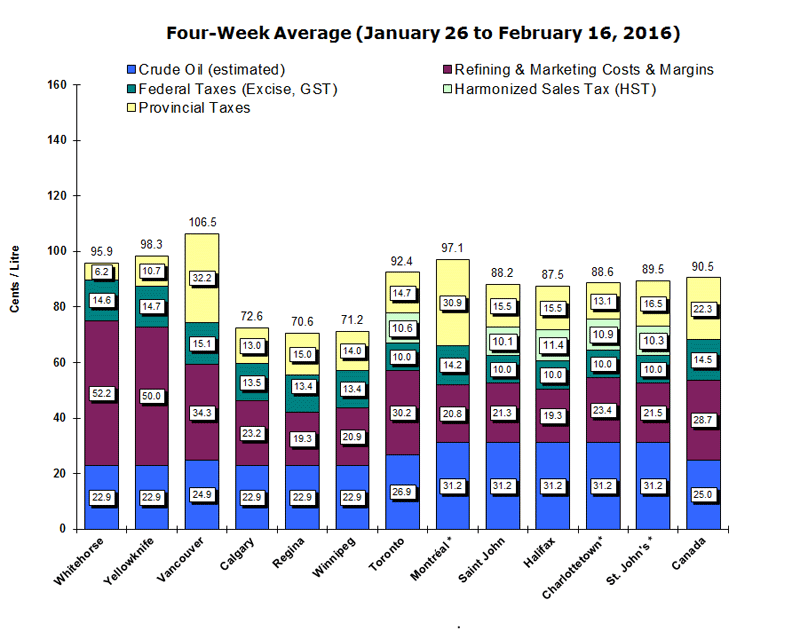
Text version
Figure 3
This graph shows the gasoline price components for 2 territories and 10 cities plus the national average.
Note that effective this report, transportation costs are included in the crude oil estimate for Vancouver (2 cents per litre), Toronto, (4 cents per litre), and Atlantic Canada and Quebec (3 cents per litre)
| Whitehorse | Yellowknife | Vancouver | Calgary | Regina | Winnipeg | Toronto | Montreal* | Saint John* | Halifax* | Charlottetown* | St. John's* | Canada | |
|---|---|---|---|---|---|---|---|---|---|---|---|---|---|
| Pump Price | 95.9 | 98.3 | 106.5 | 72.6 | 70.6 | 71.2 | 92.4 | 97.1 | 88.2 | 87.5 | 88.6 | 89.5 | 90.5 |
| Crude (est.) | 22.9 | 22.9 | 24.9 | 22.9 | 22.9 | 22.9 | 26.9 | 31.2 | 31.2 | 31.2 | 31.2 | 31.2 | 25.0 |
| Federal Taxes | 14.6 | 14.7 | 15.1 | 13.5 | 13.4 | 13.4 | 10.0 | 14.2 | 10.0 | 10.0 | 10.0 | 10.0 | 14.5 |
| Provincial Tax | 6.2 | 10.7 | 32.2 | 13.0 | 15.0 | 14.0 | 14.7 | 30.9 | 15.5 | 15.5 | 13.1 | 16.5 | 22.3 |
| HST | 10.6 | 10.1 | 11.4 | 10.9 | 10.3 | ||||||||
| Refining & Marketing Costs & Margins | 52.2 | 50.0 | 34.3 | 23.2 | 19.3 | 20.9 | 30.2 | 20.8 | 21.3 | 19.3 | 23.4 | 21.5 | 28.7 |
Source: NRCan
* Regulated Markets
Note: An estimate of crude oil transportation costs is included in the crude oil estimate for Vancouver (2 cents per litre), Toronto, (4 cents per litre), and Atlantic Canada and Quebec (3 cents per litre)
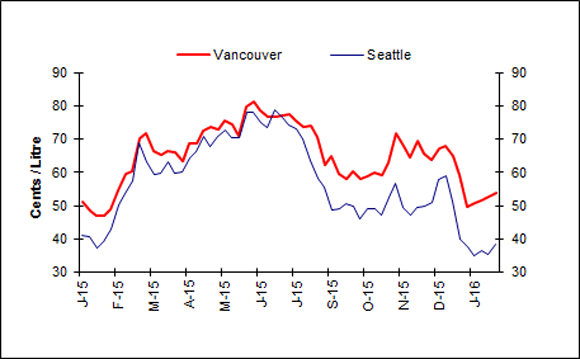
Wholesale Gasoline Prices
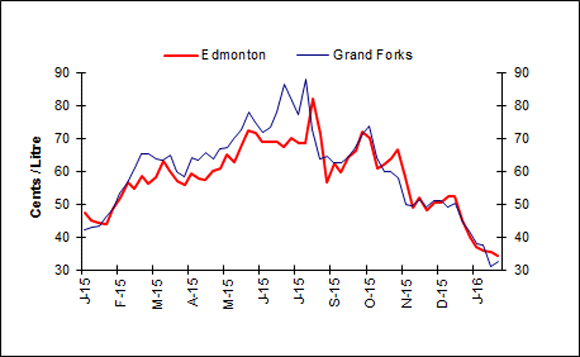
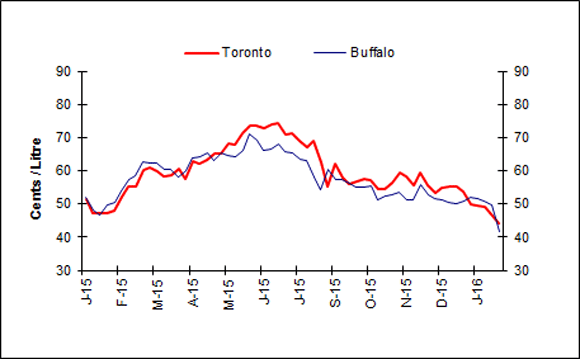
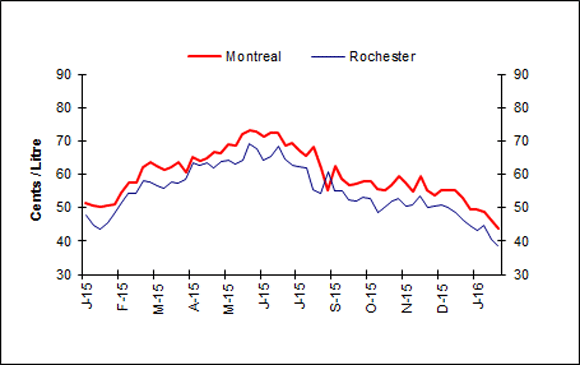
For the two week period ending February 11, 2015, wholesale gasoline prices across selected North American cities trended downward, except in Vancouver and Seattle where prices increased slightly. Prices were especially down in Toronto where they decreased by 6 cents per litre (11%).
Wholesale gasoline prices for the two week period averaged between 32 and 54 cents per litre. This compares to the previous two week period where prices were in the 36 to 51 cents per litre range.
In Western cities, wholesale gasoline prices ranged from a decrease of 6 cents to an increase of 3 cents per litre ending in the 32 to 54 cents per litre range.
Price changes in Eastern markets of Canada and the U.S. range decreased between 5 and 10 cents per litre ending in the 38 to 44 cents per litre range.
Compared to last year, wholesale prices are lower in all markets. This is especially the case in Edmonton and Grand Forks, where prices are down by 23 cents per litre (40%) and 24 cents per litre (43%) respectively compared to last year.
 |
 |
|
 |
 |
|
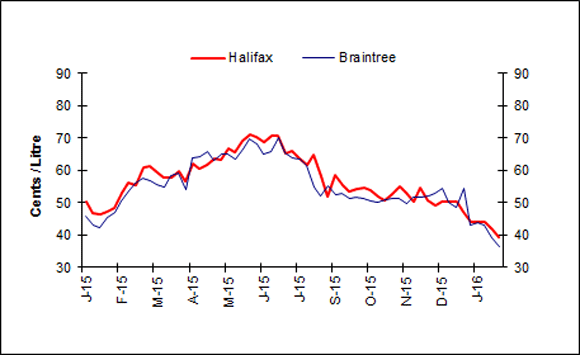 |
Text version
Figure 4
This graph shows the trend in wholesale gasoline prices for selected centres in Canada and the U.S.
| DATE | Halifax | Braintree | Montreal | Rochester | Toronto | Buffalo | Edmonton | Grand Forks | Vancouver | Seattle |
|---|---|---|---|---|---|---|---|---|---|---|
| Thu 01-Jan-15 | 50.20 | 45.88 | 51.30 | 47.82 | 51.70 | 52.04 | 47.20 | 42.25 | 51.20 | 41.16 |
| Thu 08-Jan-15 | 46.90 | 43.19 | 50.60 | 44.81 | 47.30 | 48.09 | 45.00 | 42.87 | 48.50 | 40.72 |
| Thu 15-Jan-15 | 46.60 | 42.30 | 50.30 | 43.50 | 47.20 | 46.68 | 44.20 | 43.28 | 47.00 | 37.04 |
| Thu 22-Jan-15 | 47.20 | 45.26 | 50.50 | 45.67 | 47.20 | 49.64 | 43.90 | 45.92 | 47.00 | 39.15 |
| Thu 29-Jan-15 | 48.20 | 47.00 | 51.00 | 48.37 | 48.00 | 50.44 | 48.40 | 48.80 | 48.80 | 42.85 |
| Thu 05-Feb-15 | 52.90 | 50.65 | 54.60 | 51.75 | 52.20 | 54.13 | 52.10 | 53.44 | 54.60 | 50.12 |
| Thu 12-Feb-15 | 56.20 | 53.56 | 57.40 | 54.19 | 55.40 | 57.51 | 56.70 | 56.48 | 59.40 | 53.76 |
| Thu 19-Feb-15 | 55.60 | 55.91 | 57.70 | 54.23 | 55.40 | 58.78 | 54.70 | 60.87 | 60.40 | 57.33 |
| Thu 26-Feb-15 | 60.80 | 57.71 | 62.30 | 58.17 | 60.20 | 62.69 | 58.60 | 65.23 | 70.30 | 68.96 |
| Thu 05-Mar-15 | 61.20 | 56.75 | 63.80 | 57.62 | 61.20 | 62.49 | 56.30 | 65.32 | 71.60 | 63.08 |
| Thu 12-Mar-15 | 59.30 | 55.45 | 62.70 | 56.74 | 59.80 | 62.36 | 58.20 | 63.71 | 66.40 | 59.34 |
| Thu 19-Mar-15 | 57.90 | 54.71 | 61.40 | 55.89 | 58.30 | 60.60 | 63.00 | 63.29 | 65.20 | 59.76 |
| Thu 26-Mar-15 | 58.10 | 58.24 | 62.00 | 57.84 | 58.90 | 60.60 | 60.10 | 64.71 | 66.30 | 63.29 |
| Thu 02-Apr-15 | 59.60 | 58.97 | 63.70 | 57.44 | 60.80 | 58.31 | 57.10 | 59.91 | 66.20 | 59.80 |
| Thu 09-Apr-15 | 59.60 | 54.12 | 60.70 | 58.63 | 57.80 | 60.01 | 55.90 | 58.28 | 63.30 | 59.94 |
| Thu 16-Apr-15 | 62.10 | 63.74 | 65.30 | 63.38 | 63.10 | 63.81 | 59.20 | 63.94 | 68.60 | 64.41 |
| Thu 23-Apr-15 | 60.70 | 64.33 | 64.20 | 62.59 | 62.20 | 64.43 | 57.80 | 63.33 | 68.60 | 66.20 |
| Thu 30 Apr-15 | 61.70 | 65.85 | 64.70 | 63.49 | 63.50 | 65.56 | 57.40 | 65.51 | 72.60 | 70.92 |
| Thu 7 May-15 | 63.50 | 63.07 | 66.60 | 61.79 | 65.20 | 63.39 | 60.20 | 63.71 | 73.80 | 67.87 |
| Thu 14 May-15 | 63.30 | 65.00 | 66.20 | 64.04 | 65.20 | 65.64 | 60.70 | 66.92 | 72.90 | 70.76 |
| Thu 21-May-15 | 66.80 | 64.92 | 69.10 | 64.28 | 68.40 | 64.92 | 65.00 | 67.13 | 75.70 | 72.83 |
| Thu 28-May-15 | 65.70 | 63.55 | 68.50 | 63.23 | 67.90 | 64.52 | 62.90 | 69.68 | 74.60 | 70.32 |
| Thu 04-Jun-15 | 69.00 | 66.58 | 71.90 | 64.27 | 71.40 | 66.25 | 68.20 | 72.51 | 71.20 | 70.54 |
| Thu 11-Jun-15 | 71.00 | 69.89 | 73.30 | 69.08 | 73.70 | 71.22 | 72.40 | 78.00 | 79.90 | 78.13 |
| Thu 18-Jun-15 | 70.30 | 68.14 | 72.70 | 67.49 | 73.80 | 69.44 | 71.70 | 74.98 | 81.20 | 78.24 |
| Thu 25-Jun-15 | 68.90 | 65.15 | 71.20 | 64.18 | 72.90 | 66.12 | 69.00 | 71.60 | 78.60 | 75.15 |
| Thu 02-Jul-15 | 70.50 | 65.89 | 72.40 | 65.23 | 74.20 | 66.54 | 68.90 | 73.39 | 76.80 | 73.39 |
| Thu 9-Jul-15 | 72.30 | 69.94 | 73.70 | 68.60 | 74.60 | 68.26 | 68.70 | 78.01 | 76.60 | 79.02 |
| Thu 16-Jul-15 | 65.40 | 65.29 | 68.50 | 64.60 | 71.10 | 65.97 | 67.40 | 86.48 | 77.10 | 76.57 |
| Thu 23-Jul-15 | 65.80 | 64.02 | 69.30 | 62.65 | 71.50 | 65.40 | 69.90 | 81.58 | 77.60 | 74.35 |
| Thu 30-Jul-15 | 63.80 | 63.32 | 67.20 | 62.28 | 69.20 | 63.66 | 68.50 | 77.08 | 75.60 | 72.95 |
| Thu 06-Aug-15 | 61.80 | 58.98 | 65.60 | 59.33 | 67.40 | 61.06 | 68.60 | 75.98 | 73.50 | 65.57 |
| Thu 13-Aug-15 | 64.90 | 61.15 | 68.10 | 61.84 | 69.10 | 62.88 | 81.80 | 87.41 | 74.20 | 69.79 |
| Thu 20-Aug-15 | 58.20 | 54.94 | 61.90 | 55.63 | 62.50 | 58.05 | 71.10 | 72.56 | 70.60 | 63.58 |
| Thu 27-Aug-15 | 51.80 | 52.64 | 55.30 | 54.73 | 55.50 | 54.73 | 56.70 | 64.15 | 62.30 | 58.92 |
| Thu 03-Sep-15 | 58.60 | 55.09 | 62.50 | 60.67 | 62.30 | 60.67 | 62.20 | 64.51 | 64.80 | 55.44 |
| Thu 10-Sep-15 | 55.40 | 52.73 | 58.70 | 55.18 | 58.00 | 57.62 | 59.80 | 62.51 | 59.50 | 48.89 |
| Thu 17-Sep-15 | 53.30 | 51.21 | 56.70 | 52.25 | 56.10 | 56.43 | 64.20 | 64.44 | 58.00 | 50.51 |
| Thu 24-Sep-15 | 54.10 | 51.85 | 57.10 | 52.20 | 56.70 | 55.02 | 66.20 | 67.01 | 60.50 | 49.73 |
| Thu 01-Oct-15 | 54.70 | 51.42 | 57.80 | 53.17 | 57.50 | 55.27 | 71.80 | 71.36 | 58.20 | 45.83 |
| Thu 08-Oct-15 | 54.00 | 50.55 | 58.00 | 52.62 | 57.10 | 55.71 | 69.90 | 73.59 | 58.80 | 49.18 |
| Thu 15-Oct-15 | 52.00 | 50.11 | 55.50 | 48.75 | 54.60 | 51.47 | 60.70 | 64.09 | 59.80 | 49.09 |
| Thu 22-Oct-15 | 50.60 | 50.83 | 55.20 | 50.13 | 54.50 | 52.55 | 62.00 | 59.81 | 59.30 | 47.02 |
| Thu 29-Oct-15 | 52.50 | 51.14 | 56.90 | 51.84 | 56.60 | 52.88 | 63.80 | 59.84 | 63.00 | 52.54 |
| Thu 05-Nov-15 | 55.20 | 51.13 | 59.50 | 52.87 | 59.70 | 53.57 | 66.50 | 58.09 | 71.90 | 56.70 |
| Thu 05-Nov-15 | 55.20 | 51.13 | 59.50 | 52.87 | 59.70 | 53.57 | 66.50 | 58.09 | 71.90 | 56.70 |
| Thu 12-Nov-15 | 53.20 | 49.57 | 57.60 | 58.40 | 51.32 | 58.20 | 49.92 | 68.10 | 49.57 | |
| Thu 26-Nov-15 | 54.60 | 51.65 | 59.40 | 53.41 | 59.70 | 55.86 | 51.80 | 51.30 | 69.40 | 49.54 |
| Thu 03-Dec-15 | 50.60 | 52.01 | 55.20 | 52.72 | 55.80 | 52.72 | 48.30 | 49.18 | 65.70 | 49.89 |
| Thu 10-Dec-15 | 49.00 | 52.81 | 53.80 | 50.65 | 53.40 | 51.73 | 50.60 | 51.01 | 63.70 | 51.01 |
| Thu 17-Dec-15 | 50.30 | 54.25 | 55.10 | 50.93 | 54.80 | 51.30 | 50.60 | 50.93 | 67.10 | 57.94 |
| Thu 24-Dec-15 | 50.30 | 50.11 | 55.40 | 50.11 | 55.20 | 50.47 | 52.50 | 49.01 | 67.80 | 58.89 |
| Thu 31-Dec-15 | 50.20 | 48.63 | 55.30 | 48.63 | 55.20 | 50.09 | 52.30 | 50.09 | 65.00 | 51.19 |
| Thu 07-Jan-16 | 47.30 | 54.60 | 53.10 | 46.43 | 53.70 | 50.89 | 45.20 | 44.57 | 59.20 | 39.75 |
| Thu 14-Jan-16 | 44.20 | 42.91 | 49.60 | 44.80 | 50.10 | 52.02 | 40.00 | 41.77 | 49.70 | 37.59 |
| Thu 21-Jan-16 | 44.20 | 43.76 | 49.40 | 43.16 | 49.70 | 51.70 | 37.10 | 38.00 | 50.70 | 34.99 |
| Thu 28-Jan-16 | 44.00 | 43.05 | 48.80 | 44.61 | 49.30 | 51.08 | 35.70 | 37.55 | 51.70 | 36.32 |
| Thu 04-Feb-16 | 41.60 | 39.20 | 46.40 | 40.54 | 46.70 | 49.82 | 35.30 | 30.91 | 52.70 | 35.35 |
| Thu 11-Feb-16 | 39.40 | 36.50 | 43.90 | 38.49 | 44.10 | 41.77 | 34.10 | 32.42 | 53.70 | 38.38 |
Sources: NRCan, Bloomberg Oil Buyers Guide
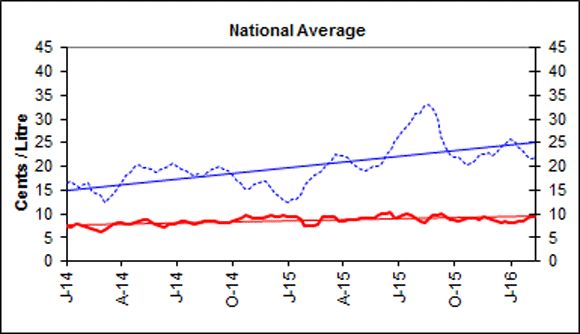
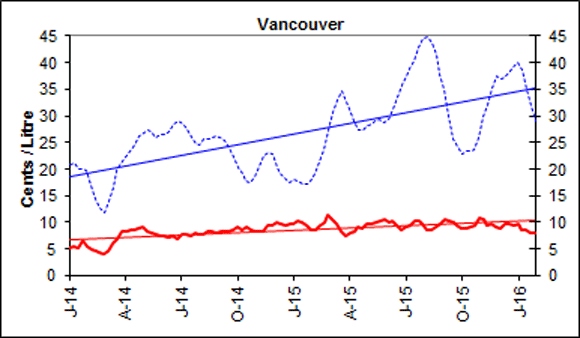
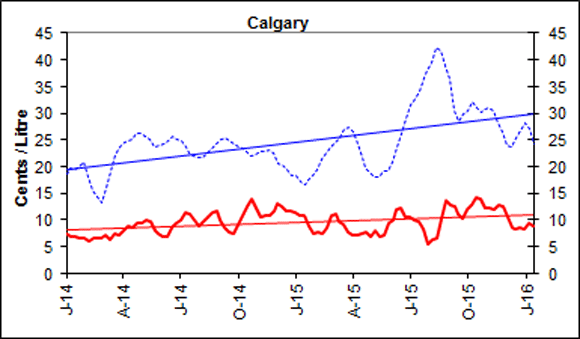
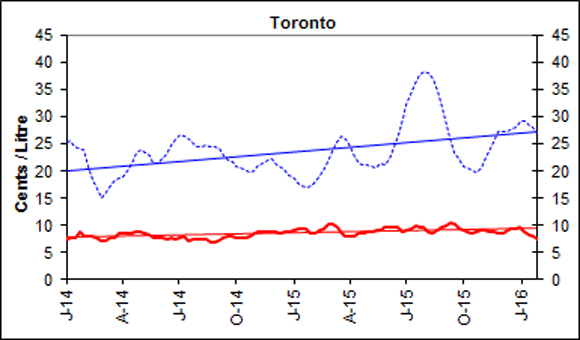
Gasoline Refining and Marketing Margins
Four-week rolling averages are used for gasoline refining and marketing margins.
Gasoline refining margins refer to the difference between the price of crude oil and the wholesale price at which the refiner can sell gasoline. The margin includes the costs associated with refining the product as well as a profit for the refiner.
The gasoline marketing margins represent the difference between the wholesale and retail prices of gasoline. This margin pays for the costs associated with operating a service station.
Nationally, the four-week rolling average refining margin for the period ending February 16, 2016 was 22 cents per litre, an increase of less than a cent over the past two weeks. Compared to the same time last year, margins in Canada are 4 cents per litre higher.
Overall, the national average for marketing margins increased slightly to reach 9 cents per litre.
 |
 |
|
 |
 |
|
 |
 |
Text version
Figure 5
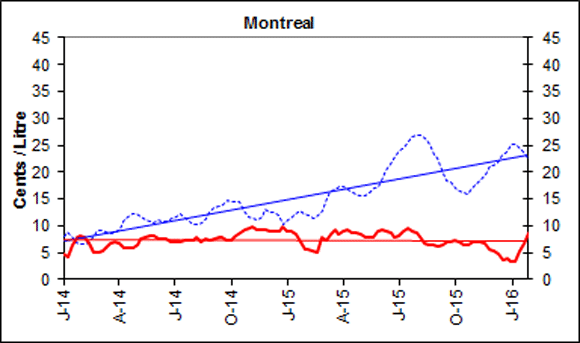
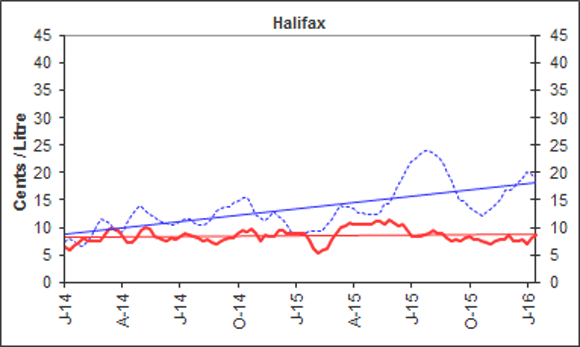
These graphs show the trend in refining and marketing costs and margins for selected centres in Canada and the national average.
| 4-week rolling average | Canada | Vancouver | Calgary | Toronto | Montreal | Halifax | ||||||
|---|---|---|---|---|---|---|---|---|---|---|---|---|
| Marketing Margin | Refining Margin | Marketing Margin | Refining Margin | Marketing Margin | Refining Margin | Marketing Margin | Refining Margin | Marketing Margin | Refining Margin | Marketing Margin | Refining Margin | |
| 2014-01-07 | 7.7 | 16.4 | 5.2 | 20.8 | 7.6 | 18.6 | 7.4 | 25.3 | 4.7 | 8.1 | 6.3 | 7.4 |
| 2014-01-14 | 7.3 | 16.7 | 5.5 | 21.2 | 6.8 | 19.7 | 7.6 | 25.6 | 4.1 | 8.7 | 5.8 | 8.1 |
| 2014-01-21 | 7.9 | 16.3 | 5.2 | 20.1 | 7.0 | 19.4 | 7.6 | 24.3 | 6.4 | 8.1 | 6.6 | 7.7 |
| 2014-01-28 | 7.9 | 15.6 | 6.6 | 20.1 | 6.7 | 20.1 | 8.7 | 24.1 | 7.8 | 6.9 | 7.4 | 6.7 |
| 2014-02-04 | 7.6 | 16.1 | 5.5 | 20.0 | 6.7 | 21.3 | 8.0 | 24.2 | 8.2 | 6.5 | 8.1 | 6.7 |
| 2014-02-11 | 7.3 | 16.4 | 5.0 | 16.9 | 6.1 | 18.0 | 8.0 | 20.7 | 7.8 | 6.5 | 7.6 | 7.3 |
| 2014-02-18 | 7.0 | 15.0 | 4.6 | 16.4 | 6.7 | 17.7 | 7.9 | 20.3 | 6.6 | 7.2 | 7.6 | 8.7 |
| 2014-02-25 | 6.5 | 14.3 | 4.3 | 12.5 | 6.5 | 14.3 | 7.8 | 16.8 | 5.1 | 8.2 | 7.4 | 10.2 |
| 2014-03-04 | 6.3 | 14.1 | 4.0 | 11.8 | 6.7 | 13.3 | 7.2 | 15.0 | 5.0 | 9.1 | 7.4 | 11.6 |
| 2014-03-11 | 6.7 | 12.6 | 4.7 | 14.0 | 7.3 | 16.0 | 7.1 | 16.0 | 5.3 | 9.1 | 8.8 | 11.2 |
| 2014-03-18 | 7.1 | 13.3 | 5.9 | 15.3 | 6.5 | 17.9 | 7.6 | 15.7 | 6.3 | 8.5 | 9.6 | 10.4 |
| 2014-03-25 | 7.7 | 14.3 | 6.8 | 19.7 | 7.4 | 22.1 | 7.8 | 18.0 | 6.6 | 8.4 | 9.6 | 9.7 |
| 2014-04-01 | 8.1 | 15.1 | 8.3 | 21.5 | 7.3 | 24.1 | 8.4 | 18.9 | 7.0 | 8.4 | 9.4 | 8.7 |
| 2014-04-08 | 8.1 | 16.6 | 8.3 | 22.4 | 8.1 | 24.5 | 8.5 | 19.0 | 6.8 | 9.5 | 8.4 | 9.3 |
| 2014-04-15 | 7.8 | 18.2 | 8.5 | 23.7 | 9.0 | 24.9 | 8.4 | 20.3 | 5.8 | 11.1 | 7.1 | 11.0 |
| 2014-04-22 | 7.8 | 18.9 | 8.6 | 24.4 | 8.5 | 25.2 | 8.6 | 21.3 | 5.7 | 11.5 | 7.2 | 12.1 |
| 2014-04-29 | 8.0 | 20.0 | 8.7 | 26.0 | 9.3 | 26.1 | 8.7 | 23.0 | 5.9 | 12.2 | 8.2 | 13.2 |
| 2014-05-06 | 8.4 | 20.3 | 9.0 | 26.7 | 9.6 | 26.3 | 8.8 | 23.7 | 6.4 | 12.3 | 9.4 | 14.0 |
| 2014-05-13 | 8.7 | 19.8 | 8.4 | 27.4 | 9.9 | 26.0 | 8.5 | 23.5 | 7.4 | 11.5 | 10.0 | 13.3 |
| 2014-05-20 | 8.6 | 19.6 | 8.1 | 27.2 | 9.7 | 25.2 | 8.2 | 22.9 | 8.0 | 11.0 | 9.6 | 12.3 |
| 2014-05-27 | 8.0 | 19.4 | 7.7 | 27.2 | 7.9 | 24.8 | 7.8 | 22.5 | 8.0 | 10.8 | 8.4 | 12.1 |
| 2014-06-03 | 7.7 | 18.8 | 7.4 | 26.4 | 7.4 | 23.9 | 7.7 | 21.4 | 8.1 | 10.6 | 8.1 | 11.3 |
| 2014-06-10 | 7.4 | 19.4 | 7.3 | 26.4 | 6.9 | 24.3 | 7.6 | 22.0 | 7.7 | 11.2 | 7.8 | 11.3 |
| 2014-06-17 | 7.3 | 19.8 | 7.1 | 26.9 | 6.8 | 24.7 | 7.3 | 23.0 | 7.6 | 10.8 | 7.7 | 10.7 |
| 2014-06-24 | 7.8 | 19.9 | 7.3 | 28.5 | 8.6 | 25.7 | 7.7 | 24.8 | 7.6 | 11.0 | 8.0 | 10.5 |
| 2014-07-01 | 7.8 | 20.7 | 6.9 | 29.1 | 9.3 | 25.1 | 7.3 | 25.8 | 6.9 | 11.3 | 7.8 | 10.7 |
| 2014-07-08 | 8.2 | 20.0 | 7.7 | 28.0 | 10.0 | 24.0 | 7.7 | 25.6 | 7.1 | 10.8 | 8.2 | 10.3 |
| 2014-07-15 | 8.6 | 19.4 | 7.6 | 27.9 | 11.4 | 23.8 | 7.8 | 26.4 | 6.9 | 12.2 | 8.9 | 11.6 |
| 2014-07-22 | 8.4 | 19.0 | 7.3 | 26.2 | 11.2 | 22.4 | 7.1 | 25.6 | 7.2 | 11.6 | 8.7 | 11.3 |
| 2014-07-29 | 8.3 | 18.4 | 7.9 | 25.1 | 9.9 | 22.0 | 7.4 | 25.2 | 7.1 | 11.1 | 8.3 | 11.0 |
| 2014-08-05 | 7.9 | 18.2 | 7.6 | 24.6 | 8.9 | 21.6 | 7.2 | 24.4 | 7.2 | 10.4 | 8.1 | 10.4 |
| 2014-08-12 | 8.0 | 18.4 | 8.1 | 25.1 | 9.7 | 21.8 | 7.3 | 24.4 | 7.8 | 10.3 | 7.6 | 10.5 |
| 2014-08-19 | 8.6 | 17.8 | 8.3 | 25.2 | 10.5 | 22.3 | 7.3 | 24.2 | 7.0 | 10.1 | 7.8 | 10.4 |
| 2014-08-26 | 8.6 | 18.6 | 8.1 | 25.9 | 11.4 | 23.4 | 6.9 | 24.5 | 7.5 | 11.3 | 7.2 | 11.6 |
| 2014-09-02 | 8.4 | 19.5 | 7.9 | 26.6 | 11.8 | 24.5 | 6.8 | 24.7 | 7.4 | 12.2 | 7.0 | 12.5 |
| 2014-09-09 | 8.5 | 19.6 | 7.6 | 26.4 | 10.1 | 25.2 | 7.1 | 24.1 | 7.6 | 13.4 | 7.5 | 13.3 |
| 2014-09-16 | 8.0 | 20.1 | 8.2 | 25.4 | 8.5 | 25.4 | 7.6 | 22.9 | 7.7 | 13.4 | 7.8 | 13.3 |
| 2014-09-23 | 8.2 | 19.3 | 8.3 | 24.1 | 7.8 | 24.8 | 8.0 | 21.8 | 7.8 | 13.8 | 8.1 | 13.7 |
| 2014-09-30 | 8.1 | 19.2 | 8.6 | 22.2 | 7.5 | 24.4 | 7.9 | 21.6 | 7.3 | 14.3 | 8.0 | 14.2 |
| 2014-10-07 | 8.4 | 18.1 | 9.2 | 20.2 | 9.2 | 23.7 | 7.6 | 20.8 | 7.2 | 14.5 | 8.9 | 14.9 |
| 2014-10-14 | 8.8 | 17.0 | 8.6 | 17.9 | 11.0 | 22.1 | 7.7 | 19.2 | 8.0 | 13.2 | 9.6 | 13.9 |
| 2014-10-21 | 9.2 | 15.7 | 9.2 | 17.7 | 12.4 | 23.0 | 7.7 | 20.4 | 8.8 | 14.5 | 9.3 | 15.4 |
| 2014-10-28 | 9.6 | 13.4 | 8.5 | 16.5 | 13.8 | 21.1 | 8.0 | 18.8 | 9.2 | 12.5 | 9.6 | 13.5 |
| 2014-11-04 | 9.3 | 15.2 | 8.1 | 18.5 | 12.3 | 22.2 | 8.4 | 19.9 | 9.4 | 11.5 | 8.9 | 12.3 |
| 2014-11-11 | 9.2 | 16.2 | 8.3 | 19.7 | 10.5 | 21.9 | 8.7 | 20.2 | 9.9 | 10.6 | 7.5 | 11.1 |
| 2014-11-18 | 9.2 | 16.4 | 8.4 | 22.4 | 10.7 | 22.9 | 8.8 | 21.4 | 9.1 | 11.0 | 8.5 | 11.3 |
| 2014-11-25 | 9.2 | 16.8 | 9.4 | 22.7 | 10.9 | 22.7 | 8.7 | 21.4 | 9.4 | 10.8 | 8.3 | 11.0 |
| 2014-12-02 | 9.4 | 16.8 | 9.4 | 22.9 | 11.8 | 22.4 | 8.8 | 22.2 | 9.1 | 13.1 | 8.5 | 12.9 |
| 2014-12-09 | 9.7 | 15.7 | 9.9 | 19.4 | 13.2 | 19.6 | 8.8 | 20.1 | 8.9 | 11.5 | 9.4 | 11.1 |
| 2014-12-16 | 9.5 | 14.2 | 9.5 | 19.2 | 12.5 | 20.2 | 8.5 | 20.9 | 9.1 | 12.5 | 9.3 | 11.7 |
| 2014-12-23 | 9.4 | 13.8 | 9.5 | 18.3 | 11.8 | 19.4 | 8.8 | 20.1 | 9.1 | 11.9 | 9.0 | 10.4 |
| 2014-12-30 | 9.6 | 12.9 | 9.8 | 17.5 | 11.8 | 18.4 | 8.9 | 19.0 | 9.7 | 10.3 | 9.0 | 8.9 |
| 2015-01-06 | 9.4 | 12.5 | 9.7 | 18.1 | 11.3 | 18.3 | 9.1 | 18.9 | 8.8 | 11.2 | 9.0 | 9.0 |
| 2015-01-13 | 9.6 | 13.0 | 10.1 | 17.6 | 10.7 | 17.1 | 9.4 | 17.8 | 8.9 | 11.6 | 9.0 | 8.9 |
| 2015-01-20 | 9.5 | 12.9 | 9.9 | 17.1 | 10.9 | 16.7 | 9.4 | 17.1 | 8.3 | 12.1 | 8.8 | 9.0 |
| 2015-01-27 | 8.7 | 13.9 | 9.4 | 17.2 | 8.9 | 17.4 | 9.3 | 17.0 | 7.0 | 12.7 | 7.9 | 9.2 |
| 2015-02-03 | 7.6 | 16.1 | 8.6 | 18.9 | 7.5 | 19.3 | 8.5 | 18.3 | 5.7 | 14.0 | 6.1 | 11.0 |
| 2015-02-10 | 7.5 | 17.2 | 8.6 | 19.3 | 7.6 | 19.6 | 8.6 | 18.0 | 5.5 | 11.8 | 5.4 | 9.4 |
| 2015-02-17 | 7.6 | 18.0 | 9.3 | 21.9 | 7.6 | 21.9 | 9.0 | 19.4 | 5.3 | 12.5 | 5.8 | 10.6 |
| 2015-02-24 | 7.8 | 18.5 | 10.1 | 23.7 | 8.6 | 22.5 | 9.3 | 20.0 | 5.0 | 12.0 | 6.2 | 10.4 |
| 2015-03-03 | 9.5 | 19.1 | 11.3 | 27.3 | 10.8 | 23.7 | 10.2 | 21.7 | 7.7 | 13.2 | 7.7 | 11.6 |
| 2015-03-10 | 9.5 | 20.2 | 10.5 | 30.6 | 11.0 | 24.4 | 10.1 | 23.6 | 7.3 | 14.5 | 8.9 | 12.6 |
| 2015-03-17 | 9.4 | 20.9 | 9.7 | 32.1 | 9.7 | 24.7 | 9.6 | 24.4 | 8.3 | 15.8 | 9.9 | 13.4 |
| 2015-03-24 | 9.5 | 22.6 | 8.2 | 34.7 | 9.2 | 27.1 | 8.6 | 26.2 | 9.2 | 16.8 | 10.3 | 13.9 |
| 2015-03-31 | 8.6 | 22.3 | 7.5 | 33.3 | 7.6 | 27.3 | 8.0 | 25.7 | 8.4 | 17.3 | 10.9 | 13.9 |
| 2015-04-07 | 8.6 | 22.4 | 7.9 | 31.2 | 7.2 | 26.5 | 7.9 | 24.4 | 9.1 | 17.2 | 10.6 | 13.4 |
| 2015-04-14 | 8.7 | 21.9 | 8.3 | 30.1 | 7.4 | 25.1 | 8.1 | 23.5 | 9.2 | 17.1 | 10.6 | 13.2 |
| 2015-04-21 | 8.6 | 20.7 | 9.2 | 27.3 | 7.5 | 21.7 | 8.5 | 21.4 | 8.7 | 16.4 | 10.6 | 12.6 |
| 2015-04-28 | 8.8 | 20.0 | 9.0 | 27.3 | 7.8 | 19.6 | 8.4 | 21.2 | 8.6 | 16.0 | 10.6 | 12.3 |
| 2015-05-05 | 9.2 | 19.6 | 9.6 | 28.2 | 6.8 | 18.9 | 8.8 | 21.2 | 8.3 | 15.7 | 10.5 | 12.4 |
| 2015-05-12 | 9.3 | 19.2 | 9.7 | 29.7 | 7.9 | 19.0 | 8.8 | 21.8 | 7.8 | 15.8 | 11.0 | 12.5 |
| 2015-05-19 | 9.2 | 19.3 | 10.0 | 29.6 | 7.0 | 18.5 | 9.1 | 21.2 | 7.9 | 16.0 | 11.1 | 12.9 |
| 2015-05-26 | 9.0 | 20.1 | 10.3 | 30.0 | 7.1 | 19.7 | 9.0 | 21.9 | 7.9 | 17.0 | 10.6 | 14.0 |
| 2015-06-02 | 9.8 | 20.0 | 10.6 | 29.1 | 9.4 | 19.5 | 9.7 | 21.3 | 8.9 | 17.1 | 11.3 | 14.1 |
| 2015-06-09 | 9.9 | 20.7 | 10.0 | 29.6 | 9.9 | 20.9 | 9.6 | 22.4 | 9.2 | 18.2 | 10.9 | 15.4 |
| 2015-06-16 | 10.2 | 22.6 | 10.1 | 30.6 | 12.0 | 23.0 | 9.6 | 23.8 | 8.9 | 20.1 | 10.2 | 17.4 |
| 2015-06-23 | 10.2 | 23.5 | 9.4 | 31.3 | 12.3 | 24.0 | 9.7 | 24.4 | 8.7 | 20.7 | 10.6 | 18.1 |
| 2015-06-30 | 9.2 | 25.0 | 8.4 | 33.6 | 10.6 | 26.9 | 8.7 | 27.4 | 7.9 | 22.5 | 9.6 | 20.2 |
| 2015-07-07 | 9.4 | 26.1 | 9.2 | 34.1 | 10.5 | 28.1 | 9.1 | 28.7 | 8.2 | 23.3 | 8.4 | 21.1 |
| 2015-07-14 | 9.6 | 27.6 | 9.2 | 37.0 | 9.8 | 30.8 | 9.4 | 32.4 | 9.1 | 23.7 | 8.4 | 21.6 |
| 2015-07-21 | 10.0 | 28.6 | 10.3 | 37.8 | 6.9 | 31.5 | 9.8 | 33.3 | 9.7 | 23.7 | 8.4 | 21.4 |
| 2015-07-28 | 9.6 | 30.0 | 10.2 | 42.8 | 8.2 | 36.5 | 9.7 | 37.6 | 9.1 | 26.6 | 8.8 | 23.9 |
| 2015-08-04 | 9.1 | 31.2 | 9.8 | 44.6 | 5.6 | 38.2 | 9.7 | 38.4 | 8.6 | 27.0 | 8.9 | 23.9 |
| 2015-08-11 | 8.5 | 31.2 | 8.7 | 44.8 | 6.2 | 39.6 | 8.8 | 38.0 | 7.5 | 26.7 | 9.3 | 23.3 |
| 2015-08-18 | 6.2 | 32.8 | 8.5 | 43.7 | 6.6 | 42.3 | 8.6 | 36.9 | 6.7 | 26.4 | 8.9 | 22.9 |
| 2015-08-25 | 6.9 | 33.0 | 9.1 | 41.4 | 10.2 | 41.6 | 9.1 | 34.6 | 6.4 | 25.1 | 8.9 | 21.6 |
| 2015-09-01 | 5.1 | 32.0 | 9.8 | 38.5 | 13.8 | 39.5 | 9.6 | 32.2 | 6.5 | 23.1 | 8.0 | 19.7 |
| 2015-09-08 | 5.2 | 30.0 | 10.4 | 36.0 | 12.8 | 37.4 | 10.0 | 30.6 | 6.2 | 22.6 | 7.4 | 19.0 |
| 2015-09-15 | 6.5 | 26.4 | 10.3 | 30.9 | 12.4 | 31.6 | 10.4 | 27.2 | 6.3 | 20.3 | 7.8 | 16.7 |
| 2015-09-22 | 6.1 | 24.0 | 10.0 | 26.0 | 11.2 | 28.7 | 10.1 | 23.6 | 7.0 | 18.6 | 7.5 | 15.0 |
| 2015-09-29 | 8.0 | 22.7 | 9.3 | 24.8 | 10.2 | 30.5 | 9.3 | 22.9 | 7.1 | 18.6 | 8.1 | 15.1 |
| 2015-10-06 | 8.2 | 22.1 | 8.7 | 23.1 | 11.9 | 30.7 | 9.2 | 21.1 | 7.3 | 16.6 | 8.3 | 13.4 |
| 2015-10-13 | 8.6 | 21.9 | 8.8 | 23.4 | 12.8 | 32.3 | 8.7 | 20.5 | 6.9 | 15.8 | 7.9 | 12.6 |
| 2015-10-20 | 8.8 | 20.9 | 9.1 | 23.4 | 14.1 | 30.9 | 8.5 | 19.8 | 6.5 | 15.9 | 7.7 | 12.6 |
| 2015-10-27 | 8.9 | 20.4 | 9.4 | 22.8 | 13.9 | 29.3 | 8.6 | 18.9 | 6.4 | 15.3 | 7.6 | 11.6 |
| 2015-11-03 | 9.0 | 20.6 | 10.8 | 24.9 | 12.3 | 29.8 | 9.0 | 19.6 | 6.9 | 16.1 | 7.2 | 12.1 |
| 2015-11-10 | 9.1 | 21.4 | 10.6 | 28.4 | 12.3 | 29.5 | 9.0 | 20.9 | 7.0 | 16.7 | 7.1 | 12.4 |
| 2015-11-17 | 8.9 | 22.4 | 9.5 | 31.3 | 11.9 | 29.4 | 8.7 | 22.7 | 6.9 | 18.1 | 7.5 | 13.7 |
| 2015-11-24 | 9.3 | 22.6 | 9.6 | 33.4 | 12.8 | 26.4 | 8.7 | 23.5 | 6.6 | 18.5 | 7.7 | 14.1 |
| 2015-12-01 | 9.1 | 22.9 | 9.0 | 36.1 | 12.6 | 25.0 | 8.6 | 25.8 | 5.5 | 19.9 | 7.8 | 15.4 |
| 2015-12-08 | 8.8 | 22.3 | 8.7 | 35.1 | 10.7 | 22.0 | 8.5 | 25.2 | 5.2 | 19.1 | 8.6 | 14.5 |
| 2015-12-15 | 8.6 | 22.9 | 9.7 | 35.4 | 8.7 | 22.0 | 9.1 | 25.5 | 4.8 | 17.7 | 7.6 | 14.9 |
| 2015-12-22 | 8.2 | 24.2 | 9.5 | 36.7 | 8.3 | 23.9 | 9.2 | 26.4 | 3.7 | 17.8 | 7.5 | 16.0 |
| 2015-12-29 | 8.3 | 24.6 | 9.5 | 38.3 | 8.5 | 25.8 | 9.2 | 27.0 | 4.0 | 22.3 | 7.7 | 17.4 |
| 2016-01-05 | 8.3 | 25.6 | 9.7 | 38.0 | 8.3 | 26.4 | 9.6 | 27.3 | 3.4 | 23.0 | 7.0 | 17.9 |
| 2016-01-12 | 8.2 | 25.4 | 8.6 | 37.4 | 9.4 | 25.9 | 8.8 | 28.1 | 3.5 | 24.3 | 8.2 | 19.0 |
| 2016-01-19 | 8.4 | 24.3 | 8.4 | 33.6 | 9.0 | 22.9 | 8.3 | 26.9 | 5.3 | 23.5 | 8.7 | 18.0 |
| 2016-01-26 | 8.6 | 23.5 | 8.1 | 31.4 | 9.6 | 21.5 | 7.9 | 27.5 | 6.8 | 23.9 | 8.9 | 18.4 |
| 2016-02-02 | 9.2 | 22.1 | 8.0 | 28.7 | 11.0 | 18.9 | 7.5 | 26.6 | 8.6 | 22.9 | 9.2 | 17.5 |
| 2016-02-09 | 9.5 | 21.6 | 8.8 | 27.7 | 11.2 | 17.9 | 7.6 | 26.4 | 9.8 | 21.7 | 8.5 | 16.4 |
| 2016-02-16 | 9.5 | 22.0 | 8.8 | 27.4 | 11.2 | 17.6 | 7.6 | 26.1 | 9.8 | 21.1 | 8.5 | 15.8 |
Source: NRCan
Crude Oil Overview
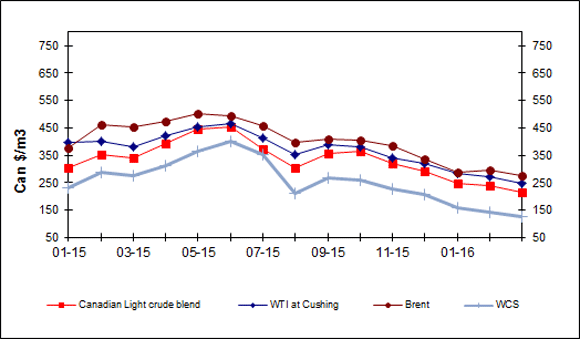
For the two weeks ending February 16, 2016, prices for the three light crude benchmarks averaged between CAD$225.50 /m3 and CAD$284.53/m3 (U.S.$25.89 and U.S.$32.66 per barrel).
Canadian light crude oil prices at Edmonton decreased by CAD$9.86/m3 (U.S.$0.50 per barrel) from two weeks ago, West Texas Intermediate (WTI) decreased by CAD$16.30/m3 (U.S.$1.22 per barrel) and Brent decreased by 0.26 /m3 (an increase of U.S.$0.65 per barrel).
The differential between Canadian light crude and WTI for the two weeks ending two weeks ending February 16,2016 was CAD$30.71/m3, (U.S.$3.52 per barrel), a slight decrease from the previous two weeks where it averaged CAD$37.15/m3 (U.S.$4.24 per barrel). Meanwhile, for the same period, the differential between Canadian light crude and Brent was CAD$59.02/m3 (U.S.$6.77 per barrel). This differential increased from the previous two week period where it averaged CAD$49.43/m3 (U.S.$5.62 per barrel).
The discount for Canadian heavy oil, as measured by the Western Canadian Select price differential to WTI averaged CAD$118.02/m3 (U.S.$13.55 per barrel) for the two weeks ending February 2, 2016.
For the week ending February 10,2016 the U.S. Energy Information Administration (EIA) data showed that U.S. crude inventories decreased by 0.8 million barrels, with total stocks reaching 502.0 million barrels. U.S. crude oil inventories remain near record levels for this time of year.
EIA data also show U.S. refinery utilization was lower, reaching 86% for the week ending February 10,2016, down from 89% the previous week.
Figure 6: Crude Oil Price Comparisons
Text version
Figure 6
This graph shows crude oil prices for Canadian Light Sweet, WTI, Brent and WCS. The average weekly prices for the week of February 8, 2016, were $216.42/cubic metres, $245.97/cubic metres, $275.22/cubic metres and $127.28/cubic metres for the Canadian Light, WTI, Brent and WCS, respectively.
| Dates | Canadian Light Sweet |
WTI | Brent | WCS |
|---|---|---|---|---|
| 01/13 | 549.97 | 592.14 | 699.83 | 387.55 |
| 02/13 | 553.76 | 605.29 | 736.06 | 370.93 |
| 03/13 | 560.66 | 598.93 | 705.36 | 430.10 |
| 04/13 | 571.20 | 590.06 | 663.78 | 441.27 |
| 05/13 | 598.81 | 608.31 | 662.59 | 519.16 |
| 06/13 | 577.25 | 630.51 | 680.52 | 489.10 |
| 07/13 | 664.03 | 685.36 | 703.73 | 592.16 |
| 08/13 | 665.21 | 697.44 | 722.47 | 595.65 |
| 09/13 | 647.06 | 691.84 | 723.16 | 543.60 |
| 10/13 | 592.41 | 655.54 | 713.92 | 483.77 |
| 11/13 | 511.65 | 620.13 | 711.21 | 413.23 |
| 12/13 | 524.69 | 655.42 | 740.65 | 394.48 |
| 01/14 | 561.87 | 651.27 | 735.43 | 452.06 |
| 02/14 | 665.35 | 699.89 | 756.56 | 566.93 |
| 03/14 | 655.67 | 701.90 | 752.47 | 554.81 |
| 04/14 | 647.62 | 704.92 | 747.57 | 550.77 |
| 05/14 | 652.85 | 697.62 | 748.13 | 566.87 |
| 06/14 | 665.50 | 715.93 | 762.22 | 589.57 |
| 07/14 | 629.45 | 690.70 | 730.08 | 558.81 |
| 08/14 | 606.25 | 660.32 | 710.46 | 507.84 |
| 09/14 | 608.92 | 644.03 | 681.65 | 515.00 |
| 10/14 | 551.84 | 594.78 | 621.20 | 497.90 |
| 11/14 | 474.20 | 540.12 | 569.75 | 447.90 |
| 12/14 | 378.11 | 430.68 | 459.36 | 313.77 |
| 01/15 | 304.92 | 359.85 | 377.71 | 232.32 |
| 02/15 | 350.67 | 399.16 | 461.37 | 287.18 |
| 03-15 | 339.32 | 379.25 | 452.57 | 269.44 |
| 04-15 | 394.52 | 422.81 | 471.56 | 313.37 |
| 05-15 | 444.34 | 455.08 | 502.89 | 387.66 |
| 06-15 | 453.67 | 444.84 | 472.46 | 377.74 |
| 07-15 | 373.96 | 411.43 | 457.53 | 353.39 |
| 08-15 | 303.26 | 351.68 | 395.72 | 210.71 |
| 09-15 | 356.80 | 389.09 | 406.85 | 267.30 |
| 10-15 | 363.10 | 380.00 | 404.44 | 258.44 |
| 11-15 | 319.23 | 339.52 | 383.58 | 224.73 |
| 12-15 | 292.17 | 321.73 | 336.10 | 206.42 |
| 01-16 | 245.04 | 281.71 | 285.42 | 156.75 |
| Week of February 1 | 237.32 | 273.06 | 297.37 | 141.79 |
| Week of February 8 | 216.42 | 245.97 | 275.22 | 127.28 |
Sources: NRCan
| Crude Oil Types | Two- Weeks Ending: 2016-02-16 |
Change From: Two weeks prior |
Change From: Last Year |
|||
|---|---|---|---|---|---|---|
| $Can/ m3 |
$US/ bbl |
$Can/ m3 |
$US/ bbl |
$Can/ m3 |
$US/ bbl |
|
| Canadian Light | 225.50 | 25.89 | -9.86 | -0.51 | -123.52 | -14.09 |
| WTI | 256.21 | 29.41 | -16.30 | -1.22 | -145.26 | -21.69 |
| Brent | 284.53 | 32.66 | -0.26 | +0.65 | -168.60 | -25.01 |
| WCS | 138.19 | 15.86 | -9.97 | -0.79 | -158.76 | -21.93 |
Source: NRCan
Download the report
Fuel Focus - Printable Version [PDF, 322 KB]
To read Adobe Acrobat® files, you will need to download and install the free Acrobat Reader® software available from Adobe Systems Incorporated.
Page details
- Date modified: