
Energy Consumption Benchmark Guide: Cement Clinker Production
PDF Version (609 KB)
Cat. No.: M27-01-1464E
® Her Majesty the Queen in Right of Canada, 2001To receive additional copies of this publication, please write to
the following address:
Energy Innovators Initiative in Canada
Natural Resources Canada
Office of Energy Efficiency
Industrial, Commercial and Institutional Programs
580 Booth Street, 18th Floor
Ottawa ON K1A 0E4
Telephone: (613) 995-6950
Fax: (613) 947-4121
You can also view or order several of the Office of Energy Efficiency’s publications on-line. Visit our Energy Publications Virtual Library at oee.nrcan.gc.ca/publications/infosource/home/index.cfm?language=english.
The Office of Energy Efficiency’s Web site is at .
Industry Background
Cement is produced at 17 locations across Canada. The industry is concentrated in Ontario and Quebec with 10 of the 17 plants operating in these two provinces. British Columbia and Alberta have three and two plants, respectively. Single plants operate in Nova Scotia and Newfoundland. Canadian cement clinker production capacity is about 14.1 million tonnes per year. In 1998, clinker production totalled 12 million tonnes for a capacity use of 85 percent.
With more than 1100 ready-mixed and other plants across the country using Portland cement to make concrete, the industry employs some 22 000 people and generates more than $3 billion in annual sales. Almost one third of Canadian cement is exported.
The focus of this Guide is on energy used in the production of cement clinker; unlike finished cement, all plants produce clinker.
Most of the energy information in this report was provided by the Cement Association of Canada (formerly known as the Portland Cement Association of Canada). The Association captured much of the data from U.S. and Canadian Portland Cement Industry: Plant Information Summary for 1998, the last year for which data are available.
Historical Energy Use Profile
The cement industry has long recognized that the cost of energy can be significant, varying between 25 percent and 35 percent of total direct costs. Consequently, the industry is continuously investigating and adopting more energy-efficient technologies to improve its profitability and competitiveness. In particular, plants have moved steadily away from less energy – efficient wet process kilns toward the more fuel-efficient dry process kilns. The number of wet process kilns in production declined by more than 50 percent between 1990 and 1998. As of May 1999, only two wet kilns were still operating in Canada.
The industry has achieved additional energy efficiency gains by using preheaters and precalciners. These technologies have helped the industry reduce its energy consumption per tonne of cement by 30 percent since the mid-1970s.
The following table summarizes typical average fuel consumption for three kiln technology types.
| Kiln Type | Average Fuel Consumption (GJ/t) |
|---|---|
| Wet Kilns | 6.0 |
| Dry Kilns--Single-Stage Preheater | 4.5 |
| Dry Kilns--Multi-Stage Preheater | 3.6 |
Source: Hodlerbank, 1993. Present and Future Use of Energy in the Cement and Concrete Industries in Canada.
Three dry process kilns have also been shut down during the decade, but average kiln capacity has increased by 34 percent, further contributing to gains in energy efficiency.
Total Energy Use 1990-1998
The next table shows total energy use, total clinker production and energy use per tonne of clinker. In comparing the average for the first three years of the decade (1990, 1991 and 1992) with the average for the last three available data years (1996, 1997 and 1998) – thereby levelling fluctuations in capacity use – some interesting trends appear.
- The cement industry's total energy demand increased by 9.3 percent.
- Clinker production, however, rose by 26 percent.
- Therefore, energy use per tonne of clinker decreased by 14 percent over the nine-year period.
These energy efficiency gains reflect continued technology improvements (from wet process to dry process, including preheater/ precalciner additions), new installations and retrofits to increase average kiln capacity, and continuous improvement in general operating practices.
| 1990 | 1991 | 1992 | 1993 | 1994 | 1995 | 1996 | 1997 | 1998 | |
|---|---|---|---|---|---|---|---|---|---|
|
Total Energy Use (TJ) |
59611 | 53416 | 49269 | 47526 | 54992 | 60551 | 57533 | 57411 | 62400 |
|
Clinker Production (000 t) |
10509 | 8604 | 8655 | 8822 | 10395 | 11765 | 11154 | 12001 | 12083 |
| GJ/t | 5.67 | 6.21 | 5.69 | 5.39 | 5.29 | 5.15 | 5.16 | 4.78 | 5.16 |
Fuel Use Trends
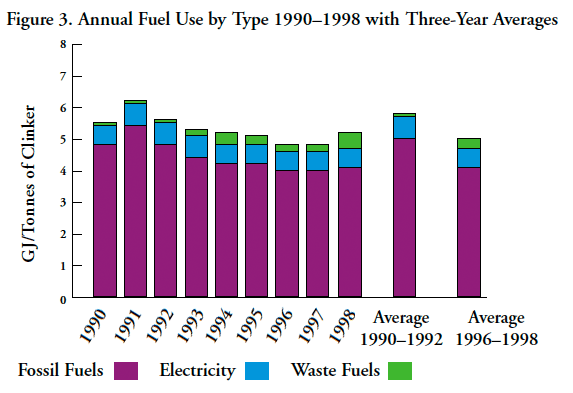
As shown in the following two pie charts, the breakdown of primary fuel use by type has not changed dramatically during the 1990s. In comparing the averages for the first three years of the decade to the averages for the 1996-1998 period, it is evident that coal and natural gas have held their place as the dominant fuels for generating process heat in the industry.
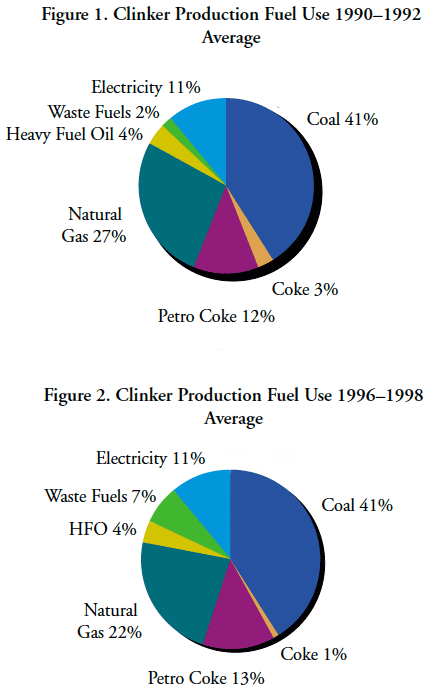
Text version - Figure1
Clinker Production Fuel Use 1990-1992 Average (pie chart). Coal 41%, Coke 3%, Petro Coke 12%, Natural Gas 27%, Heavy Fuel Oil 4%, Waste Fuels 2%, Electricity 11%.
Text version - Figure2
Clinker Production Fuel Use 1996-1998 Average (pie chart). Coal 41%, Coke 1%, Petro Coke 13%, Natural Gas 22%, HFO 4%, Waste Fuels 7%, Electricity 11%.
However, the share for natural gas decreased from 27 percent to 22 percent. This five-percent decline was mirrored by a five-percent increase in the use of waste materials, including wood wastes, tires and solvents.
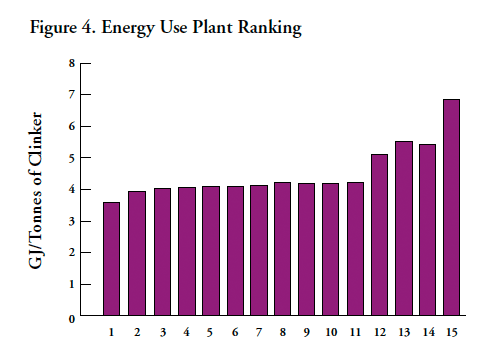
Figure 3 shows annual fuel consumption annually from 1990 to 1998 and as an average for the first and last three years of the time series by category. On closer inspection of the numbers behind these percentage shares, the following trends have been observed:
- Total coal use increased by 13 percent.
- Total natural gas use declined by 10 percent.
- The use of waste as fuel increased by 170 percent.
- Total electricity use increased by seven percent.
- Total fossil fuel use declined by 18 percent, and electricity use declined by 15 percent per unit of clinker.
Text version - Figure3
Annual Fuel Use by Type 1990-1998 with Three-Year Averages (bar chart). The X axis indicates each year, individually represented by a bar indicating the type of fuel used, in single year increments ranging from 1990 to 1998. The last two bars are labeled as Average 1990-1992 and Average 1996-1998. The Y axis indicates gigajoules per tonnes of clinker (GJ/T), ranging in single digit increments from 0 to 8.
1990: Fossil Fuels just under 5 GJ/T, Electricity approximately 5.5 GJ/T, Waste Fuels slightly above 5.5 GJ/T
1991: Fossil Fuels approximately 5.5 GJ/T; Electricity slightly above 6 GJ/T, Waste Fuels slightly below 6.5 GJ/T
1992: Fossil Fuels just under 5 GJ/T; Electricity slightly above 5.5 GJ/T, Waste Fuels slightly above 5.5 GJ/T
1993: Fossil Fuels approximately 4.5 GJ/T; Electricity slightly above 5 GJ/T, Waste Fuels just under 5.5 GJ/T
1994: Fossil Fuels slightly above 4 GJ/T; Electricity slightly below 5 GJ/T, Waste Fuels slightly above 5 GJ/T
1995: Fossil Fuels slightly above 4 GJ/T; Electricity slightly below 5 GJ/T, Waste Fuels approximately 5 GJ/T
1996: Fossil Fuels approximately 4 GJ/T; Electricity approximately 4.75 GJ/T, Waste Fuels slightly below 5 GJ/T
1997: Fossil Fuels approximately 4 GJ/T; Electricity approximately 4.75 GJ/T, Waste Fuels slightly below 5 GJ/T
1998: Fossil Fuels slightly above 4.25 GJ/T; Electricity slightly below 5 GJ/T, Waste Fuels slightly above 5 GJ/T
Average 1990-1992: Fossil Fuels approximately 5.25 GJ/T; Electricity approximately 6 GJ/T, Waste Fuels slightly above 6 GJ/T
Average 1996-1998: Fossil Fuels slightly above 4.25 GJ/T; Electricity slightly below 5 GJ/T, Waste Fuels approximately 5 GJ/T
The industry could reduce its dependence on fossil fuels even more if legislative conditions and consumer perceptions would allow increased use of waste fuels. Unfortunately, these major hurdles are not easily jumped.
Figure 4 helps cement plants compare their own energy use to that of other plants in the industry. The chart ranks individual plants from the most efficient (1) to the least efficient (15). To position your plant among the others in the industry, refer to your completed copy of the "Canadian Labour and Energy Input Survey" for 1998, or complete the table on page 10 with your most recent information to calculate your plant's per-unit energy use.
Text version - Figure4
The Energy Use Plant Ranking (bar chart) helps cement plants compare their own energy use to that of other plants in the industry.
Along the X axis, the chart ranks individual plants from the most efficient (1) to the least efficient (15) in terms of the number of gigajoules used per tonnes of clinker (GJ/T), ranging in single digit increments from 0 to 8 along the Y axis.
Plant 1 = slightly above 3.5 GJ/T
Plant 2 = just below 4 GJ/T
Plant 3 = approximately 4 GJ/T
Plant 4 = just above 4 GJ/T
Plant 5 = just above 4 GJ/T
Plant 6 = just above 4 GJ/T
Plant 7 = just above 4 GT/J
Plant 8 = just below 4.5 GJ/T
Plant 9 = just above 4 GT/J
Plant 10 = just above 4 GT/J
Plant 11 = just above 4 GT/J
Plant 12 = just above 5 GT/J
Plant 13 = approximately 5.5 GT/J
Plant 14 = just below 5.5. GT/J
Plant 15 = just below 7 GT/J
The energy use among the 15 plants depicted in Figure 4 varies from a low of 3.68 to a high of 6.87 gigajoules per tonne of clinker. The average energy use for the 15 plants is 4.69 GJ/t. But the average for the four most energy-efficient plants (upper quartile) is only 4 GJ/t. In other words, there is a 15-percent difference between the most efficient mills and the industry average. This significant difference suggests that many plants have ample room for energy efficiency improvements.
There are always extenuating circumstances and specific explanations for the differences in energy use among individual companies and plants – differences in raw resources, fuel types, kiln capacity, technology and general operating practices, for example. Improving energy use, however, is important to the industry and society, and it deserves more attention.
Improvement Challenges and Achievements
The cement sector has set a target for energy intensity improvement of 0.7 percent per year through the year 2000 (Canadian Industry Program for Energy Conservation/Cement Association of Canada). Although the industry is well on its way to surpassing this goal, further improvements are possible and required as the industry addresses its role and ongoing response to the evolving realities of climate change.
The member companies of the Cement Association of Canada have adopted a set of environmental principles, which re-dedicates the industry to pursuing energy efficiency improvements. Following are some recent examples of this continued dedication to energy efficiency improvement.
- Blue Circle Cement's Bowmanville facility replaced the inlet fan damper in its coal mill with a variable inlet vane damper. The resulting reduction in power consumption saved the company $75,000 in annual energy expenditures.
- Essroc Canada Inc. installed an electrical usage monitoring system, which is helping the Picton, Ontario, plant identify and improve its electrical energy use.
- Lafarge Canada has started up a new, energy-efficient dry kiln at its Richmond, British Columbia, plant to replace two of its older, energy-intensive wet kilns. Lafarge forecasts that energy use per tonne of clinker will be reduced by half.
- Tilbury Cement Limited in Delta, British Columbia, has eliminated approximately six percent of its fossil fuel consumption by recovering energy from waste oil and discarded tires.
Previous editions of the Canadian Industry Program for Energy Conservation annual report list many more examples of recent actions by industry members to conserve energy. There are also various government programs available to companies – often at little or no expense – to help identify and implement energy efficiency improvements. For example, Natural Resources Canada's Office of Energy Efficiency offers programs ranging from workshops on energy monitoring and tracking to on-site energy audits.
How to Benchmark Your Plant
1. Determine your plant's energy use per tonne of clinker, by fuel type. (See the table below for the calculation method if these data are not readily available.)
2. Compare your plant's per-tonne energy use with that of other cement plants (See Figure 4).
3 a. If your plant energy use is equal to or better than the top four plants (upper quartile) you are an energy use innovator. Keep it up by maintaining your energy monitoring program and excellent operating practices.
3 b. If your plant energy use ranks between 5 and 11 on the graph, your plant needs to invest more effort in determining how to improve energy use.
3 c. If your plant energy use ranks between 12 and 15, your plant is not as energy efficient as your competitors' plants, for many possible reasons. For example, raw resources with a high moisture content, small capacity kilns and older technology will all have a negative impact on your energy efficiency. It is likely that such structural difficulties will be addressed only as your plant modernizes its facilities and processes. In the meantime, you should direct your efforts toward maintaining – and strengthening, where necessary – your plant's operating practices to avoid any unnecessary energy waste.
Calculating Your Plant's Energy Use
(Gigajoules per Tonne of Clinker)
To calculate your plant's energy use per tonne of clinker and determine its relative position as compared to the other plants in the cement industry, complete the following table for your last full year of operation.
Calculating Your Plant's Energy Use (Gigajoules per Tonne of Clinker)
| Fuel Type | Qty Use for Year | Conversion Factor | Total GJ for the Year |
| Gasoline (000 L) | x 33.6 GJ/1000 L | ||
| Middle Distillates (000 L) | x 36.8 GJ/1000 L | ||
| Coal (tonnes) | x 28.066 GJ/t | ||
| Residual Oil (tonnes) | x 40.387 GJ/t | ||
| Natural Gas (000 m3) | x 34.313 GJ/1000 m3 | ||
| Petroleum Coke (tonnes) | x 32.701 GJ/t | ||
| LPG (000s of L) | x 22.851 GJ/1000 L | ||
| Electricity (mWh) | x 3.598 GJ/mWh | ||
| Waste Oil (000 L) | x 34.0 GJ/1000 L | ||
| Waste Solvents (t) | x 26.0 GJ/t | ||
| Waste--Tire-Derived (t) | x 27.0 GJ/t | ||
| Other | Specified by respondent | ||
| GRAND TOTAL | |||
|---|---|---|---|
|
Annual Clinker Production (t) |
|||
| Energy Use (GJ/t) | |||
Once you have completed the table and determined annual gross energy use in gigajoules, divide it by the tonnes of clinker produced in the year to yield gigajoules per tonne of clinker. You are now ready to compare your energy use with others in the industry as depicted in Figure 4.
Page details
- Date modified: