
2. SECTORAL ECONOMIC AND ENERGY PROFILES
Because of the volume of deliveries and the workforce size, the food and beverage industry plays a key role in the Canadian economy. The industry faces increasingly stiff competition and rising production costs. Therefore, any action designed to lower costs (including energy costs) will directly boost profitability and ensure sustainability.
This section describes the role played in the Canadian economy by the food and beverage industry in general, and the meat, dairy and beverage industries in particular.Footnote 7 Specifically, this section features a series of graphical representations of data on energy consumption (trend over recent years, breakdown between electricity and fossil fuels, unit consumption, distribution by province, etc.) and water use. The various stages in the manufacturing of their main products are also represented in flow chart form.
2.1 Classification of the Canadian food and beverage industry
Canada’s food and beverage industry is one of the pillars of the domestic economy, in terms of both its volume of deliveries and the number of jobs it provides in most Canadian provinces. It covers a broad array of the industrial activities catalogued in the North American Industry Classification System (NAICS).
Table 2-1 groups the various sectors of activity in the Canadian food and beverage industry according to the NAICS codes assigned to them. Note that we have paid special attention to Dairy Product Manufacturing (NAICS 3115), Meat Product Manufacturing (NAICS 3116) and Beverage Product Manufacturing (3121).
| Sector of activity | NAICS code | Addressed in this guide |
|---|---|---|
| Food Manufacturing | 311 | |
| Animal Food Manufacturing | 3111 | |
| Grain and Oilseed Milling | 3112 | |
| Sugar and Confectionery Product Manufacturing | 3113 | |
| Fruit and Vegetable Preserving and Specialty Food Manufacturing | 3114 | |
| Dairy Product Manufacturing | 3115 | |
| Dairy Product (except Frozen) Manufacturing | 31151 | |
| Fluid Milk Manufacturing | 311511 | x |
| Butter, Cheese, and Dry and Condensed Dairy Product Manufacturing | 311515 | x |
| Ice Cream and Frozen Dessert Manufacturing | 31152 | x |
| Meat Product Manufacturing | 3116 | x |
| Animal Slaughtering and Processing | 31161 | x |
| Animal (except Poultry) Slaughtering | 311611 | x |
| Rendering and Meat Processing from Carcasses | 311614 | x |
| Poultry Processing | 311615 | x |
| Seafood Product Preparation and Packaging | 3117 | |
| Bakeries and Tortilla Manufacturing | 3118 | |
| Other Food Manufacturing | 3119 | |
| Beverage and Tobacco Product Manufacturing | 312 | |
| Beverage Manufacturing | 3121 | x |
| Soft Drink and Ice Manufacturing | 31211 | x |
| Breweries | 31212 | x |
| Wineries | 31213 | |
| Distilleries | 31214 | |
| Tobacco Manufacturing | 3122 |
Other subsectors of the food and beverage industry, though not specifically addressed here, could also benefit from this guide since some of the opportunities for improving energy efficiency are generic and directly transferrable.
2.2 Profile of the food manufacturing industry
According to Statistics Canada, sales (deliveries) for the entire manufacturing sector in Canada (NAICS 31 to 33) grew from $347 billion in 1994 to $551 billion in 2003, representing an annual growth rate of 5.3 percent. The corresponding energy cost rose at an annual rate of 5.8 percent, from $9 to $15 billion.
During that same period, deliveries from the food manufacturing sector (NAICS 311) increased from $43.1 to $65.0 billion, for an annual growth of 4.7 percent. This is the second largest manufacturing sector in Canada, exceeded in size only by transportation equipment manufacturing. It is in first place in all Canadian provinces except Ontario, British Columbia and New Brunswick, where it ranks second.
In 2003, this sector employed 244 200 people (201 200 production workers and 43 000 administrative staff) at 5340 principal establishments.Footnote 8 The number of employees varies widely across establishments, from a mere handful in the smallest to hundreds, even more than a thousand, in the largest. In the food manufacturing sector, the average is between 25 and 75 employees. Though it spans the country, the food manufacturing industry is concentrated most in Ontario (40 percent of deliveries, 31 percent of establishments, 36 percent of employees), Quebec (22, 26, and 22 percent, respectively), Alberta (13, 9, and 9 percent, respectively) and British Columbia (7, 13, and 8 percent, respectively).
Figure 2-1 – Deliveries by province: Food Industry (NAICS 311)
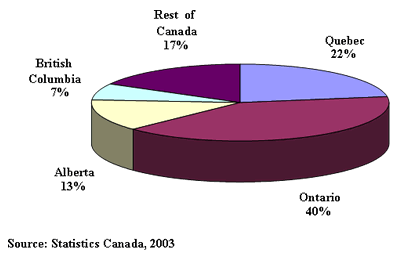
Figure 2-2 – Breakdown of deliveries: Food Industry (NAICS 311)
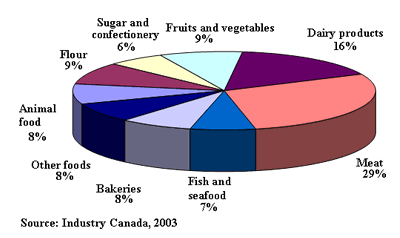
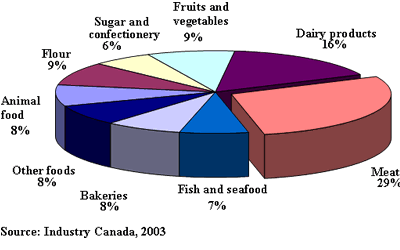
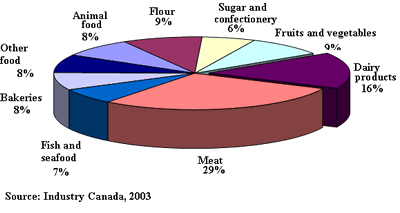
The sector is dominated by meat and poultry processing (29 percent) and dairy product manufacturing (16 percent), with other activities accounting for 6 to 9 percent each.
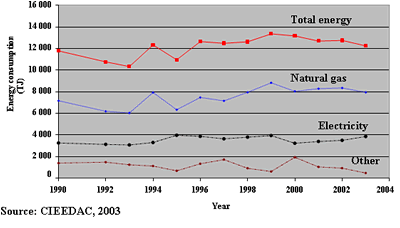
In 2003, energy consumption in the food related industry amounted to 94 250 terajoules (TJ) (26 180 gigawatt-hours [GWh]), or approximately 3.7 percent of the total energy consumed by Canada’s manufacturing sector (excluding mining). This energy consumption is up approximately 12 percent from 1990, but down 1 percent from 1994. In fact, since 1994, energy consumption has fluctuated.
Also in 2003, the energy bill accounted for 2.2 percent of total production costs (materials and equipment accounted for 86 percent and wages for 11 percent).
Figure 2-3 – Trends in energy consumption: Food Industry (NAICS 311)
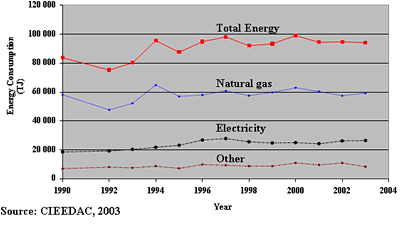
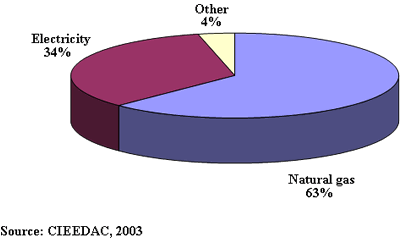
Figure 2-4 – Breakdown of energy sources: Food Industry (NAICS 311)
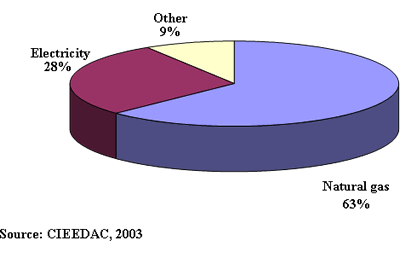
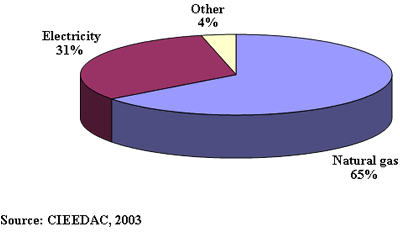
Natural gas is the primary energy source used in food-related industries, accounting for 63 percent of the sector’s energy regimen (59 300 TJ), well ahead of electricity at 28 percent (26 500 TJ).
Electricity and fuel costs in the sector totalled $1.2 billion, or 9 percent, of energy expenditure in the Canadian economy. Purchases of natural gas cost $484 million (37 percent of the energy bill and 73 percent of the fuel bill) and electricity consumption totalled $574 million (37 percent of the energy bill). Other fuels (mostly gasoline and petroleum products) accounted for $176 million.
The food industry is also a major consumer of water. In 2003, costs associated with water use in these processes totalled at least $91 million.Footnote 9 In the survey on the industrial use of water conducted by Environment Canada every five years, it was estimated that in 1996Footnote 10 food-related industries consumed 269 million cubic metres (Mm3) to meet their needs, representing a 22 percent decline from the 1991 level. The annual bill for this water totalled $110 million (or 11 percent of water expenditure in the Canadian manufacturing sector), distributed as follows:
| - Acquisition : | $68 million, or 62 percent of the total |
| - Wastewater treatment : | $28 million, or 25 percent of the total |
| - Feedwater treatment : | $8 million, or 8 percent of the total |
| - Recycling : | $5 million, or 5 percent of the total |
Note that, since 1996, costs associated with both water purchases and wastewater treatment rose considerably in many municipalities with the introduction of sewerage taxes.
From an energy perspective, the volume of water required 1.1 petajoules ($11 million in natural gas at the current price of $10 per gigajoule) for a 1°C increase in temperature. This rate illustrates the high energy demand associated with water consumption when water must be heated. The addition of this cost to delivery and treatment costs provides a strong incentive to reduce water consumption.
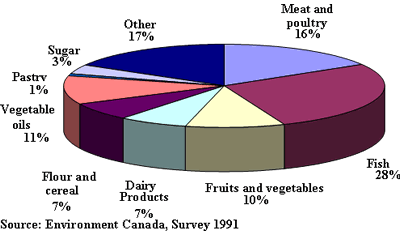
In the food-related industry, the five biggest users account for over 70 percent of the total water consumption: fish and seafood processingFootnote 11 (28 percent), meat and poultry (16 percent), vegetable oils (11 percent), fruits and vegetables (10 percent), and milk (7 percent).
Figure 2-5 – Breakdown of water use: Food Industry (NAICS 311)
2.2.1 Meat Product Manufacturing (NAICS 3116)
The meat processing industry is the largest employer in Canada’s food and beverage industry, with more than 66 300 employees (57 600 production workers and 8700 administrative staff) at 770 principal establishments – those with annual sales in excess of $30,000. On the one hand, most of these establishments (approximately 70 percent) have fewer than 50 employees and they often specialize in manufacturing specific products. On the other hand, 12 percent have more than 200 employees, and 22 percent have more than 500.
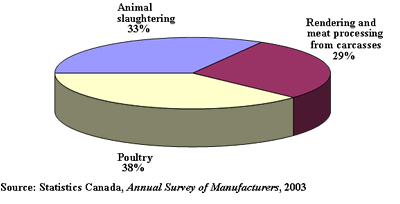
Figure 2-6 – Breakdown of deliveries: Food Industry (NAICS 311)
With sales of $18.6 billion in 2003, meat processing represents 29 percent of deliveries in the food manufacturing sector, placing it at the top, ahead of dairy processing (16 percent). The annual growth in deliveries (4.8 percent between 1994 and 2003) attests to the dynamism of this industry on both the domestic and the export markets. However, between 2002 and 2003, deliveries declined 1.3 percent.
Figure 2-7 – Breakdown of deliveries: Meat Processing Industry (NAICS 311)
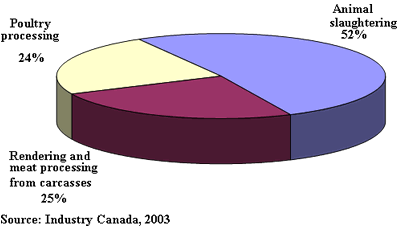
In Canada, the NAICS classification divides the meat and poultry sector into three categories:
- Animal (except Poultry) Slaughtering (NAICS 311611), representing a little over half of the sector’s deliveries
- Rendering and Meat Processing from Carcasses (NAICS 311614), representing one quarter of the sector’s deliveries
- Poultry Processing (NAICS 311615), representing also one quarter of the sector’s deliveries
According to Agriculture and Agri-Food Canada, in 2000, Canadians consumed an average of 35 kilograms (kg) of poultry (31 kg of chicken and 4 kg of turkey), 22 kg of pork and 23 kg of beef per capita. Note that more than 20 years ago, we ate twice as much beef as poultry. While there has been a steady decline in the consumption of red meat in Canada over the past 15 years, this change in Canadians’ eating habits has been offset by a sharp increase in exports.
In 2003, energy consumption in these three categories amounted to 17 400 TJ (3210 GWh), or approximately 18 percent of total energy consumption by Canada’s food sector – growing steadily from 1990 to 2001 and then falling off slightly.
Also in 2003, the cost of energy came to 1.6 percent of total production costs, while materials and equipment came to 86 percent and wages to 12 percent. Natural gas is the primary energy source used in the meat and poultry industry. At 63 percent (in physical units), it is well ahead of electricity, which accounts for 34 percent.
Total energy consumption by the meat processing industry equalled $277 million in 2003, including $143 million (or 52 percent) in electricity and $134 million (48 percent) in fuel. At 70 percent, natural gas is the primary source of thermal energy in the sector. Between 1994 and 2003, total spending on energy rose by an average of 8.4 percent annually, with the greatest average increase after 1999, largely due to repeated increases in energy costs.
Figure 2-8 – Trends in energy consumption: Meat Processing (NAICS 3116)
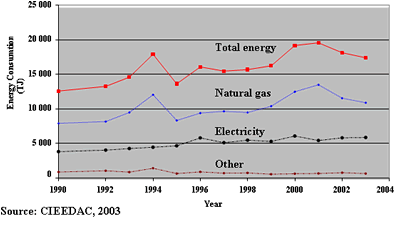
Figure 2-9 – Breakdown of energy sources: Meat Processing (NAICS 3116)
Because health regulations mandate a thorough rinsing of carcasses and frequent scrubbing of equipment and premises, the meat processing industry consumes large volumes of water. It is estimated that half of the water used in most slaughterhouses is heated to between 40°C and 60°C. Some applications, such as the sterilization of equipment and instruments, require even higher temperatures Thus, heating water contributes significantly to energy use, and any reduction in the use of hot water will cut costs associated with heating water, obtaining fresh water and treating wastewater.
Typical water consumption data are not available for the Canadian meat and poultry industry. In England, by contrast, precise values expressed in terms of litres of water per slaughtered animal are considered to represent sound practices. Such values are 700 to 1000 litres (L) for cattle, 160 to 230 L for pigs, 40 to 60 L for turkeys and 8 to 15 L for chickens.
Water requirements are virtually identical for the red meat sector (NAICS 311611) and the poultry sector (NAICS 311615) for uses that are essentially comparable and their water bills are $10 million and $11.6 million, respectively. Processing meat from carcasses and rendering animal fat, in turn, account for a little less that 30 percent of water-related expenditures in the meat sector.
Figure 2-10 – Breakdown of water expenditure: Meat Processing (NAICS 3116)
2.2.1.1. Animal (except Poultry) Slaughtering (NAICS 311611)
The animal slaughtering industry includes establishments that produce mainly beef and pork products and subproducts, which account for the bulk of their total revenue. It also includes other meat products, such as lamb, veal, horsemeat and game (except small game), as well as offal, fat and other saleable subproducts, provided they are produced at a slaughterhouse. All activities related to slaughtering and processing poultry, which fall under NAICS category 311615, are excluded.
With deliveries of $9.6 billion in 2003 (a year-over-year increase of 5.3 percent since 1994), animal slaughtering constitutes 52 percent of meat processing activity and 15 percent of food industry activity as a whole.
With more than 25 500 workers (23 200 production workers and 2300 administrative staff) at 224 establishments, animal slaughtering is also the biggest employer in the meat processing industry. Slaughterhouses average one hundred employees each and are principally located in Quebec, Ontario and Alberta, but are also in Manitoba and Saskatchewan. This activity is dominated by beef and pork products, which make up more than 95 percent of production.
Though the industry is found everywhere in Canada, it is highly concentrated in certain regions. In 2000, Quebec slaughtered the most pigs (34 percent of 19.6 million head), followed by Ontario (25 percent). Collectively, the Western provinces slaughtered 30 percent of the national total.
However, the West dominated the beef industry with 76 percent of Canada’s total of 3.3 million head slaughtered, followed by the East with 17 percent.
In 2003, energy accounted for 1.2 percent of total production costs, while supplies and equipment accounted for 90 percent and wages for 9 percent. Total energy costs totalled $105 million. At $59 million, electricity was the main energy-related expense of the animal slaughtering industry. In fact, it represented 56 percent of energy expenditures, surpassing natural gas at 37 percent, or $39 million. Natural gas represented 83 percent of fuel purchases, totalling $46 million.
In addition to requiring large amounts of electricity for refrigeration, animal slaughtering consumes large amounts of water, principally for washing carcasses and equipment. In 2003, the cost of water for this activity was $10 million, representing 33 percent of water expenditures in meat processing and 11 percent across the food industry as a whole.
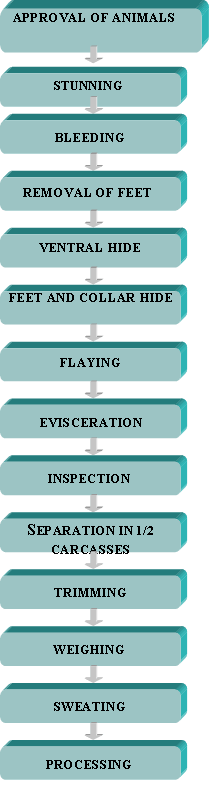
The flow charts in Figure 2-12 and 2-13 present the main steps in the slaughtering and processing of pork and beef, respectively.
Figure 2-11 – Breakdown of energy expenditure: Animal Slaughtering (NAICS 311611)
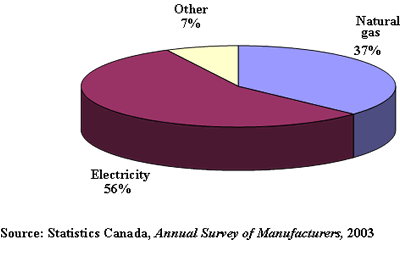
Figure 2-12 – Pork slaughtering and processing: main steps in the process
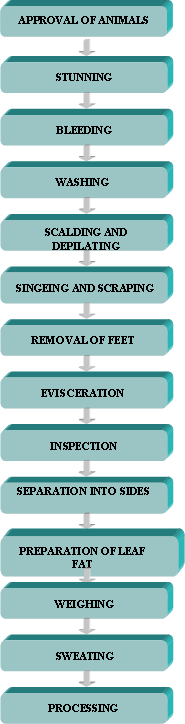
Figure 2-13 – Beef slaughtering and processing: main steps in the process
2.2.1.2 Rendering and Meat Processing from Carcasses (NAICS 311614)
This industry includes establishments engaged in processing animal fat, bone and raw meat from external slaughterhouses and preparing meat and meat subproducts from purchased carcasses. Since 1994, deliveries have increased at an average annual rate of 3.1 percent, reaching $4.7 billion in 2003, or 25 percent of the meat processing industry’s deliveries. This activity generates a high value-added of 32 percent for processed materials.
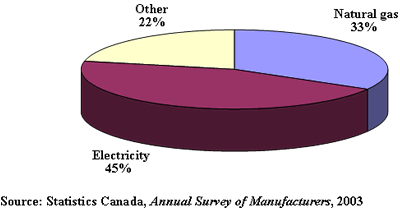
At 2.7 percent, energy accounted for a greater share of total production costs in this category in 2003 than in either of the other two categories in the meat processing industry, while supplies and equipment accounted for 82 percent and wages 15 percent. Total energy costs were $109 million, of which 45 percent ($49 million) was for electricity. At $36 million, natural gas represented 33 percent of the energy bill (or 61 percent of fuel purchases, which totalled $60 million). Other fuels used included gasoline and diesel.
Figure 2-14 – Breakdown of energy expenditure: Rendering and Meat Processing from Carcasses (NAICS 311614)
In 2003, the cost of water was $8.7 million, representing 29 percent of water expenditure in meat processing and 10 percent in the entire food industry.
2.2.1.3 Poultry Processing Industry (NAICS 311615)
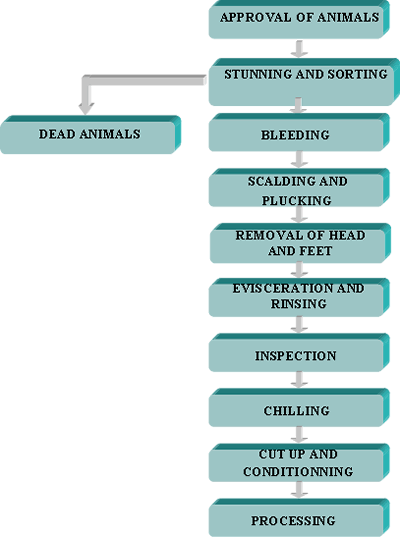
This industry deals with game birds as well as poultry (mostly chickens and turkeys, but also ducks, geese, Guinea fowl and quail). Its activities include the preparation of processed meat and poultry and small game meat by-products. The main steps in the process are depicted in Figure 2-16.
The value of deliveries from poultry processing increased 5.7 percent annually on average. In 2003, deliveries were $4.4 billion or 24 percent of deliveries in the meat processing industry and 6.7 percent in the food industry.
Poultry processing establishments are distributed throughout Canada, though there is a higher concentration in the centre. Ontario, Quebec and British Columbia account for three-quarters of domestic production (34, 27, and 15 percent, respectively). Poultry processing is highly concentrated, with the four largest processors being responsible for more than 50 percent of the industry’s output. Cooperatives are a key feature of this industry – two of them are among the four largest processors in the country.
Poultry deliveries are largely dominated by chicken, which accounted for approximately 75 percent of the sector sales in 2000. Turkey made up another 15 percent. In Canada, chicken production increased 53 percent between 1990 and 2000, reaching 874 million kg in 2000.
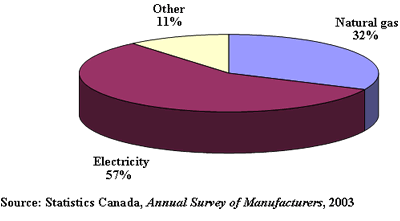
According to Statistics Canada’s Annual Survey of Manufactures, energy represented 1.6 percent of production cost in the poultry industry in 2003. Supplies and equipment accounted for 82 percent and wages for 16 percent.
Total energy costs were $63 million. At $36 million, electricity accounted for 57 percent, exceeding natural gas at $19 million, or 30 percent. Natural gas accounted for 70 percent of fuel purchases, which totalled $27 million.
Figure 2-15 – Breakdown of energy expenditure: Poultry Processing Industry (NAICS 311615)
Like animal slaughtering, the poultry industry uses large quantities of water to clean facilities and equipment. In 2003, water expenditures were $12 million, or 38 percent of water-related costs in meat processing.
Figure 2-16 – Poultry slaughtering and processing: main steps in the process
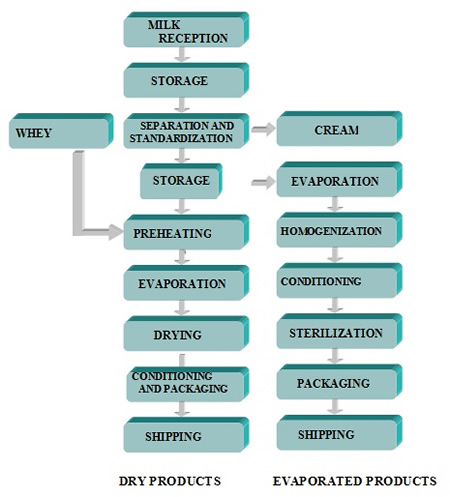
2.2.2 Dairy Product Manufacturing (NAICS 3115)
In terms of the volume of deliveries, Dairy Product Manufacturing (NAICS 3115) occupies second place in the Canadian food and beverage industry, surpassed only by meat processing. In 2003, dairies processed more than 75 million hectolitres (hL) of raw milk, for total sales of $10.4 billion, or approximately 16 percent of all food sales in Canada.
Figure 2-17 – Breakdown of deliveries: Food Industry (NAICS 311)
Approximately 20 500 people are employed by the 422 principal dairy establishments in Canada (15 800 production workers and 4700 administrative staff). From 1994 to 2003, employment in the sector shrank 12 percent because 3000 jobs were lost. However, the number of employees rose 5 percent between 2002 and 2003. If we include the 35 000 people who operate the 17 000 dairy farms, this sector is the second largest employer in the Canadian food industry, after meat processing.
Milk processing activities are largely concentrated in the centre of the country. In fact, more than 60 percent of establishments, accounting for 70 percent of domestic output, are located in Ontario and Quebec – Quebec being the Canadian province with the most establishments.
In terms of industry structure, cooperatives owned by farmer stockholders provide a substantial amount of the sector output. The rest is spread across businesses of various sizes. For several years, consolidation has been a trend in Canada’s dairy sector. Concentration is ongoing and multinational companies play an ever expanding role. Today, 15 percent of establishments are owned by three key companies that process 70 percent of the milk produced in Canada.
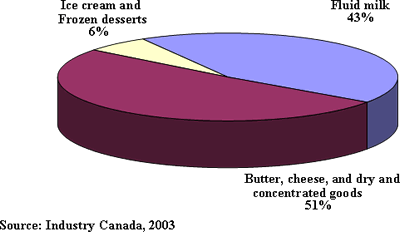
In Canada, the dairy product industry engages in three main activities, depending on whether the products are frozen (6 percent of deliveries) or fresh (94 percent of deliveries).
– Fluid Milk Manufacturing (NAICS 311511) involves 184 establishments that process 37 percent of the milk from Canadian farms. The primary activity is processing milk into consumer products (various types of table milk, all types of cream, yogurt, chocolate milk and buttermilk). With deliveries of $4.5 billion in 2003 (a year-over-year increase of 2.9 percent since 1994), fluid milk manufacturing constitutes 43 percent of the activity in the dairy product sector. Production is mostly concentrated in Ontario (33 percent), Quebec (26 percent), and Alberta and British Columbia (14 percent).
– Butter, Cheese, and Dry and Condensed Dairy Product Manufacturing (NAICS 311515) constitutes the industrial milk processing sector. At 180 establishments, it processes 63 percent of Canada’s milk into value-added products. With total sales of $5.3 billion in 2003 (a year-over-year increase of 4.3 percent since 1994), this sector accounts for 51 percent of deliveries from the dairy product sector. The industry is located mainly in Ontario and Quebec, with 80 percent of establishments generating 75 percent of deliveries.
– Ice Cream and Frozen Dessert Manufacturing (NAICS 31152) involves 58 establishments, with deliveries of $0.65 billion in 2003, or 6 percent of the dairy processing industry. The sector is dominated by Ontario, with 43 percent of establishments generating 69 percent of deliveries. Although it is much smaller than fluid milk and industrial milk processing, this activity features a high value-added, exceeding 40 percent.
Figure 2-18 – Breakdown of deliveries: Dairy Product Manufacturing (NAICS 3115)
In 2003, energy consumption in the dairy sector was 12 250 TJ, or approximately 12 percent of the energy consumed by Canada’s food and beverage sector (meat processing and beverages account for 16 and 11 percent, respectively). Compared with 1990, the sector reported an 18 percent increase in electricity consumption, while fuel consumption declined 2 percent. Overall, energy consumption increased 4 percent. During the same period, the volume of milk processed rose 2.8 percent.
Figure 2-19 – Trends in energy consumption: Dairy Product Manufacturing (NAICS 3115)
Natural gas is the primary energy source in the dairy sector. It accounts for 65 percent of energy use (in physical units), well ahead of electricity, which accounts for 31 percent.
Figure 2-20 – Breakdown of energy sources: Dairy Product Manufacturing (NAICS 3115)
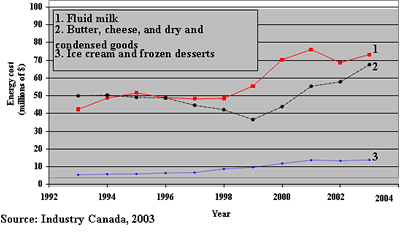
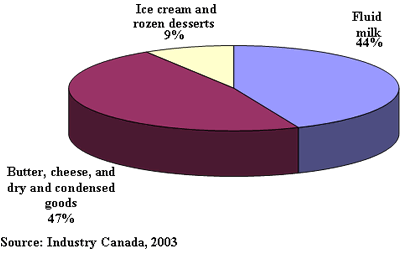
Fuel and electricity costs for the entire sector totalled $155 million in 2003 – an average annual increase of 4.4 percent since 1994. However, because of the steady rise in energy costs, this increase has been more pronounced since 1999. Energy expenditures are divided among Fluid Milk Manufacturing (NAICS 311511) and Butter, Cheese, and Dry and Condensed Dairy Product Manufacturing (NAICS 311515), at 44 percent ($68 million) and 47 percent ($73 million), respectively. Ice Cream and Frozen Dessert Manufacturing (NAICS 31152) accounts for only 9 percent ($14 million).
Figure 2-21 – Trends in energy costs: Dairy Product Manufacturing (NAICS 3115)
Over time, the share of natural gas has increased at the expense of other fuels, which, by 2003, accounted for only 5 percent of fuel use. Also in 2003, the energy bill accounted for 1.6 percent of total production costs, while materials and equipment accounted for 86 percent and wages for 12 percent.
However, the energy profiles of the two most energy-intensive sectors, fluid milk and industrial milk, differ considerably. In the fluid milk processing industry, electricity is the largest item on the energy bill, accounting for 59 percent. This amount is followed by natural gas at 24 percent and other fuels, including the gasoline used in distribution, at 17 percent. In contrast, in the industrial milk sector, natural gas tops the list at 49 percent of the total energy bill, followed by electricity at 37 percent and other fuels at 14 percent. This greater use of fuels in industrial milk processing is attributable to processes that are heavy thermal energy users, such as evaporating, concentrating and drying, which are not part of fluid milk processing.
In the frozen product sector, electricity dominates the energy bill even more than in fluid milk because the processes require much colder temperatures and thus more refrigeration. Electricity is estimated to represent 66 percent of the energy expenditure and natural gas 21 percent.
Figure 2-22 – Breakdown of energy expenditure: Dairy Product Manufacturing (NAICS 3115)
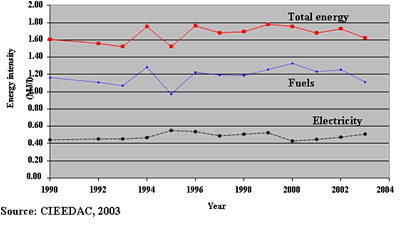
Between 1990 and 2003, energy intensity fluctuated but remained practically unchanged in the dairy product sector. CIEEDAC data shows that from 2000 to 2003, energy intensity for the entire industry was around 1.70 megajoules (MJ) per litre of processed milk (1.23 MJ/L for fuel and 0.46 MJ/L for electricity).
Figure 2-23 – Energy intensity: Dairy Product Manufacturing (NAICS 3115)
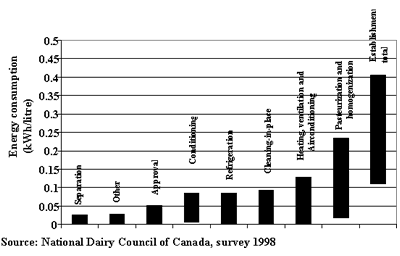
A 1998 survey of 17 Canadian establishments that produce fluid milkFootnote 12 found that the homogenization and pasteurization process is the most energy intensive (accounting for between 0.02 and 0.2 kWh/L, followed by heating, ventilating and cooling, equipment cleaning, and refrigeration and packaging (filling and labelling). The last two activities are very similar in energy consumption (up to 0.09 kWh/L).
Figure 2-24 – Breakdown of energy consumption: Fluid Milk Manufacturing (NAICS 311511)
| Sector of activity | Electrical energy intensity | Thermal energy intensity |
|---|---|---|
|
Fluit milk (NAICS 311511) |
0.2 kWh/l | 1.1 MJ/l |
|
Industrial milk (NAICS 311515) |
0.1 kWh/l | 1,1 à 1,4 MJ/l* |
|
*. varies depending on type of product |
||
Note: Even though the establishments targeted by the survey were among the largest in Canada, there were major differences in per unit energy consumption among them, indicating a wide disparity in the milk processing industry.
Milk processing also uses large amounts of hot water, mainly for pasteurizing milk and washing equipment. It is estimated that the energy used to heat water is more than 60 percent of the sector’s energy needs. In 2003, costs associated with using water in these processes were more than $10 million.Footnote 13 Based on its 1991 survey, Environment Canada estimates that the dairy industry’s water use is 37 percent for fluid milk and 63 percent for industrial milk, reflecting the same proportions as the volume of milk processed in each of these sectors.
Figure 2-25 – Fluid milk: main steps in the process
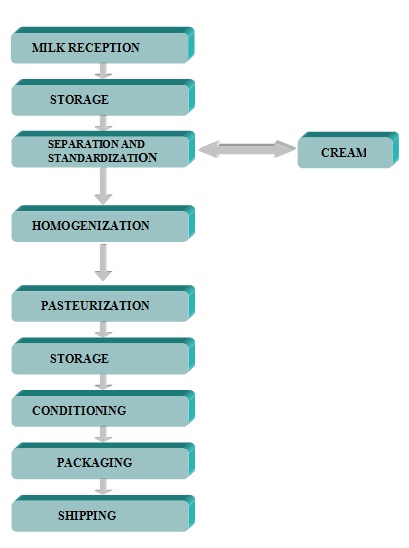
Figure 2-26 – Cultured dairy products (eg: yogurt): main steps in the process
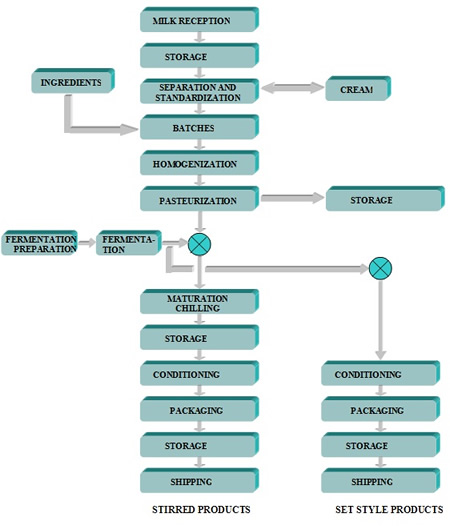
Figure 2-27 – Production of butter and ice cream: main steps in the process
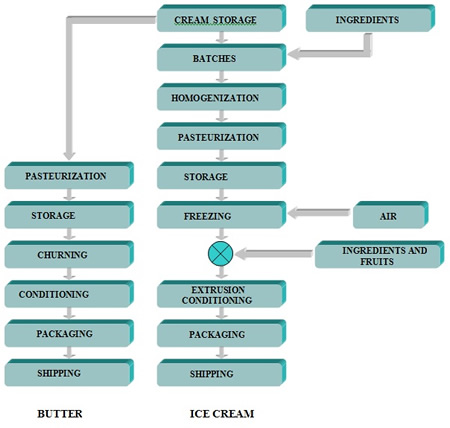
Figure 2-28 – Production of cheese: main steps in the process
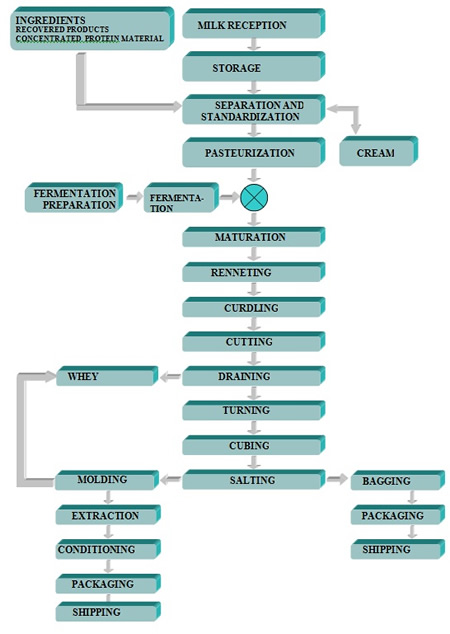
Figure 2-29 – Dry and Condensed Dairy Products: main steps in the process
2.2.3 Beverage Manufacturing (NAICS 3121)
The beverage sector includes soft drink manufacturers, breweries, wineries and distilleries. It does not include fruit and vegetable juices or milk-based drinks.
In 2003, the beverage industry generated $8.7 billion in sales, an average year-over-year growth of 3.0 percent since 1994 ($6.7 billion), but a 0.1 percent decrease from 2002 to 2003. For the volume of deliveries, beverage manufacturing occupies third place in the Canadian food and beverage industry, following meat processing and dairy products.
In Canada, this industry is dominated by beer and soft drinks, which together account for 82 percent of deliveries.
Figure 2-30 – Breakdown of Deliveries: Beverage Manufacturing (NAICS 3121)
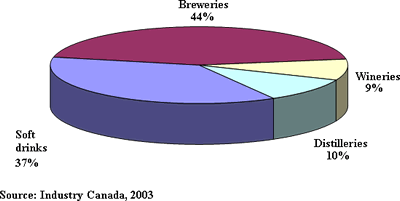
With sales of $3.9 billion in 2003, the brewing industry (NAICS 31212) alone accounted for nearly 45 percent of the Canadian beverage manufacturing industry, and 5.3 percent of the food and beverage sector.
Also in 2003, the soft drink industry (NAICS 31211) represented 37 percent of total deliveries in the beverage industry and 4.3 percent of sales in the Canadian food and beverage sector. At $3.2 billion, its sales were nearly 39 percent higher than 1994 levels, for an average year-over-year increase of 3.8 percent. However, between 2002 and 2003, deliveries decreased 0.2 percent.
According to Industry Canada, in 2003, the energy bill was 3.9 percent of total production costs (with materials and equipment at 73 percent and wages at 23 percent).Energy expenditure was $184 million, 33 percent for electricity and 46 percent for natural gas. The other fuels used were primarily gasoline and diesel (13 percent) and fuel oil (4 percent).
Figure 2-31 – Trends in energy cost: Beverage Manufacturing
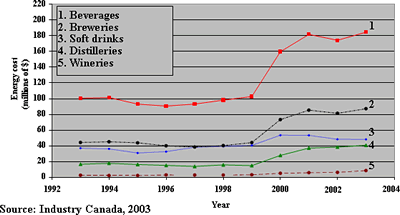
Figure 2-32 – Breakdown of energy expenditure: Beverage Manufacturing (NAICS 3121)
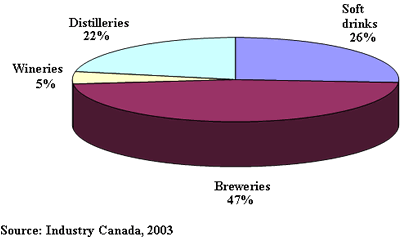
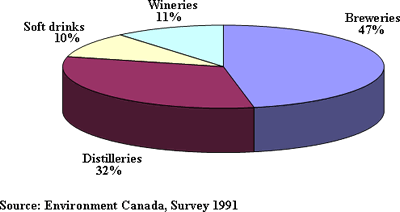
The bulk of energy expenditure in beverage manufacturing is by breweries (NAICS 31212), which account for 47 percent, followed by soft drink and ice (NAICS 31211) at 26 percent, distilleries (NAICS 31214) at 22 percent and wineries (NAICS 31213) at 5 percent.
The beverage industry is also a major consumer of water. In 2003, costs associated with water use in these processes were more than $23 million.Footnote 14 In its 1996 survey of industrial water use, Environment Canada estimated that the beverage industry used 73 Mm3 of water for its activities – the same quantity as in 1991.
The brewing sector alone accounts for nearly 50 percent of the beverage industry’s water demand, followed by distilleries at 30 percent, and soft drinks and wineries at 10 percent each.
Figure 2-33 – Breakdown of water use: Beverage Manufacturing (NAICS 3121)
2.2.3.1. Soft Drink and Ice Manufacturing (NAICS 31211)
The soft drink and ice industry includes establishments that make fruit-based beverages (except juices), filtered bottled water, soft drinks, ready-to-drink tea and ice. In 2003, the soft drink sector directly employed 9300 people in 190 establishments, representing 3.2 percent of establishments and 3.5 percent of jobs in the food and beverage sector.
This industry is characterized by a high degree of concentration that occurred in the 1990s. A recent tally showed that four large establishments are responsible for the largest share of deliveries in the sector. However, there are many small establishments that specialize in catering to market niches.
Production establishments are mostly concentrated in Ontario (26 percent), British Columbia (24 percent), Quebec (20 percent) and Alberta (12 percent).
In 1998, the output of Canadian establishments in this sector was 35.7 million hL, an increase of 51 percent over the 1991 level. During the same period, per capita consumption rose 23 percent to 116 L annually.
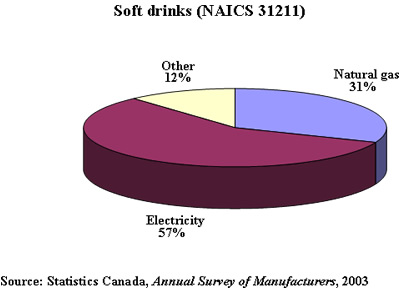
The energy bill for the soft drink industry was $48.2 million in 2003, i.e. 2.1 percent of the production cost and approximately 26 percent of the energy cost for the entire beverage manufacturing sector. From 1990 to 2003, the electricity and fuel cost rose at an annual rate of 3.3 percent and, during that same period, the value of deliveries increased at an annual rate of 3.8 percent, reaching $3.2 billion in 2003. Also in 2003, 57 percent of the energy expenditure was for electricity and 31 percent for natural gas.
As in the rest of the beverage sector, natural gas is the primary energy source used (in physical units). However, at 50 percent, its lead over electricity at 43 percent is slim. Other energy sources (heating oil, liquefied petroleum gas, gasoline, diesel) are much smaller, accounting for only 7 percent.
Figure 2-34 – Breakdown of energy expenditure: Soft Drink Manufacturing (NAICS 31211)
It thus appears that electricity occupies a more central role in the soft drink and ice sector than elsewhere in beverage manufacturing, because there is less use of heat and steam.
After a period of fluctuation showing no clear trend between 1991 and 1995, the energy intensity of the sector (i.e. the energy required to manufacture a hectolitre of soft drink) steadily declined between 1995 and 1998. The decline to 64 MJ/hL was more than 30 percent. However, this value is a rough average over all manufacturing activities in the sector and fails to capture the disparities between various types of production (soft drinks, filtered water, fruit drinks), all of which have very different energy requirements.
Figure 2-35 – Energy intensity: Soft Drink Manufacturing (NAICS 31211)
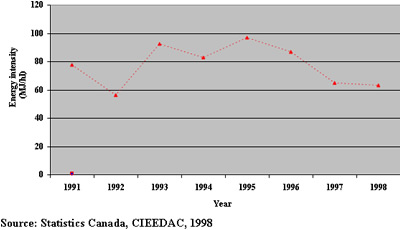
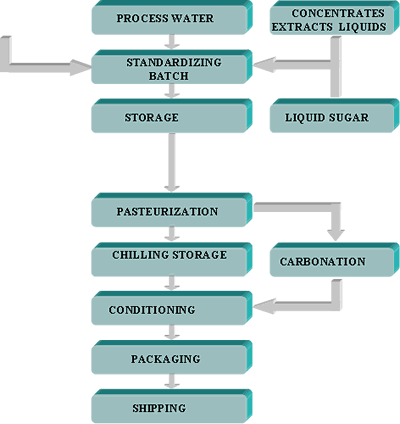
Figure 2-36 – Soft Drink Manufacturing: main steps in the process
2.2.3.2. Distilleries (NAICS 31214)
The distillery sector includes the manufacture of whisky, gin, rum, vodka and potable ethanol, and excludes the manufacture of distilled spirits and brandy.
In 2003, Canadian distilleries employed 2192 people directly at their 22 establishments, five of which had more than 200 employees. Sector activities are concentrated in Ontario (36 percent of distilleries responsible for 59 percent of deliveries), Quebec (27 percent of deliveries), Alberta (14 percent) and British Columbia (5 percent). In 2003, sector deliveries were $908 million, up from $855 million in 1994. The five biggest establishments combined produced 57 percent of sector deliveries.
Also in 2003, energy consumption by Canadian distilleries cost $41 million, accounting for 22 percent of the entire beverage industry (breweries accounted for 49 percent and soft drinks for 26 percent). From 1994 to 2003, energy-related expenditure (fuel and electricity purchases) posted an average annual increase of 9.6 percent. However, although these costs were relatively constant (even declining somewhat) from 1994 to 1999, they have increased since 2000 as a direct consequence of the increasing cost of natural gas and petroleum products. While the energy bill represented 3.8 percent of manufacturing costs in 1994, it was 8.0 percent in 2003 despite the sector’s efforts to increase energy efficiency.
Figure 2-37 – Trends in energy cost: distilleries (NAICS 31214)
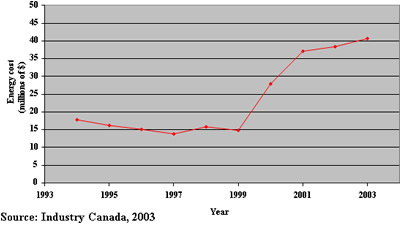
Figure 2-38 – Breakdown of energy expenditure: distilleries (NAICS 31214)
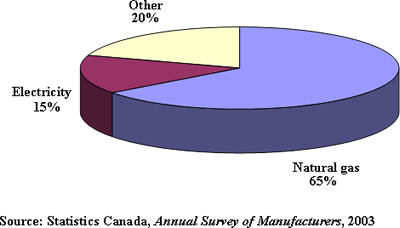
The five largest distilleries in Canada are responsible for 48 percent of the fuel and electricity expenditure in the sector. Their energy consumption was $19.5 million in 2003, $16.5 million for fuel (85 percent of the energy bill) and $3 million for electricity (15 percent). At 65 percent of fuel purchases, natural gas is the primary source of thermal energy in the sector.
The preponderance of fuel in the energy profile of distilleries is related to the use of thermal energy-intensive equipment such as distillation columns (that separate ethanol from other components after fermentation), evaporators (that concentrate the liquid portion of distillers’ grains) and dryers (that dry distillers’ grains).
Page details
- Date modified: