
High-Resolution Solar Radiation Datasets
Introduction
Solar radiation datasets with high spatial and temporal resolution have been developed. This data helps simulate solar photovoltaic system operation and study the short-term impact (< 5 minutes) of irradiance fluctuations on the energy production of a power plant or a neighbourhood of solar houses.
The measurement of solar radiation was performed at a high frequency (30-100 Hz or up to once every 10 milliseconds) to allow high ramp-rate events to be recorded. The datasets were retrieved from a network composed of 41 units that measure the solar irradiance, distributed among two systems at two Canadian sites. The first system is located in Varennes (Québec), and the second in Alderville (Ontario). The latter is co-located within a 1 MW sub-array of the 5 MW Alderville First Nations Solar Farm. These systems allow for the measurement of ground-level solar variability on a network of sensors distributed over a given surface.
Instrumentation and Sampling
The irradiance sensors are LI-COR LI-200S photodiode-type pyranometers installed on wirelessly communicating and autonomously powered remote units. Each unit has two irradiance sensors: the first for global horizontal irradiance, and the second for global tilted irradiance on an inclined plane. In Varennes, the inclined plane has a slope of 45° on the horizontal and faces south. In Alderville, the inclined plane has a slope of 30° on the horizontal (south-facing), which corresponds to the plane of irradiance for this array.
Each unit takes measurements every millisecond (1 ms), averages them over a period of 10 milliseconds, and saves the data when it changes by more than 5 W/m² since the last saved value. In addition, data is saved at 1-minute intervals. The units are synchronized using a GPS system to ensure that the unit-to-unit skew is less than 1 millisecond.
Data File Description
Data files are saved in CSV format (comma separated values) and correspond to each unit of the network. The system located in Varennes has 17 units, and 24 units are in Alderville.
Files are named by date and the identifier of the unit from which the data is collected. The location of each unit is saved in KML files, as described below. Data was taken on the date corresponding to the folder name containing the file (using the format yyyymmdd), from sunrise to sunset (civil twilight when the geometric centre of the sun is 6° below the horizon), for each unit of the corresponding site.
Table 1 shows the content of each column in the files.
| Column | Content | Format |
|---|---|---|
| 1 | Day | yyyy-mm-dd yyyy: year mm: month of the year (1-12) dd: day of the month (1-31) |
| 2 | Hour of the day, Eastern Standard Time (GMT-5:00) | HH:mm:ss.nnn HH: hours (0-23) mm: minutes (0-59) ss: seconds (0-59) nnn: milliseconds (0-999) |
| 3 | Global horizontal irradiance, in W/m² | Integer |
| 4 | Global tilted irradiance, in W/m² | Integer |
The available data corresponds to four categories of days observed in Varennes and Alderville. Table 2 categorizes the days based on cloud cover. Click on the date to download data files for the desired day type and location.
| Cloud cover | Varennes | Alderville |
|---|---|---|
| Clear sky | 2014-12-30 [ZIP 1.62 mb] | 2015-03-24 [ZIP 10.9 mb] |
| Overcast | 2014-10-21 [ZIP, 1.26 mb] | 2015-02-08 [ZIP, 1.29 mb] |
| Variable | 2015-02-26 [ZIP, 2.74 mb] | 2015-10-08 [ZIP, 4.65 mb] |
| Very variable | 2014-07-17 [ZIP, 10.5 mb] | 2015-08-12 [ZIP, 15.5 mb] |
KML Location File Description
Two KML files describe the location of each one of the 41 units in Varennes and Alderville. The file can be opened using Google Earth or the online tool Google Maps. The maps show the location of each unit on the two sites. Their coordinates are located at the bottom of this page.
Varennes Site
Because of the high sampling rate, the sensors are capable of measuring the effect of an obstruction passing over them, such as birds or insects. These events may cause a sudden drop in the measured irradiance on a unit. Some units are relatively close to obstructions (trees, power lines, etc.), which can also shade the sensors during certain times of the day and year. The identifier for the Varennes units begins with the letters VAR. The locations are shown in Figure 1.
Alderville Site
Similarly to Varennes, the sensors can be shaded, for instance, by birds or insects. However, the units are located in a more open area than in Varennes, and shading events caused by obstructions are less frequent. The identifier for the Alderville units begins with the letters AFN. The locations are shown in Figure 2 .
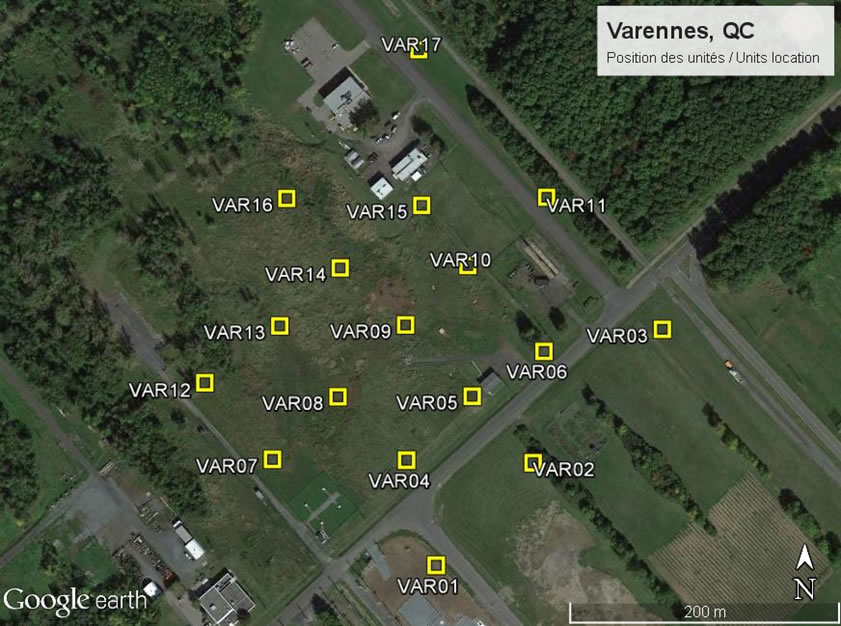
Figure 1 – Map showing the unit locations in Varennes
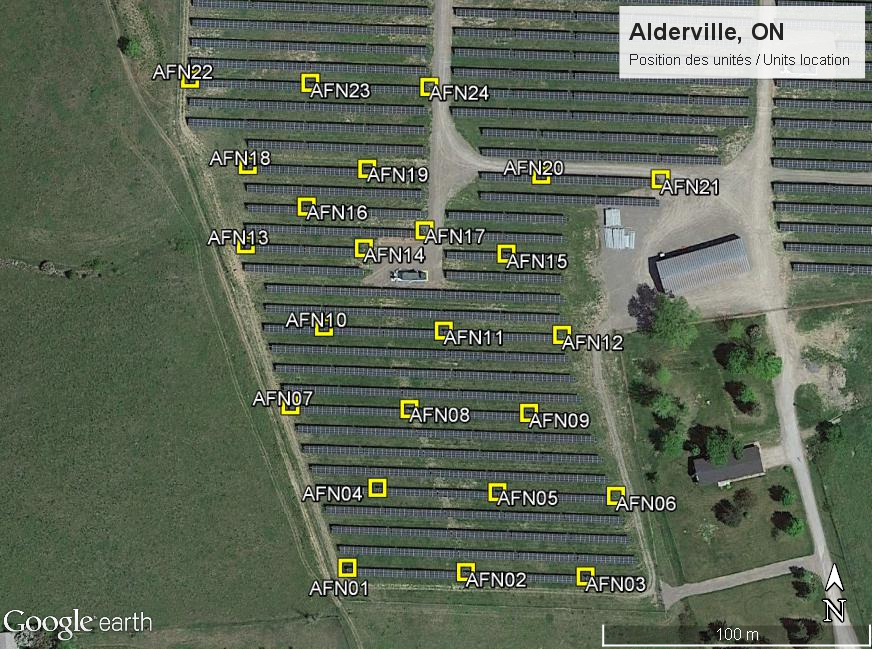
Figure 2 – Map showing the unit locations in Alderville, ON
Unit Coordinates
Tables 3 and 4 list the coordinates (latitude and longitude) of each unit. Units VAR01 to VAR17 are located in Varennes, and units AFN01 to AFN24 are located in Alderville.
| Unit identifier | Latitude (°) | Longitude (°) |
|---|---|---|
| VAR01 | 45.616084 | -73.386362 |
| VAR02 | 45.616760 | -73.385428 |
| VAR03 | 45.617659 | -73.384157 |
| VAR04 | 45.616777 | -73.386646 |
| VAR05 | 45.617206 | -73.386011 |
| VAR06 | 45.617509 | -73.385312 |
| VAR07 | 45.616783 | -73.387937 |
| VAR08 | 45.617202 | -73.387311 |
| VAR09 | 45.617689 | -73.386657 |
| VAR10 | 45.618096 | -73.386048 |
| VAR11 | 45.618569 | -73.385269 |
| VAR12 | 45.617297 | -73.388603 |
| VAR13 | 45.617682 | -73.387882 |
| VAR14 | 45.618080 | -73.387298 |
| VAR15 | 45.618513 | -73.386500 |
| VAR16 | 45.618561 | -73.387829 |
| VAR17 | 45.619610 | -73.386530 |
| Unit identifier | Latitude (°) | Longitude (°) |
|---|---|---|
| AFN01 | 44.190159 | -78.096701 |
| AFN02 | 44.190145 | -78.096148 |
| AFN03 | 44.190130 | -78.095589 |
| AFN04 | 44.190427 | -78.096561 |
| AFN05 | 44.190412 | -78.096000 |
| AFN06 | 44.190400 | -78.095447 |
| AFN07 | 44.190703 | -78.096967 |
| AFN08 | 44.190691 | -78.096411 |
| AFN09 | 44.190678 | -78.095852 |
| AFN10 | 44.190967 | -78.096811 |
| AFN11 | 44.190953 | -78.096251 |
| AFN12 | 44.190939 | -78.095698 |
| AFN13 | 44.191243 | -78.097176 |
| AFN14 | 44.191230 | -78.096624 |
| AFN15 | 44.191211 | -78.095958 |
| AFN16 | 44.191369 | -78.096892 |
| AFN17 | 44.191290 | -78.096341 |
| AFN18 | 44.191509 | -78.097167 |
| AFN19 | 44.191495 | -78.096609 |
| AFN20 | 44.191476 | -78.095796 |
| AFN21 | 44.191460 | -78.095238 |
| AFN22 | 44.191798 | -78.097437 |
| AFN23 | 44.191783 | -78.096875 |
| AFN24 | 44.191770 | -78.096319 |
Acknowledgments
The data was collected by the CanmetENERGY laboratory in Varennes, as part of the High-Resolution Solar Radiation Time Series Generation (RENI-506) project. The location for system installation in Varennes was provided by the Hydro-Québec Research Institute (IREQ). The field in Alderville was provided by the Ojibway Alderville First Nation. Funding for this project was provided by the Government of Canada through the ecoENERGY Innovation Initiative (ecoEII).
Page details
- Date modified: