
Climate and Climate-related Trends and Projections
2.1 TEMPERATURE AND PRECIPITATION
Regional trends in seasonal temperatures for Atlantic Canada show an overall warming of 0.3 °C from 1948 to 2005 (Lewis, 1997; Lines et al., 2003; Environment Canada, 2005c), with summers showing the greatest increase in temperature (+0.8 °C mean). Warming characterizes springs (+0.4°C) and autumns (+0.1°C), whereas winters have become colder (–1.0°C). Daily minimum temperatures show a slight increase (+0.3°C), but daily maximums have decreased more (–0.8°C). During the past 10 years, temperature trends in the northern North Atlantic region have become more similar to those of interior North America, showing increases.
Precipitation increased in Atlantic Canada by approximately 10% between 1948 and 1995 (Lewis, 1997), a trend that continued through the 1990s (Jacobs and Banfield, 2000; Lines et al., 2003). These average values, however, include much variation throughout the region.
Lines et al. (2003) and Lines and Pancura (2005) have analyzed projections of temperature and precipitation changes, using downscaling techniques for the Atlantic regions and ecozones. Recent analyses in support of this assessment were also conducted (see Figures 4, 5). These analyses indicate that anticipated change varies across the region, and that future diversity mirrors the present differences in climate among the ecozones, ecoregions and individual locations in the region.
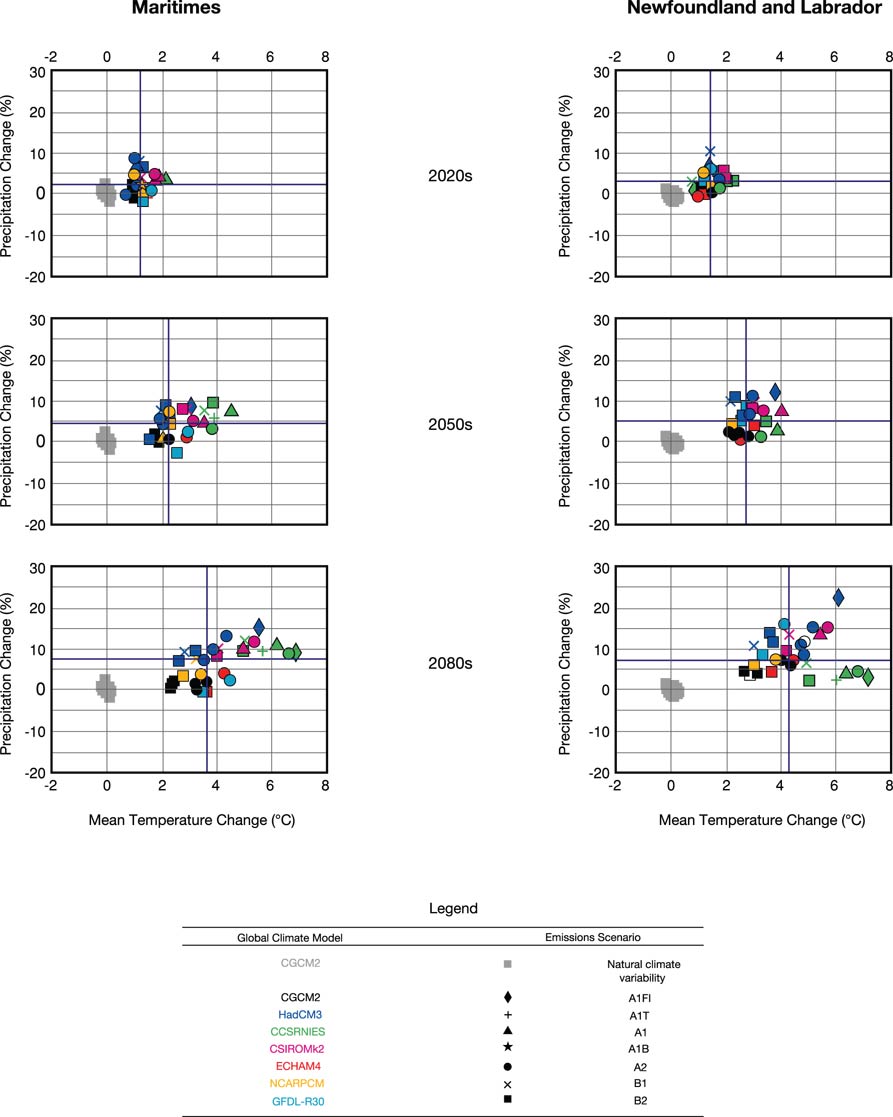
FIGURE 4a: Scatterplots of annual change in mean temperature and precipitation for the Maritimes (left) and Newfoundland and Labrador (right), as projected by a suite of climate models for the 2020s, 2050s and 2080s. Blue lines represent median changes in mean temperature and precipitation derived from suite of scenarios on plot.
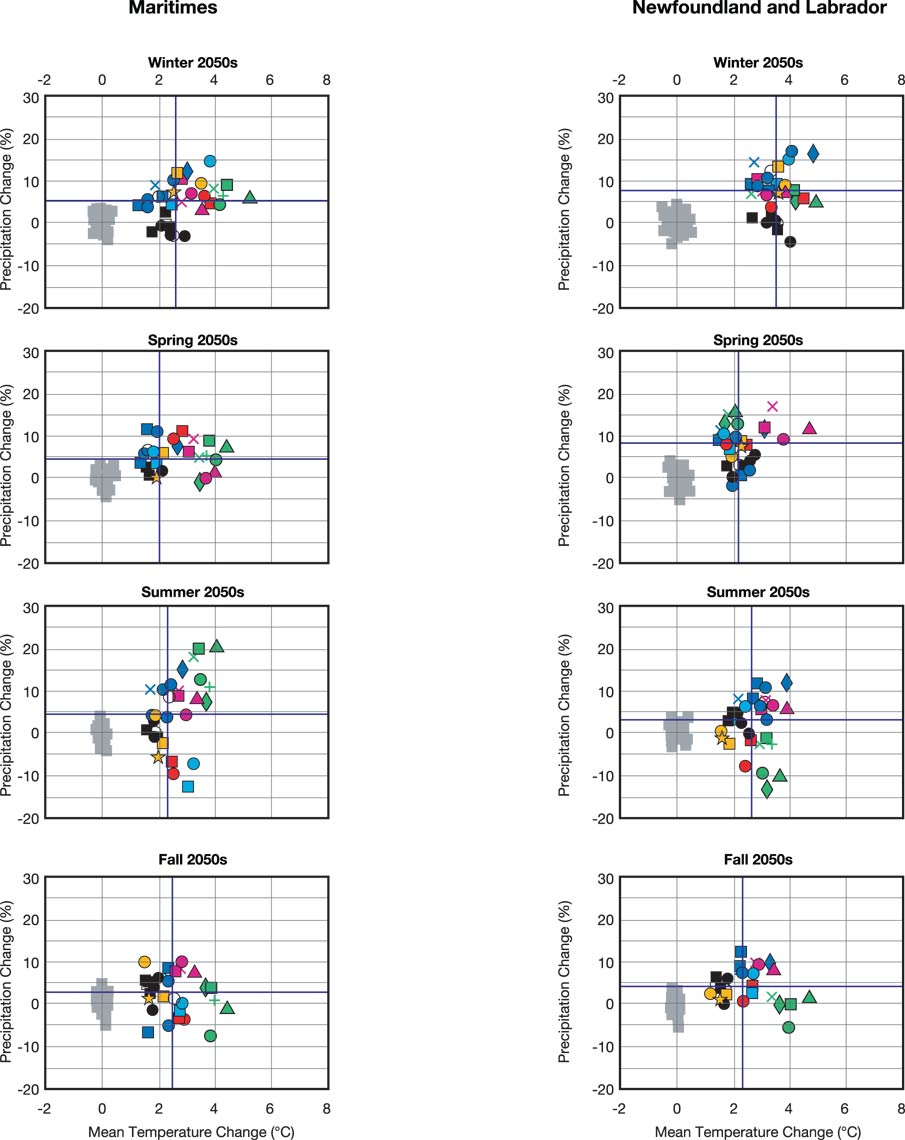
FIGURE 4b: Scatterplots of seasonal changes in mean temperature and precipitation for the Maritimes (left) and Newfoundland and Labrador (right), as projected by a suite of climate models for the 2050s. Blue lines represent median changes in mean temperature and precipitation derived from suite of scenarios on plot.
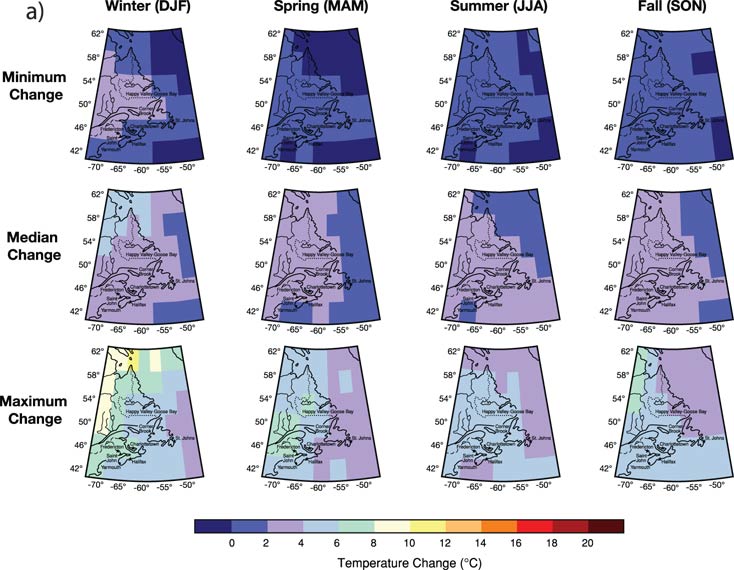
FIGURE 5a: Climate scenario maps of annual minimum, median and maximum temperature changes (ºC) for the 2020s, 2050s, 2080s. Capital letters in parentheses after the seasons represent the relevant months.
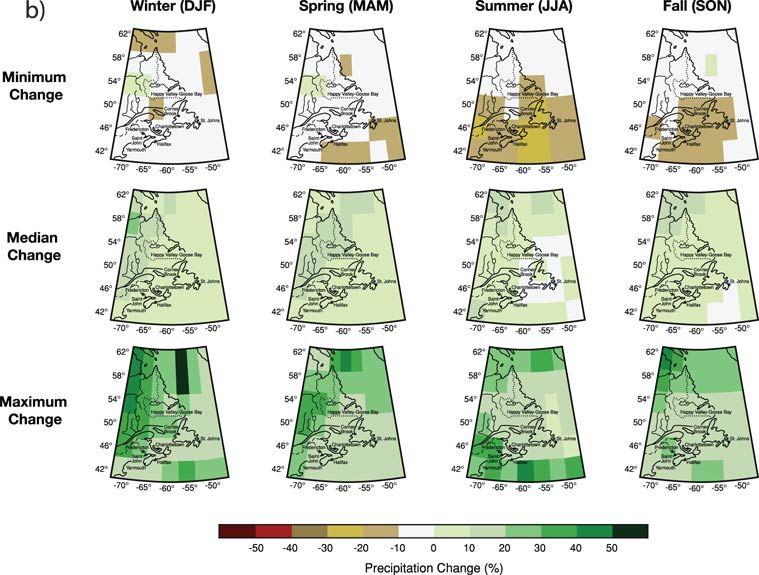
FIGURE 5b: Climate scenario maps of annual minimum, median and maximum precipitation changes (%) for the 2020s, 2050s, 2080s, as projected by a suite of climate models. Capital letters in parentheses after the seasons represent the relevant months.
Maritime Canada
Although there are important micro- and meso-scale variations between the climate projections, there are some general patterns that emerge. The Maritime Provinces are projected to experience increases in both mean annual temperature and precipitation (Figures 4, 5). By 2050, there would be a 2 to 4 C ° increase in summer temperature, depending on model inputs and geographic location. Future warming of 1.5 to 6 C ° during winter can be anticipated. Coastal areas would see lesser changes in temperature than would interior Nova Scotia and western New Brunswick. Precipitation in Maritime Canada is anticipated to increase in the future, continuing the trend established since 1948, but seasonal and yearly variations will become more evident. Drier summer conditions may characterize inland regions. For these areas, the change in rainfall may not offset the increase in evapotranspiration caused by higher summer temperatures.
Newfoundland and Labrador
Newfoundland and Labrador differs from Maritime Canada in terms of both present climate and projected changes. The influence of the Labrador Current and the variations associated with the NAO are critical influences (see Box 2 and Chapter 2). Coastal areas subject to the influence of the NAO differ substantially from interior areas, in terms of both their current conditions and their responses predicted for the future (Canadian Institute for Climate Studies, 1999 –2005). The interior areas of Labrador are subject primarily to continental influences, driven by the dominant southwesterly winds. Climate change anticipated for this region, with warmer and drier summers and warmer winters (see Figure 5; Environment Canada, 2005a–c; Flannigan et al., 2001; Canadian Institute for Climate Studies, 1999–2005), represents a continuation of patterns observed recently.
2.2 STORMS, STORM SURGES AND SEA-LEVEL RISE
The Atlantic region is subject to impacts from a wide range of seasonal and interannual events, including winter cyclonic storms, tropical cyclones and other severe weather events; summer heat and drought; early or late season frost; winter rain and thaw events; and river ice jams and flooding. There is evidence of recent trends toward greater extremes and higher frequencies of such events (e.g. Zhang et al., 2001; Beltaos, 2002; Bonsal and Prowse, 2003; Bourque et al., 2005; Bruce, 2005; Emanuel, 2005; Webster et al., 2005).
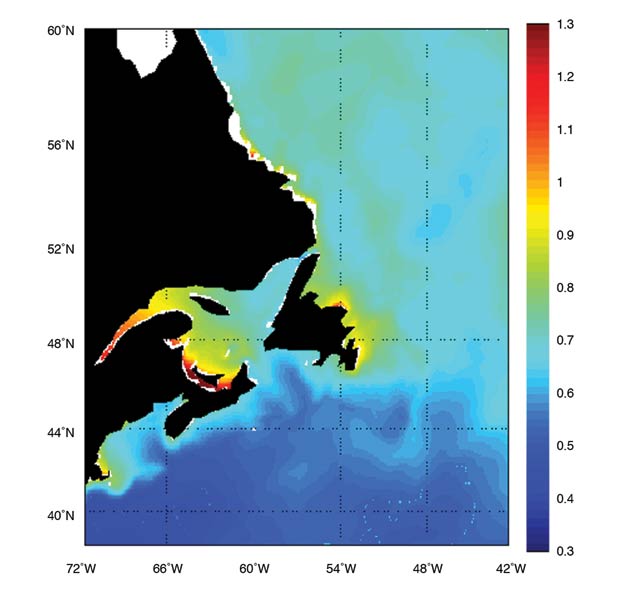
FIGURE 6: Spatial variability of storm surge with 40-year return period for the Atlantic coast of Canada, based on a 40-year hindcast (Bernier et al., 2006
A storm surge is defined as the elevation of the water resulting from meteorological effects on sea level. The storm-surge elevation is the difference between the observed water level during the storm and the level that the tide would normally rise to in the absence of storm activity (Forbes et al., 2004). During the past 15 years, storm surges have resulted in property destruction in all four Atlantic provinces (Taylor et al., 1996a, b, 1997; Forbes et al., 2000; McLean et al., 2001; McCulloch et al., 2002; Catto et al., 2003; Catto and Hickman, 2004; Smith et al., 2004a, b;Wright, 2004; Catto, in press). Figure 6 shows the geographic distribution of positive storm surge heights with a 40-year return period throughout the Atlantic region (Bernier et al., 2006). This shows that storm surges are higher in coastal waters, with highest levels in the southern Gulf of St. Lawrence and the St. Lawrence Estuary.
BOX 2 - Influence of the North Atlantic Oscillation on Newfoundland and Labrador
The North Atlantic Oscillation (NAO) is a cyclic variation in pressure regimes that influences northern North Atlantic environments and communities, including Newfoundland and Labrador (Hurrell, 1995; Topliss, 1997; Banfield and Jacobs, 1998; Delworth and Mann, 2000; Jacobs and Banfield, 2000; Kerr, 2000; Enfield et al., 2001; Marshall et al., 2001; Drinkwater et al., 2003; Hurrell et al., 2003; Catto and Catto, 2004, 2005; Catto 2006a, b, in press). A strongly positive NAO phase results in colder temperatures in Labrador, particularly along the coastline, and western Kalaallit Nunaat (Greenland). Positive NAO conditions also result in temperatures at or slightly below average along the eastern coastline of Newfoundland (Topliss, 1997; Catto et al., 2003). A positive NAO phase also produces strong northwesterly to northeasterly winds, varying with latitude from northern Labrador south to the Avalon Peninsula; large wind stresses on the ocean surface; low sea-surface temperatures (especially in winter); and extended areas and durations of pack ice and brash ice. The negative NAO phase produces the opposite effects, resulting in warmer drier winters, particularly with reduced snow cover, in Labrador and coastal Newfoundland. In recent years, there has been a trend towards a persistent strong positive NAO phase, which may be associated with greenhouse gas forcing (Kuzmina et al., 2005). Models also suggest that this influence may continue as carbon dioxide concentrations rise, although further research is needed to increase confidence in this hypothesis (Stephenson et al., 2006).
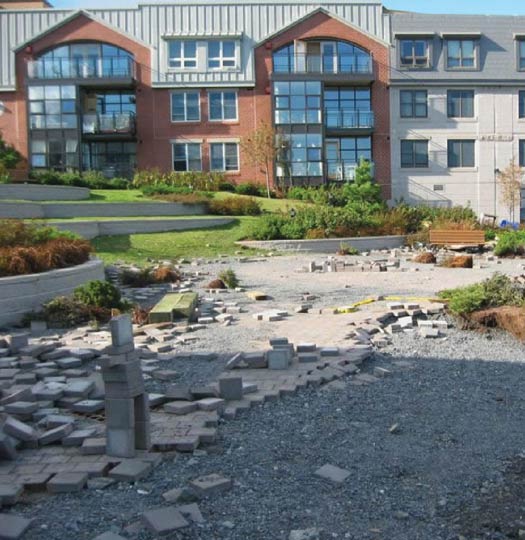
FIGURE 7: Damage from Hurricane Juan, Bishop's Landing, Halifax. Photo courtesy of Kyle McKenzie.
Parts of eastern New Brunswick are especially susceptible to storm surges (Shaw et al., 2001; Thompson et al., 2005). In the Beaubassin area of southeastern New Brunswick, claims made to the provincial government for damage to houses, cottages, wharves and other structures following a storm surge in January 2000 exceeded $1.6 million (Robichaud, 2000). Historical events, such as the Great Hurricane of 1775 in eastern Newfoundland (Stevens and Staveley, 1991; Stevens, 1995a) and the Saxby Gale of 1869 in the Bay of Fundy (Hutchinson, 1911; Abraham et al., 1999; Parkes et al., 1999), provide ample evidence of the impact of extreme storms and storm surges in Atlantic Canada. More recently, Hurricane Juan (2003), the most economically destructive hurricane event in Atlantic Canadian history, killed eight people and was responsible for at least $200 million in damage to Nova Scotia and Prince Edward Island (Environment Canada, 2004b; Figure 7).
The effect of any particular storm at a location depends upon the angle of wave attack, the number of previous events during the season, whether it is low or high tide and other local factors (Hayes, 1967). Adjacent beaches can exhibit very different responses to a particular storm, as was evident for southwestern Newfoundland beaches impacted by Hurricanes Gustav (2002) and Frances (2004), for eastern Newfoundland beaches struck by Hurricanes Bob (1991), Luis (1995) and Irene (1999), and for Prince Edward Island beaches affected by Hurricane Juan (2003). Beaches separated only by a headland varied widely in the amount of geomorphic response to storms (e.g. Catto et al., 2003).
The northern Atlantic Ocean has been undergoing an increase in hurricane frequency and magnitude since 1995 (Goldenberg et al., 1997, 2001; Landsea et al., 1998; Debernard et al., 2002; Emanuel, 2005; Webster et al., 2005). However, the relationship between changes in frequency and magnitude of hurricanes and increases in air temperature or sea surface temperature (SST) is not clear at present, and consensus does not exist among hurricane specialists. Although causal links between SST changes and hurricane frequency and strength have been suggested (e.g. Sugi et al., 2002; Trenberth et al., 2003; Knutsen and Tuyela, 2004; Trenberth, 2005), other researchers have expressed reservations and recognized uncertainties (e.g. Swail, 1997; Shapiro and Goldenberg, 1998; Pielke et al., 2005; Webster et al., 2005).
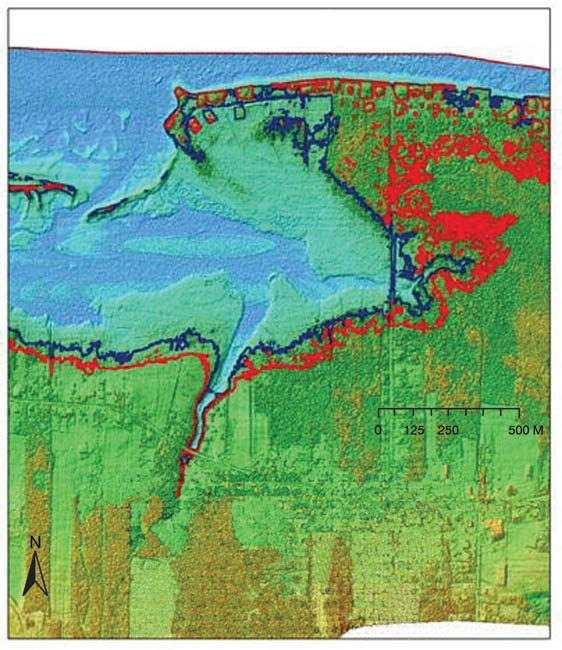
FIGURE 8: Flooding extents with present sea levels (blue line) and with a 60 cm sea-level-rise scenario (red line) for a 10-year return period, Pointe aux Bouleaux, NB (Bernier et al., 2006).
At present, a storm surge in excess of 3.6 m above the mean sea level (chart datum, CD) occurs approximately once every 40 years in the southern Gulf of St. Lawrence. As sea level continues to rise, the frequency of higher storm surges will increase. At the present rate of sea-level rise, a storm surge of 3.6 m elevation above present CD would statistically occur annually in the southern Gulf of St. Lawrence by 2100 (Parkes et al., 2006). Storm surges in excess of 4.0 m elevation above present CD would occur approximately once every 10 years. At Charlottetown, the storm-surge height during the January 2000 event was 4.22 m above CD, causing unprecedented flooding and damage around the southern Gulf of St. Lawrence (Forbes et al., 2000; Bruce, 2002; McCulloch et al., 2002; Parkes et al., 2006). Rising sea level would produce comparable events approximately once every 10 to 15 years, even if the frequency and magnitude of the storms themselves did not change. Under the effect of rising sea level, a storm surge in January 2100 propelled by winds comparable to those of January 21, 2000 would rise 4.52 m above present CD in Charlottetown, flooding more terrain. Rising sea level will result in flooding of higher, previously immune areas (Figure 8), and more frequent flooding of low-lying areas.
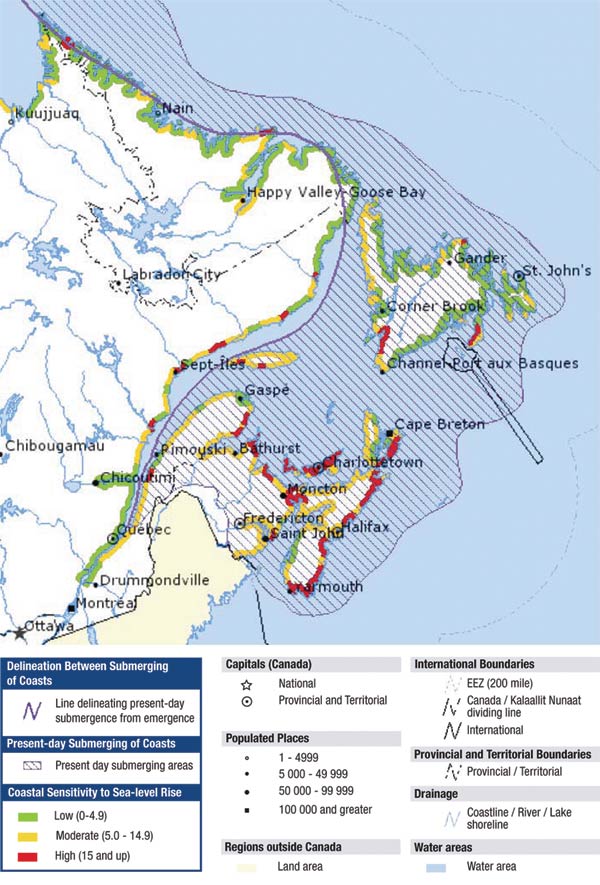
FIGURE 9: Coastal sensitivity to sea-level rise, Atlantic Canada (Shaw et al.,1998).
Sections of the Atlantic coasts are among the areas in Canada most severely threatened by a rise in sea level (Figure 9; Shaw et al., 1998). Sea-level changes are driven by a combination of local, regional, hemispheric or global factors, including the changing volume of the oceans (due to thermal expansion and glacial melting) and glacio-isostatic activity. Each coastal area responds differently to a particular combination of factors, and the change in sea level is not identical, either throughout the world or along Canada ’s three marine coastlines. With the exception of northernmost Labrador and Lake Melville, Atlantic Canada is now subsiding. Archeological sites at Fort Beaus éjour, NB (Scott and Greenberg, 1983; Shaw and Ceman, 1999), Louisbourg, NS (Figure 10; Taylor et al., 2000), St. Peters Bay, PE (Josenhans and Lehman, 1999; Shaw et al., 2002), and Ferryland, NL (Catto et al., 2000, 2003), among others, indicate that sea level has risen since ca. 1600. Evidence of transgression is indicated by enhanced erosion along many Atlantic Canadian beaches, and inundation of terrestrial peat deposits and trees. Over the past century, sea level in the Atlantic region has risen approximately 30 cm (Figure 11). Areas such as the coast of southeastern New Brunswick could experience sea-level rise on the order of 50 to 70 cm during the current century (2000 –2100; Parkes et al., 2006). Continued sea-level rise will amplify storm surges and flooding in the Atlantic region.
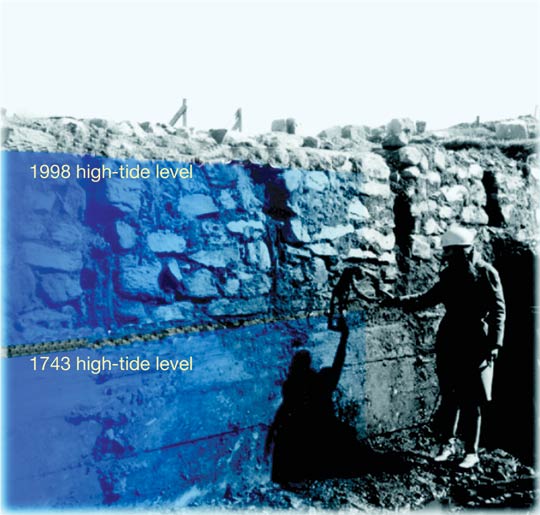
FIGURE 10: Rising sea level at Louisbourg, NS (from Natural Resources Canada, 2006c).
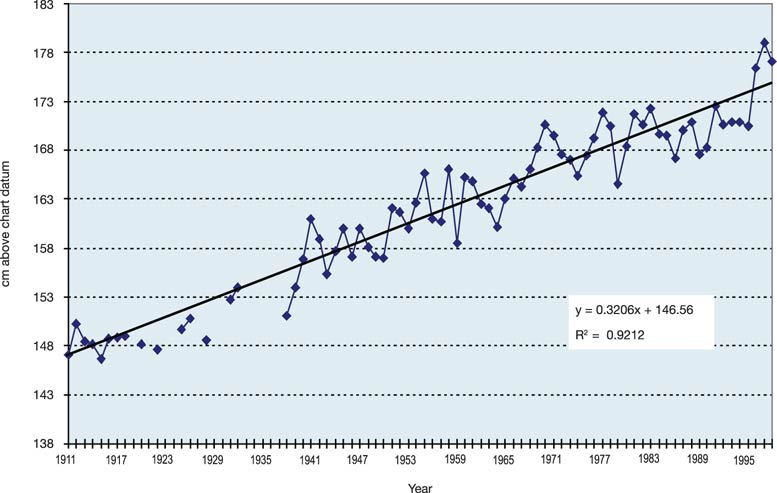
FIGURE 11: Annual mean water levels at Charlottetown, PE (1911-1998) in centimetres above chart datum (from Parkes et al., 2002). The linear regression through the data indicates a sea-level rise of approximately 32 cm/century. Similar rates of sea-level rise are reported for Halifax, NS (Shaw et al., 1998), New Brunswick's southeastern coast (Daigle et al., 2006), St. John's, NL (Catto, 2006b), and Channel-Port aux Basques, NL (Catto et al., 2006).
2.3 SEA ICE
Climate change will affect the duration and extent of sea ice, with the anticipated effects differing throughout Atlantic Canada. In the Gulf of St. Lawrence, warmer winters, coupled with stronger southwesterly winds, would result in reduced (or no) ice cover in the area south of the Îles de la Madeleine. This pattern, evident during periods of negative NAO conditions, results in enhanced coastal erosion in northern and eastern Prince Edward Island and southeastern New Brunswick, instability of nonvegetated coastal sand dunes (e.g. Catto et al., 2002) and northward displacement of seal breeding areas. Simultaneously, however, southwesterly winds can drive ice in the Gulf of St. Lawrence, resulting in thicker and more persistent ice around Anticosti Island, the north shore of the Gulf of St. Lawrence and the Northern Peninsula of the Island of Newfoundland north of St. Paul ’s. For species dependent upon ice-marginal conditions for breeding, the result is a displacement of the breeding areas to the northeast, rather than an absence of suitable conditions. Positive NAO conditions, dominated by northeasterly winds, would allow the ice front to move southwestward if the temperature of the Gulf of St. Lawrence waters remained unchanged.
Along the northeast coast of Newfoundland and Labrador, the strength of the Labrador Current carries ice southwards. Maximum ice extent off Newfoundland is generally reached in March or April (Markham, 1980; C ôté, 1989). During negative NAO years (e.g. 1996–1997), maximum ice extent is restricted to the coastline north of Cape Bonavista, whereas coastal ice may extend south of Cape St. Francis during positive NAO years (1990 –1992, 2004) and ice-foot development occurs on beaches in Placentia Bay. Positive NAO years are marked by increased northeasterly wind activity, which drives ice onshore in Labrador and northeastern Newfoundland, obstructing harbours, blocking drainage at the heads of estuaries and coves (causing local flooding) and resulting in ice shove, potentially damaging infrastructure (e.g. Catto et al., 2003; Catto, in press).
Page details
- Date modified: