
Indicators of Climate Variability and Change
2.1 UNDERSTANDING CLIMATE VARIABILITY
Two major ocean-atmosphere phenomena strongly influence climate variability in British Columbia:
- the El Ni ño–Southern Oscillation (ENSO), and
- the Pacific Decadal Oscillation (PDO). Both are naturally occurring patterns, but their frequency and intensity appear to be changing in response to global climate change (Trenberth and Hurrell, 1994; Timmermann, 1999).
The ENSO is a tropical Pacific phenomenon that influences global weather patterns. It has a cycle of 3 to 7 years (Wolter and Timlin, 1993, 1998; see Chapter 2). During warm ‘El Niño' events, warm waters from the equatorial Pacific migrate up the west coast of North America and influence sea-surface temperatures, sea levels, and local climate across BC. Impacts of ENSO are strongest in winter and spring. El Ni ños bring warmer temperatures (by 0.4–0.7ºC) and less precipitation to BC, whereas cool ‘La Niña' events bring cooler and wetter conditions (Climate Impacts Group, 2006). The PDO is a longer (approx. 20–30 year) climate variability pattern similar in effect to ENSO, but it occurs in the midlatitude northeastern Pacific (Mantua et al., 1997). The positive (warm) PDO phase is characterized by warmer coastal waters in the northeastern Pacific. It is associated with slightly warmer conditions across BC during winter and spring, and variable effects on precipitation. The opposite occurs during the negative PDO phase, with cooler and wetter conditions. Shifts between PDO phases result in major changes in climatic and oceanographic regimes, affecting winds and storms, ocean temperatures and currents (Bond and Harrison, 2000; McPhaden and Zhang, 2002). The PDO shifted from a negative (cold) to a positive (warm) phase in 1976 (Hare and Mantua, 2000) and has been positive ever since, except for the late 1980s and early 2000s.
These two climate variability patterns are linked, since the PDO either amplifies or dampens the effects of ENSO events (Gershunov and Barnett 1998; Biondi et al., 2001), affecting not only temperature and precipitation but also snowpack, streamflow, growing degree days, frost-free periods, winds, seasonal ocean levels and storm surges. The effects of PDO and ENSO in western North America are widespread and well documented (e.g. Fleming et al., 2006; Stahl et al., 2006; Wang et al., 2006).
Understanding these factors that control climate variability in BC is important for a wide range of planning purposes. Perhaps most important is that the use of short-term (30-year) climate averages cannot capture the variability introduced by the PDO. Second, the strong influence of ENSO means that seasonal climate predictions can be used for operational planning on a year-to-year basis (American Meteorological Society, 2001). Seasonal climate forecasts are presently available for some areas and seasons based on statistical relationships with climate variability patternsFootnote 6. These forecasts can assist with risk assessments for forest fires, droughts, water and energy supply/demand, snow removal, river forecasting and flooding. Such predictions represent a major improvement over the use of historical information only. It has been estimated that incorporation of seasonal climate predictions into planning of hydroelectric reservoir operations on the Columbia River could increase annual revenues by an average of CDN$153 million (Hamlet et al., 2002).
Prehistoric Records of Variability and Change
Natural archives, such as lake and ocean sediments, tree rings, glacial ice and landforms, provide insights into the climate variability and environmental history of British Columbia prior to the instrumental record. Extensive paleoclimatic research has been conducted in BC. Recent reviews document that, following a colder drier climate toward the end of the last glaciation (approx. 12 500 years ago), BC's climate warmed rapidly by 5ºC over only a century or two (Hebda and Whitlock, 1997; Walker and Pellatt, 2003). Following this were three broad climate intervals:
- a warm and dry interval from approximately 10 000 to 7400 years ago;
- a warm and moist interval from 7400 to 4400 years ago; and
- a cooler interval, analogous to the modern climate, from about 4400 years ago.
Superimposed on this longer term climate history is a complex pattern of climate variability that includes:
- abrupt changes in climate (Gedalof and Smith, 2001; Chang et al., 2003; Chang and Patterson, 2005; Zhang and Hebda, 2005);
- periods of intense, persistent drought (Gedalof et al., 2004; Watson and Luckman, 2004, 2005);
- inconsistent relationships between ENSO, PDO and the climate of BC (Gedalof et al., 2002, 2004; Watson and Luckman, 2004, 2005)
- multiple periods of alpine glacier advance and retreat (Ryder and Thomson, 1986; Luckman, 2000; Larocque and Smith, 2003, 2004; Koch et al., 2004; Lewis and Smith, 2004). In particular, the glacial record shows that current warming rates are unprecedented in the last 8000 years (Menounos et al., 2004).
Together, these records demonstrate the dynamic nature of BC's climate and the great likelihood that climate ‘surprises' will occur in the future. Three key lessons emerge from the prehistoric climate record that are of relevance to the assessment of future climate change:
- Abrupt changes in climate, similar to the shift in 1976, are common in the prehistoric record, as are abrupt changes in ocean circulation.
- Influences of large-scale patterns of climate variability (e.g. ENSO and PDO) on BC's climate have not been consistent in recent centuries. Consequently, the instrumental record probably does not reflect the full range of variability of the climate system, which may respond unpredictably to changes in forcing.
- Severe, sustained droughts occurred more frequently in previous centuries than over the past few decades, and would therefore be expected to occur in the future irrespective of climate change.
2.2 TEMPERATURE AND PRECIPITATION
Historical Trends
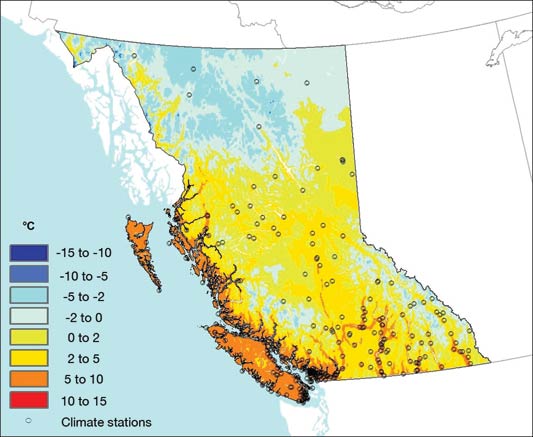
Although there are several long-term instrumental climate records for British Columbia, most stations began recording around 1950, which presents challenges for the identification of long-term trends. The present-day climate station network (shown in Figure 1) is also not sufficiently dense to characterize adequately BC's highly variable climate (Miles and Associates, 2003). Regardless of length of record, however, all trends show that BC's climate has warmed significantly in recent decades (Zhang et al., 2000; BC Ministry of Water, Land and Air Protection, 2002; Whitfield et al., 2002a; BC Ministry of Environment, 2006). Longer records suggest that the rate of change in temperature and precipitation in southern BC and much of the Pacific Northwest during the twentieth century exceeded global averages (Zhang et al., 2000; Mote, 2003a, c). Most of the province experienced warming in both mean annual temperature and during all seasons (Table 1), although there are large regional and seasonal disparities in trends (Whitfield et al., 2002a). Annual and seasonal precipitation trends also vary by region (Table 2).
| Region | Extremes | Seasonal | Annual |
|---|---|---|---|
| BC | Increased warm temperature extremesFootnote 1; fewer extreme cold days and nights, fewer frost days and more extreme warm nights and daysFootnote 2; longer frost-free periodFootnote 3 | Daily minimum and maximum temperatures higher in all seasons; greatest warming in spring and winterFootnote 3 | 0°C isotherm shifting northwardFootnote 4 |
| Southern BC | Interior warmed more than the coastFootnote 3 | Warming in spring, fall and winter, but not summerFootnote 5Footnote 6 | |
| Northern BC | Warmer winters, cooler fallsFootnote 7 | Warmer average annual temperatureFootnote 5 | |
| Coastal BC | Coast warmed less than interiorFootnote 3 | Warmer in spring and fallFootnote 8; Georgia Basin–Puget Sound region warming in all seasons, especially last 30 yearsFootnote 9 |
| Region | Extremes | Snow/rain | Total annual precipitation | Total seasonal precipitation |
|---|---|---|---|---|
| BC | More precipitation days, decreased consecutive dry days, decreased mean daily precipitation; no consistent hanges in extremesFootnote 1 | Decreased snow to total precipitation ratio (more rain, less snow during cold season)Footnote 2 | Slightly wetterFootnote 2Footnote 3 | |
| Southern BC | Wetter winter wet periods | Less annual snowfall in last 50 yearsFootnote 1; ratio of rain to snow increased (more rain, less snow) in OkanaganFootnote 4; decreased snowpack in spring and at lower elevationsFootnote 5Footnote 6Footnote 7 | Wetter in 20th century, withmajority of increase before 1945Footnote 8 | Wetter in spring, summer, fallFootnote 3; drier in winter, wetter in summer in OkanaganFootnote 4; drier in winter in interiorFootnote 2 |
| Northern BC | More snowfall since 1950sFootnote 1 | Wetter in all four seasonsFootnote 3 | ||
| Coastal BC | Less snow throughout, more than 40% less at some sitesFootnote 5; greatest loss of snow in Pacific Northwest on south coast; more locations with no snow on April 1 | Wetter in winter (more rain)Footnote 9, except Georgia Basin (no trend November to March) |
Future Projections
Global climate models (GCMs) are used to project future climate with plausible scenarios of future greenhouse gas emissions and physical models of climate that include atmospheric, ocean, ice and land-surface components (see also Chapter 2). Multiple projections and/or models are used to address uncertainty and produce a range of possible futures.
For BC, three large scenario regions (northern, southern and coast) were chosen for this assessment, based on large (approx. 100 km2) GCM grids. Scenarios are displayed as changes from an observed 1961–1990 mean climate to the 2020s, 2050s and 2080s for temperature (Figure 7a) and precipitation (Figure 7b). Scenarios of precipitation by seasonFootnote 7 for BC suggest that conditions will be wetter over much of the province in winter and spring, but drier during summer in the south and on the coast.
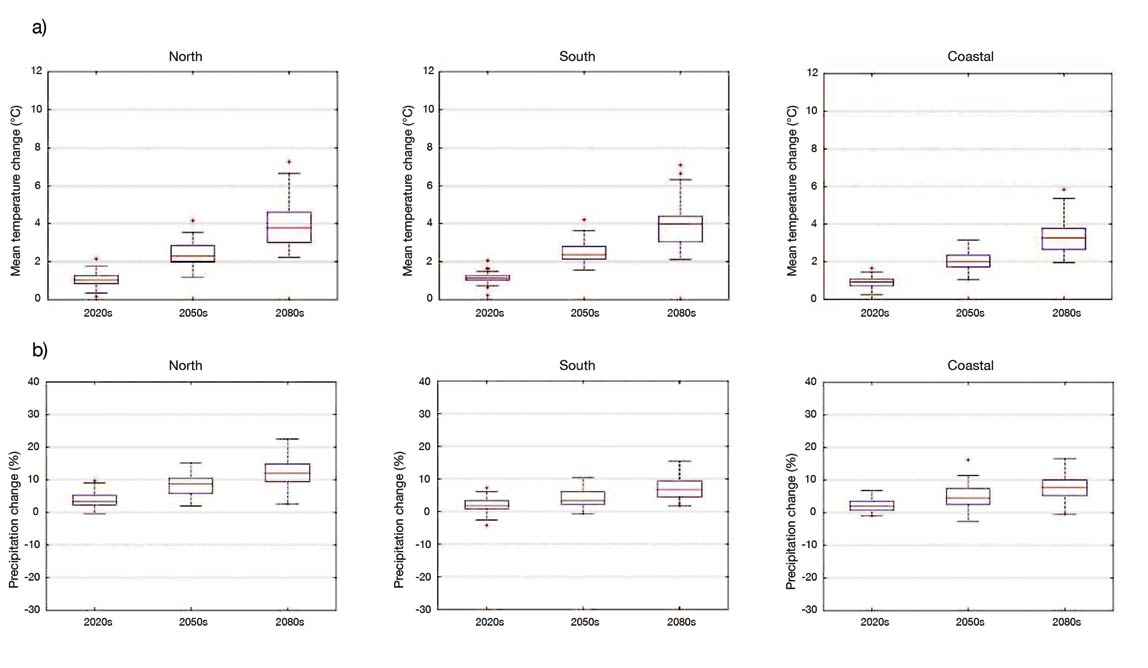
FIGURE 7: Changes from the 1961-1990 historical climate to the 2020s, 2050s and 2080s in a) temperature (°C), and b) precipitation (%). See Appendix 1 in Chapter 2 for description of box-and-whisker plots.
Scenarios of finer spatial resolution are available using regional climate models (RCMs); however, the computational costs generally limit RCMs to fewer emissions scenarios than presented above. Downscaling methods, such as the ClimateBC program (University of British Columbia, no date) that uses high-resolution elevation and historical data to generate statistical predictions, also provide enhanced spatial resolution (Hamann and Wang, 2005; see Section 3.6 for application to parks adaptations).
2.3 EXTREME WEATHER AND WEATHER-RELATED EVENTS
Extreme weather and weather-related events directly affect British Columbians more than any other climate risk. Windstorms, forest fires, storm surges, landslides, snowstorms, hail and floods all have major impacts on communities, infrastructure and industry (Hamlet, 2003; Sandford, 2006). The impacts and steps toward adaptation for various climate-related extreme events are discussed in Section 4 (see also Sections 3.7 and 3.8). Increased occurrence of extreme weather events is documented worldwide, and climate models project a continuing rise in their frequency (Easterling et al., 2000; Milly et al., 2002; Palmer and R älsänen, 2002; Schumacher and Johnson, 2005). In western North America, forest fires have become more frequent and severe with recent warming (Gedalof et al., 2005; Westerling et al., 2006), and this is projected to continue in western Canada (Gillett et al., 2004; Flannigan et al., 2005).
British Columbia's Provincial Emergency Program (BC-PEP) records extreme weather events that cause personal and economic losses due to infrastructure damage. From 2003 to 2005, the frequency, severity and costs of extreme events recorded by BC-PEP rose dramatically as a result of wildfires, storm surges, heavy rains causing flooding and landslides, and drought. Warmer winter weather, resulting in ice jams, freezing rain and rain-on-snow events, also resulted in economic losses. These events cost BC taxpayers an average of $86 million per year in payouts of disaster financial assistance, compared to an average of $10 million per year from 1999 to 2002 (Whyte, 2006). This increase is consistent with increasing weather-related hazards, as documented in the Canadian Disaster Database (McBean and Henstra, 2003; Public Safety and Emergency Preparedness Canada, 2006b).
2.4 HYDROLOGY
Regional hydrological changes are linked to temperature and precipitation trends (Tables 2 and 3; see Sections 3.1 and 4.3). Large temperature increases have resulted in a reduced snowpack, even in snowmelt-dominated basins where net precipitation has increased (Mote, 2003a, b; Stewart et al., 2004). Reductions in snowpack have changed streamflow volumes and timing, while many lakes and rivers also show shorter periods of ice cover (BC Ministry of Water, Land and Air Protection, 2002) and earlier spring ice melt (Bonsal et al., 2001). Spring melt now occurs earlier in many BC rivers (Zhang et al., 2001a), a trend that climate model projections indicate will continue (Barnett et al., 2005). Also significantly impacting regional hydrology is the rapid melting of alpine glaciers, many of which may disappear in the next 100 years (Box 1).
| Location | Trend in runoff |
|---|---|
| Provincial trends |
|
| Coastal |
|
| Northern |
|
| Southern |
|
BOX 1
BC's glaciers: a dwindling natural resource
Glaciers are a major source of fresh water for western Canada, with glacial runoff currently maintaining river discharge and regulating temperatures in many western Canadian rivers (Fleming, 2005; Fleming and Clark, 2005; Moore, 2006), supplementing surface runoff during the summer when aquatic ecosystems are most vulnerable and demand for water highest. For instance, in the Columbia River basin, 10 to 20% of annual flow and 50% of summer flows are glacier fed (Brugman et al., 1996).
In 2005, glaciers covered 3% of BC (30 000 km2) and were retreating at rates unprecedented in the last 8000 years (Lowell, 2000). Most of BC's glaciers are losing mass and many will disappear in the next 100 years. Information on the rates and magnitude of glacier retreat is important for water resource management and planning, which has to address demands for human consumption, irrigation, industrial use and hydroelectric power generation, as well as in-stream ecological needs. Climate change and increasing water resource demands are expected to exacerbate existing supply-demand mismatches (Environment Canada, 2004). Decreasing summer flows resulting from reduced glacier melt, combined with increasing summer water demands to meet rising irrigation requirements and energy needs for cooling, presents one of the most significant water resource challenges for BC, a province seemingly blessed with water.
Analysis for the entire Pacific Northwest suggests that historical streamflow trends will continue, with many rivers running 30 to 40 days earlier by 2100 (Stewart et al., 2004). Increasing temperatures and precipitation changes will reduce snowpack and increase winter runoff for most of BC (Hamlet and Lettenmaier, 1999; Mote and Hamlet, 2001). Reduced snowpack and earlier snow melt, combined with higher evapotranspiration, will result in earlier spring peak flows and reduced April to September streamflows. For example, by 2045 in the Columbia River basin, April to September runoff could be reduced by 10 to 25% relative to a simulated hydrological base case (Hamlet and Lettenmaier, 1999). Combined, these hydrological impacts will affect several of BC's key economic sectors, including hydroelectric power generation (see Section 3.7), fisheries (see Section 3.2) and agriculture (see Section 3.4).
Climate change also impacts groundwater systems, with the greatest changes evident in shallow aquifer systems (Rivera et al., 2004). Even small changes in temperature and precipitation alter groundwater recharge rates and water table depths (e.g. Changnon et al., 1988; Zektser and Loaiciga, 1993). Reductions in stream flow will have negative effects on both groundwater recharge and discharge (Scibek and Allen, 2006). As groundwater discharge serves to moderate stream temperatures, reduced summer discharge would result in even greater increases in surface water temperatures than would occur from air temperatures alone. In coastal regions, climate change will also impact groundwater quality due to saltwater intrusion in response to sea-level rise (e.g. Lambrakis and Kallergis, 2001; Yin, 2001).
2.5 SEA LEVEL
Globally, mean eustatic sea level increased 10 to 20 cm during the twentieth century, and is anticipated to rise another 18 to 59 cm by 2100, due largely to melting glaciers and ice sheets, and thermal expansion of warming seawater (Intergovernmental Panel on Climate Change, 2007). In British Columbia, relative sea-level change differs from the global trend due to vertical land movements. During the twentieth century, sea level rose 4 cm in Vancouver, 8 cm in Victoria and 12 cm in Prince Rupert, and dropped by 13 cm in Tofino (BC Ministry of Water, Land and Air Protection, 2002). Sea-level rise is an important issue in BC, as it impacts coastal infrastructure, such as highways, sewer systems, shipping terminals and Vancouver International Airport. For perspective, an arbitrary 1 m rise in sea level would inundate more than 4600 ha of farmland and more than 15 000 ha of industrial and residential urban areas in British Columbia (Yin, 2001). Approximately 220 000 people live near or below sea level in Richmond and Delta in Greater Vancouver, and are protected by 127 km of dykes that were not built to accommodate sea-level rise (B. Kangesneimi, BC Ministry of Environment, pers. comm., 2007). Many remote coastal communities and First Nations' heritage sites are vulnerable to enhanced erosion and storm-surge flooding associated with sea-level rise. Finally, sea-level rise can result in saltwater intrusion into freshwater aquifers, affecting the quality and quantity of drinking and irrigation water supplies (Liteanu, 2003; Allen, 2004).
On British Columbia's coast, the height of damaging extreme high-water events is increasing at a rate faster than sea-level rise (e.g. 22 –34 cm/century at Prince Rupert, 16 cm/century at Vancouver; BC Ministry of Water, Land and Air Protection, 2002; Abeysirigunawardena and Walker, in press). At Tofino, where relative sea level has fallen, the extreme high-water events show little change. Extreme sea levels, storm surges and enhanced coastal erosion are strongly influenced by ENSO and PDO (Storlazzi et al., 2000; Dingler and Reiss, 2001; Allan and Komar, 2002; Abeysirigunawardena and Walker, in press). Extreme water levels have increased significantly since the positive PDO shift of 1976 (Abeysirigunawardena and Walker, in press). During the El Ni ños of 1982–1983 and 1997–1998, sea levels from California to Alaska rose as much as 100 cm above average (Subbotina et al., 2001), and more energetic wave conditions produced extensive coastal erosion and infrastructure damage (Storlazzi et al., 2000; Allan and Komar, 2002). On BC's north coast, sea levels rose 10 to 40 cm above seasonal heights in 1997–1998 causing extensive localized erosion (Crawford et al., 1999; Barrie and Conway, 2002).
2.6 ECOSYSTEMS
Climate change impacts ecosystem distribution and biodiversity (see Sections 3.2, 3.3, and 3.6). Several consistent themes emerge from a wide range of studies:
- Pacific salmon, sardine, anchovy, mountain pine beetle and western red cedar have shown abrupt changes in abundance and/or distribution in response to past, relatively minor changes in climate (Robinson and Ware, 1994; Hebda, 1999; Ware and Thomson, 2000; Brown and Hebda, 2002, 2003; Wright et al., 2005). Such changes can have significant social and economic implications (see Sections 3.2 and 3.3).
- Large shifts in species ranges are expected to occur (Royal BC Museum, 2005a), often with little overlap between current and projected distributions (Shafer et al., 2001). Species will respond individually, and resulting vegetation communities may not resemble current communities (Brubaker, 1988; Gavin et al., 2001).
- Many of BC's specialized habitats (e.g. alpine ecosystems, deserts, cold steppe) will become reduced in extent and more fragmented (Shafer et al., 2001).
- The capacity of BC's system of protected areas to maintain biodiversity will be challenged, as many species will be forced to migrate over natural barriers (water, mountains) and human-induced landscape fragmentation (Overpeck et al., 1991; Dyer, 1995; Lemieux and Scott, 2005; see Section 3.6).
- Wildfire frequency and severity will increase in coming decades (Flannigan et al., 2001; Gillett et al., 2004; Gedalof et al., 2005; Westerling et al., 2006). While this will likely present challenges for some ecosystems, others (e.g. Garry oak and ponderosa pine forests), which are fire maintained, may expand in range (Agee, 1993; McKenzie et al. 2004).
- Large-scale outbreaks of pests, such as mountain pine beetle and spruce bark beetle, are expected to persist and expand with continued warming. These pose an increasing threat to species such as high-elevation whitebark pine and eastern jack pine forests across western Canada (Logan and Powell, 2001; see Section 4.2).
2.7 SUMMARY
Key findings regarding ongoing and future climate changes in British Columbia include the following:
- Major shifts in climate variability and extremes are inherent to the system and can be expected in the future. Climate changes in BC during the twentieth century exceeded most global trends, with considerable regional variability.
- British Columbia's climate is substantially influenced by large-scale variability patterns, including ENSO and the PDO. Associated extreme weather events are increasing, and resulting damage costs are on the rise.
- Increasing temperatures have resulted in decreased snow accumulation in many locations, particularly at low elevations.
- British Columbia's glaciers are retreating at rates unprecedented in the last 8000 years, with implications for existing and future water and energy demands, agriculture and aquatic ecosystems.
- Vegetation reconstructions show that plant species respond individually to climate change. Future ecological changes will be complex and potentially rapid.
- British Columbia could warm by 2 to 7°C by 2080. Biophysical impacts will include sea-level rise, changing frequency and magnitude of precipitation and extreme events, major hydrological changes and reorganization of ecosystems.
- Seasonal climate forecasts incorporating ENSO and PDO effects are useful for year-to-year operational planning, but are currently underutilized.
- Instrumental records used to compute climate normals, trends and probabilities of extreme event occurrence (floods, droughts, storms) are often too short, and assume static (unchanging) conditions, and are therefore inadequate for many planning purposes.
Page details
- Date modified: