
Canadian Reserves
Information Bulletin, March 2014
Canadian Reserves of Selected Major Metals – Re-Opened Mines Spur Increase in Reserves in 2011
Reserves of Selected Major Metals
The long period of decline for Canada’s base-metal reserves was arrested for copper, molybdenum, silver, and gold in 2004 when reserves levels either increased or stabilized. Lead and zinc reserves continued to fall. Nickel reserves continued to decline, but at a slightly slower rate.
From 1985 to 2011, Canada’s reserves of base metals changed at annual average rates varying from -12% for lead to 3% for gold. This period of overall decline resulted in some metal reserve levels of less than half of the known ore reserves reported at the end of 1985. Reserves in 2011 were 75% of 1985 reserves for copper, 42% for nickel, 77% for molybdenum, 20% for zinc, 3% for lead, and 24% for silver. Gold reserves saw an increase of 149% over that same period. Gold and copper reserves have increased with the re-opening of old mines and the addition of reserves from new mines. Molybdenum reserves have increased at existing mines with higher prices used for reserves calculations (Figure 1 and Table 1).
In 2011, commodity prices remained high in real terms, but declined in nominal terms; annual average prices were higher than they had been in 2010, but declined near the end of the year. The price for copper averaged US$4.01 per pound (/lb),Footnote 1 nickel averaged US$10.34/lb, zinc averaged US$0.99/lb, and lead averaged US$1.09/lb. Gold prices remained high throughout the year, averaging US$1,571.52 per ounce (oz) while silver averaged US$35.12/oz. By year-end 2011, copper was selling for US$3.50/lb, nickel for US$7.79/lb, zinc for US$0.92/lb, and lead for US$0.93/lb. Gold and silver prices reached US$1,652.31/oz and US$30.41/oz, respectively.
Five new mines opened in 2011: two mines re-opened and three mines that had been closed for a number of years were rejuvenated with new mine plans. Much of the growth in reserves came from new and rejuvenated gold mines and from the new Lalor Lake base-metal mine in Manitoba. Decreases were recorded in the reserves of lead (38%), nickel (4%), and copper (<1%). Although some reserves continued to decline in 2011, increases were recorded for gold (39%), zinc (16%), and molybdenum and silver (~1%). Although it was down from recent highs, an elevated gold price had the potential to continue to fuel the upward trend of gold reserves in Canada.
The increase in zinc reserves was due to additions from the new Lalor Lake mine in Manitoba, which was also responsible for significant additions to silver, lead, and copper reserves. Table 2 illustrates the main components of change in Canadian reserves in 2011.
The weak economic recovery that began in 2010 continued into early 2011, but met with some major setbacks such as the deepening economic crisis in Europe and issues with banking sector losses that increased uncertainty. According to an April 2012 International Monetary Fund report titled World Economic Outlook, investors withdrew money from commodity funds throughout much of 2011. Demand in emerging and developed countries slowed, commodity prices declined, and weak demand for commodities was recorded globally. As was the case in 2011, the prices of, and demand for, most minerals and metals in 2012 will be heavily dependent on continued growth in China and decreasing financial risk in Europe’s (and the Western World’s) fragile economies.
Reserves by Commodity
Gold
There were 2,044 tonnes (t) of gold contained in Canadian mine reserves in December 2011. This represents an increase of 39% (571 t) compared to December 2010. The largest addition to gold reserves came from the rejuvenated Detour Lake open-pit mine in Ontario, which added 462 t; from the new Eleonore gold mine (94 t) and the Canadian Malartic mine (54 t), both in Quebec; and from the new Lalor Lake polymetallic mine in Manitoba (27 t). In total, four new mines and three rejuvenated mines added to the gold reserves total in 2011. A 40-t decrease in gold reserves was recorded at the Meadowbank gold mine in Nunavut. Since 2005, gold reserves have been increasing.
Silver
There were 6,952 t of silver contained in Canadian mine reserves in December 2011. This represents a small increase (37 t) compared to December 2010. The Brunswick No. 12 mine in New Brunswick, the LaRonde and Perseverance mines in Quebec, the Wolverine mine in Yukon, the Kidd Creek mine in Ontario, and the 777 mine in Manitoba all saw decreases of 383 t, 129 t, 48 t, 38 t, 34 t, and 32 t, respectively. Additions to silver reserves were made by the new Lalor Lake pollymetallic mine in Manitoba (340 t), the re-opened Langlois mine in Quebec (243 t), and the Ming mine in Newfoundland and Labrador (44 t). For the purpose of this analysis, silver grades have been estimated for a number of mines to ensure continuity in the reporting of national ore reserve levels from year to year.
Zinc
During 2011, Canadian reserves of zinc increased by about 674,000 t (16%) to a year-end total of approximately 4.8 million tonnes (Mt). The greatest increase was recorded at the new Lalor Lake pollymetallic mine in Manitoba (1.0 Mt). As a result of the closure of the Brunswick No. 12 mine in New Brunswick, reserves there decreased by 345,000 t. Decreases were also recorded at the Perseverance mine (244,000 t) and the LaRonde mine (80,000 t) in Quebec.
Lead
In 2011, Canadian reserves of lead decreased by approximately 38% to a year-end total of 247,000 t. The largest declines occurred at the recently closed Brunswick No. 12 mine (138,000 t) and the LaRonde mine (10,000 t). There were no new or operating mines posting additions to lead reserves in 2011.
Copper
In December 2011, Canadian reserves of copper were estimated at around 10.67 Mt, a small decrease (79 Mt) compared to one year earlier. Additions to copper reserves occurred at the rejuvenated Ming mine in Newfoundland and Labrador (270,000 t), at two British Columbia mines (Mt. Polley [115,000 t] and Huckleberry [94,000 t]), and at the new Lalor Lake mine in Manitoba (86,000 t). Increases were also recorded at the Highland Valley mine (66,000 t) in British Columbia and at the re-opened Langlois (34,000 t) and Lockerby (19,000 t) mines in Quebec and Ontario, respectively. Decreases occurred at the Gibraltar mine (270,000 t), at Vale’s Ontario operations (124,000 t), and at the Kidd Creek mine (56,000 t) in Ontario. Since 2005, copper reserves have been on a generally increasing trend.
Molybdenum
Canadian reserves of molybdenum stood at 255,733 t in December 2011, a slight 1% increase from 2010. Reserve gains were recorded at the Endako (7,500 t) and Huckleberry (2,700 t) mines in British Columbia. Decreases were recorded at the Gibraltar and Highland Valley mines, also in British Columbia. Since 2005, molybdenum reserves have been increasing.
Nickel
In December 2011, there were some 2.9 Mt of nickel contained in Canadian mine reserves, a decrease of approximately 4% from 2010 levels. The largest decrease in nickel reserves occurred at Vale’s Ontario operations with reported nickel reserves of 107,000 t less than in 2010. Decreases were also recorded at Vale’s Voisey’s Bay mine (79,000 t) in Labrador and at the Raglan mine (42,000 t) in Quebec. Reserves were added from Xstrata’s Sudbury operations in Ontario (57,000 t) and from the re-opened Lockerby mine in Manitoba (32,000 t). There were also additions at Vale’s Manitoba operations and at the new McWatters mine in Ontario.
Nickel reserves in the Sudbury region decreased by approximately 30,000 t due to mine depletion and the reclassification of reserves to resources. In 2011, Vale and Xstrata intended to continue advancing new projects in the Sudbury region. Vale’s Totten project is expected to begin production in the second half of 2013 and Xstrata’s Fraser Morgan mine is slated for re-activation in 2013.
Vale had some 2.2 Mt of nickel in Canadian reserves at the end of 2011, or about 77% of the national total.
Canadian Reserves by Province and Territory
In 2011, British Columbia, Ontario, and Quebec continued to hold dominant positions in terms of Canada’s proven and probable mineable reserves of major metals. However, New Brunswick, which has traditionally held fourth place, dropped to sixth place with the closure of the Brunswick mine while Manitoba stepped up to fourth (Table 3).
British Columbia had 100% of the molybdenum, 64% of the copper, 17% of the silver, 12% of the lead, 6% of the zinc, and 5% of the gold.Footnote 2
Ontario had 54% of the nickel, 54% of the gold, 28% of the silver, 22% of the copper, 16% of the zinc, and 11% of the lead.
Quebec had 33% of the gold, 28% of the zinc, 18% of the silver, 11% of the lead, 10% of the nickel, and 2% of the copper.
New Brunswick had 42% of the lead, 6% of the zinc, and 5% of the silver.
Yukon had 25% of the lead, 21% of the silver, 10% of the zinc, 2% of the copper, and 1% of the gold.
Manitoba had 32% of the zinc, 18% of the nickel, 10% of the silver, 4% of the gold, and 3% of the copper.
Newfoundland and Labrador had 19% of the nickel, 6% of the copper, 2% of the zinc, and 1% of the silver and gold.
Nunavut had 3% of the gold.
Saskatchewan had 1% of the gold.
Outlook
In recent years, strong gold prices have spurred the re-development and re-opening of gold mines, and demand from emerging and developing countries has provided markets for Canada’s production of base metals.
However, lower investment in the industry in both exploration and mining development will affect the ability of companies to bring new supply on stream in the short to medium term. Overall, it is expected that 2012 may be a year in which reserves will hold at current levels or decline slightly.
Note: Information in this bulletin was current as of November 2013.
FIGURE 1. CANADIAN RESERVES OF SELECTED MAJOR METALS, 1989-2011
Metal Contained in Proven and Probable Mineable Ore (1) in Operating Mines (2) and Deposits Committed to Production (3) as at December 31 of Each Year
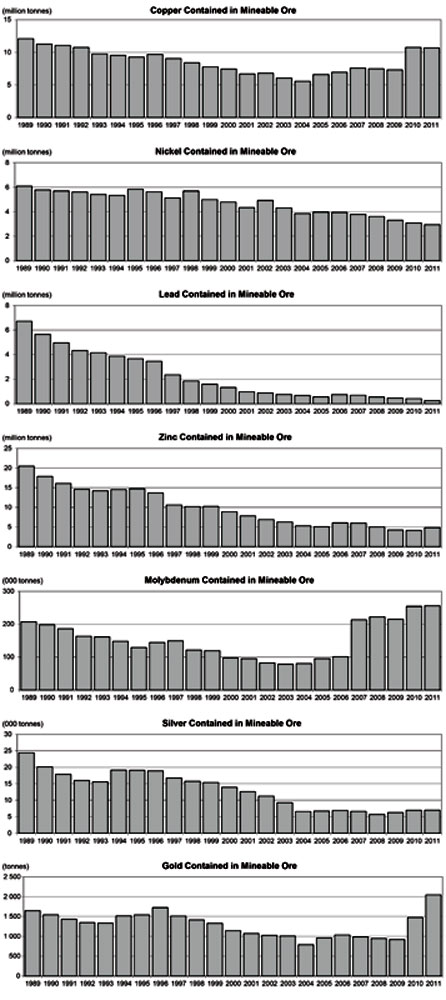
Source: Natural Resources Canada, based on published company reports and the federal-provincial/territorial survey of mines and concentrators.
(1) No allowance is made for losses in milling, smelting and refining. Excludes material classified as "resources." (2) Includes metal in mines where production has been suspended temporarily. (3) Excludes metal in placer deposits because reserves data are generally unavailable.
Text Version - Figure 1
Figure 1 is a bar chart that shows annual ore reserve levels contained in mineable ore for copper, nickel, lead, zinc, molybdenum, silver, and gold from 1989 to 2011. The overall long-term trend for these metals has been downward. On a commodity basis, the chart shows that, more recently, copper, molybdenum, and silver values increased after 2004 until 2011; nickel and lead remained on a downward trend; and zinc was generally decreasing, but increased slightly in 2011. Gold was generally decreasing with increases in 2006, 2010, and 2011. The data for the chart are below.
| Year | Copper | Nickel | Lead | Zinc | Molybdenum | Silver | Gold | |
|---|---|---|---|---|---|---|---|---|
| (000 tonnes) | (tonnes) | |||||||
| 1989 | 12,082 | 6,092 | 6,717 | 20,479 | 207 | 24,393 | 1,645 | |
| 1990 | 11,261 | 5,776 | 5,643 | 17,847 | 198 | 20,102 | 1,542 | |
| 1991 | 11,040 | 5,691 | 4,957 | 16,038 | 186 | 17,859 | 1,433 | |
| 1992 | 10,755 | 5,605 | 4,328 | 14,584 | 163 | 15,974 | 1,345 | |
| 1993 | 9,740 | 5,409 | 4,149 | 14,206 | 161 | 15,576 | 1,333 | |
| 1994 | 9,533 | 5,334 | 3,861 | 14,514 | 148 | 19,146 | 1,513 | |
| 1995 | 9,250 | 5,832 | 3,660 | 14,712 | 129 | 19,073 | 1,540 | |
| 1996 | 9,667 | 5,623 | 3,450 | 13,660 | 144 | 18,911 | 1,724 | |
| 1997 | 9,032 | 5,122 | 2,344 | 10,588 | 149 | 16,697 | 1,510 | |
| 1998 | 8,402 | 5,683 | 1,845 | 10,159 | 121 | 15,738 | 1,415 | |
| 1999 | 7,761 | 4,983 | 1,586 | 10,210 | 119 | 15,368 | 1,326 | |
| 2000 | 7,419 | 4,782 | 1,315 | 8,876 | 97 | 13,919 | 1,142 | |
| 2001 | 6,666 | 4,335 | 970 | 7,808 | 95 | 12,593 | 1,070 | |
| 2002 | 6,774 | 4,920 | 872 | 6,871 | 82 | 11,230 | 1,023 | |
| 2003 | 6,037 | 4,303 | 749 | 6,251 | 78 | 9,245 | 1,009 | |
| 2004 | 5,546 | 3,846 | 667 | 5,299 | 80 | 6,568 | 787 | |
| 2005 | 6,589 | 3,960 | 552 | 5,063 | 95 | 6,684 | 965 | |
| 2006 | 6,923 | 3,940 | 737 | 6,055 | 101 | 6,873 | 1,032 | |
| 2007 | 7,565 | 3,778 | 682 | 5,984 | 213 | 6,588 | 987 | |
| 2008 | 7,456 | 3,605 | 636 | 5,005 | 222 | 5,665 | 947 | |
| 2009 | 7,290 | 3,301 | 451 | 4,250 | 215 | 6,254 | 918 | |
| 2010 | 10,747 | 3,074 | 400 | 4,133 | 254 | 6,916 | 1,473 | |
| 2011 | 10,668 | 2,936 | 247 | 4,807 | 247 | 6,953 | 2,044 | |
Source: Natural Resources Canada based on published company reports and the federal-provincial/territorial survey of mines and concentrators.
(1) No allowance is made for losses in milling, smelting and refining. Excludes material classified as "resources." (2) Includes metal in mines where production has been suspended temporarily. (3) Excludes metal in placer deposits because reserves data are generally unavailable.
| Year | Copper | Nickel | Lead | Zinc | Molybdenum | Silver | Gold |
|---|---|---|---|---|---|---|---|
| (000 tonnes) | (tonnes) | ||||||
| 1985 | 14,201 | 7,041 | 8,503 | 24,553 | 331 | 29,442 | 1,373 |
| 1986 | 12,918 | 6,780 | 7,599 | 22,936 | 312 | 25,914 | 1,507 |
| 1987 | 12,927 | 6,562 | 7,129 | 21,471 | 231 | 25,103 | 1,705 |
| 1988 | 12,485 | 6,286 | 6,811 | 20,710 | 208 | 26,122 | 1,801 |
| 1989 | 12,082 | 6,092 | 6,717 | 20,479 | 207 | 24,393 | 1,645 |
| 1990 | 11,261 | 5,776 | 5,643 | 17,847 | 198 | 20,102 | 1,542 |
| 1991 | 11,040 | 5,691 | 4,957 | 16,038 | 186 | 17,859 | 1,433 |
| 1992 | 10,755 | 5,605 | 4,328 | 14,584 | 163 | 15,974 | 1,345 |
| 1993 | 9,740 | 5,409 | 4,149 | 14,206 | 161 | 15,576 | 1,333 |
| 1994 | 9,533 | 5,334 | 3,861 | 14,514 | 148 | 19,146 | 1,513 |
| 1995 | 9,250 | 5,832 | 3,660 | 14,712 | 129 | 19,073 | 1,540 |
| 1996 | 9,667 | 5,623 | 3,450 | 13,660 | 144 | 18,911 | 1,724 |
| 1997 | 9,032 | 5,122 | 2,344 | 10,588 | 149 | 16,697 | 1,510 |
| 1998 | 8,402 | 5,683 | 1,845 | 10,159 | 121 | 15,738 | 1,415 |
| 1999 | 7,761 | 4,983 | 1,586 | 10,210 | 119 | 15,368 | 1,326 |
| 2000 | 7,419 | 4,782 | 1,315 | 8,876 | 97 | 13,919 | 1,142 |
| 2001 | 6,666 | 4,335 | 970 | 7,808 | 95 | 12,593 | 1,070 |
| 2002 | 6,774 | 4,920 | 872 | 6,871 | 82 | 11,230 | 1,023 |
| 2003 | 6,037 | 4,303 | 749 | 6,251 | 78 | 9,245 | 1,009 |
| 2004 | 5,546 | 3,846 | 667 | 5,299 | 80 | 6,568 | 787 |
| 2005 | 6,589 | 3,960 | 552 | 5,063 | 95 | 6,684 | 958 |
| 2006 | 6,923 | 3,940 | 737 | 6,055 | 101 | 6,873 | 1,032 |
| 2007 | 7,565 | 3,778 | 682 | 5,984 | 213 | 6,588 | 987 |
| 2008 | 7,456 | 3,605 | 534 | 5,005 | 222 | 5,665 | 947 |
| 2009 | 7,290 | 3,301 | 451 | 4,250 | 215 | 6,254 | 918 |
| 2010 | 10,747 | 3,074 | 400 | 4,133 | 254 | 6,916 | 1,473 |
| 2011 | 10,668 | 2,936 | 247 | 4,807 | 256 | 6,953 | 2,044 |
Source: Natural Resources Canada, based on published company reports and the federal-provincial/territorial survey of mines and concentrators.
(1) No allowance is made for losses in milling, smelting and refining. Excludes material classified as "resources." (2) Includes metal in mines where production has been suspended temporarily. (3) Excludes metal in placer deposits because reserves data are generally unavailable.
Note: One tonne = 1.1023113 short tons = 32,150.746 troy ounces.
| Metal | Unit | Revised Opening Metal Balance, January 2011 | Metal in Ore Mined During 2011 | Metal Apparently Written Off During 2011 | Metal in New Reserves Found During 2011 |
Net Change During 2011 | Closing Metal Balance, December 2011 | % Change During 2011 |
|---|---|---|---|---|---|---|---|---|
| Copper | 000 t | 10,747 | 539 | -430 | 890 | -79 | 10,668 | -0.73% |
| Nickel | 000 t | 3,074 | 162 | -147 | 171 | -137 | 2,936 | -4.46% |
| Lead | 000 t | 400 | 112 | -50 | 9 | -153 | 247 | -38.18% |
| Zinc | 000 t | 4,133 | 696 | -229 | 1,599 | 674 | 4,807 | 16.30% |
| Molybdenum | 000 t | 254 | 10 | -5 | 17 | 2 | 256 | 0.85% |
| Silver | t | 6,916 | 794 | -153 | 984 | 37 | 6,953 | 0.53% |
| Gold | t | 1,473 | 113 | -116 | 799 | 571 | 2,044 | 38.77% |
| Metal | Unit (1) | N.L. | N.S. | N.B. | Que. | Ont. | Man. | Sask. | B.C. | Yukon | N.W.T. | Nun. | Canada (2) |
|---|---|---|---|---|---|---|---|---|---|---|---|---|---|
| Copper | 000 t | 638 | – | 17 | 258 | 2,367 | 331 | – | 6,840 | 218 | – | – | 10,668 |
| Nickel | 000 t | 544 | – | – | 289 | 1,574 | 530 | – | – | – | – | – | 2,936 |
| Lead | 000 t | – | – | 103 | 26 | 26 | – | – | 29 | 63 | – | – | 247 |
| Zinc | 000 t | 100 | – | 265 | 1,326 | 781 | 1,554 | – | 297 | 484 | – | – | 4,807 |
| Molybdenum | 000 t | – | – | – | – | – | – | – | 256 | – | – | – | 256 |
| Silver | t | 89 | – | 331 | 1,241 | 1,946 | 688 | – | 1,194 | 1,464 | – | – | 6,953 |
| Gold | t | 13 | – | – | 667 | 1,101 | 72 | 13 | 96 | 14 | – | 69 | 2,044 |
(1) One tonne = 1.1023113 short tons = 32,150.746 troy ounces. (2) Numbers may not add to totals due to rounding at the provincial or territorial level.
© Her Majesty the Queen in Right of Canada, 2014
Page details
- Date modified: