
Section I : Overview
Minister's Message

I am pleased to present the 2012-13 Departmental Performance Report for Natural Resources Canada (NRCan).
Canada is blessed with a vast incredible wealth of natural resources, which contribute significantly to our national economy. Resource industries play a critical role in delivering jobs, growth and prosperity for Canadians. That is why our government has made such great strides over the past year in our plan for Responsible Resource Development — a plan that has increased the protection of the environment and streamlined regulatory reviews.
Our Government is focused on bolstering investment and job creation, all while protecting Canada’s environment and strengthening Aboriginal consultations. In fact, hundreds of resource projects are planned or proposed across Canada in the next ten years, worth as much as $650 billion dollars.
Enormous opportunities exist for Canada in the global energy market. Canada has massive energy assets and world-leading energy expertise, and is well positioned to help rapidly emerging economies with their growing energy and resource needs.
During the past year, NRCan has seen significant progress on many fronts. Our accomplishments include:
- reaching out to new markets, especially in the burgeoning Asia Pacific region;
- improving environmental standards to protect our children’s future while creating the foundation for their prosperity;
- enhancing energy efficiency to benefit Canadian consumers and businesses;
- making real progress on clean energy, which will create jobs today and a cleaner environment tomorrow;
- restructuring Atomic Energy of Canada Limited and continuing our work to support an improved supply of medical isotopes;
- upgrading our satellite station facilities with new state-of-the-art antennas;
- conducting critical work to define the area of the continental shelf where Canada may exercise its sovereign rights over the natural resources of the seabed;
- collaborating with universities across the country on advanced materials research to develop new technologies for use in the automotive, steel and pipeline industries;
- supporting the ongoing transformation of Canada’s forest sector, driven by innovation and the development of new markets for Canadian forest products; and
- engaging Aboriginal groups and enhancing economic opportunities for Aboriginal peoples through the work of the Special Federal Representative on West Coast Energy Infrastructure.
This report provides more details about the many achievements over the last year at NRCan that support the responsible development of Canada’s natural resources
The Honourable Joe Oliver
P.C., M.P.
Minister of Natural Resources
Section I: Organizational Overview
Raison d’être
NRCan’s vision is to improve the quality of life of Canadians by creating a sustainable resource advantage. It seeks to achieve this vision by working to improve the competitiveness of the natural resource sectors and to grow their contribution to Canada’s economy and by using its knowledge and expertise of Canada’s landmass to support the safety and security of citizens.
Responsibilities
The Minister of Natural Resources is specifically responsible for, or has responsibilities under, more than 30 Acts of ParliamentFootnote 1. The Minister’s core powers, duties and functions are set forth in the Department of Natural Resources Act Footnote 2, the Resources and Technical Surveys Act Footnote 3 and the Forestry ActFootnote 4. NRCan also works in areas of shared responsibility with the provinces.
Within the Government of Canada, the Minister of Natural Resources also has responsibilities for the natural resources portfolioFootnote 5 which includes:
- Atomic Energy of Canada LimitedFootnote 6 (AECL);
- National Energy BoardFootnote 7 (NEB);
- Canadian Nuclear Safety CommissionFootnote 8 (CNSC);
- Canada-Newfoundland and Labrador Offshore Petroleum Board Footnote 9(CNLOPB);
- Canada-Nova Scotia Offshore Petroleum Board Footnote 10 (CNSOPB);
- Northern Pipeline AgencyFootnote 11 (NPA);
- Sustainable Development Technology CanadaFootnote 12 (STDC); and
- Energy Supplies Allocation BoardFootnote 13 (ESAB) (inactive).
To deliver on its responsibilities, NRCan relies on a number of instruments. It uses science and technology (S&T) to help address priorities and plan for the future. It develops policies, programs and regulations that help create a sustainable resource advantage, supporting strong and competitive natural resource sectors that are environmentally and socially responsible. It uses partnerships and international collaboration to help drive progress on natural resource issues that are important to Canadians. More broadly, the Department plays a critical role in Canada’s future, contributing to high-paying jobs, business investment and overall economic growth in Canada’s natural resource sectors. NRCan has offices and laboratories from coast to coast to coast. About half of its 94 occupied facilities are in the National Capital Region, with the remainder being distributed from Atlantic Canada, through Quebec and Ontario, to the Western and Pacific Regions and Northern Canada.
Strategic Outcomes and Program Alignment Architecture
The diagram below presents NRCan’s strategic outcomes and inventory of programs for 2012-13, commonly referred to as the Program Alignment Architecture. Through its programs, NRCan supports the achievement of three Government of Canada outcomes: Strong Economic Growth, A Clean and Healthy Environment, and A Safe and Secure Canada.
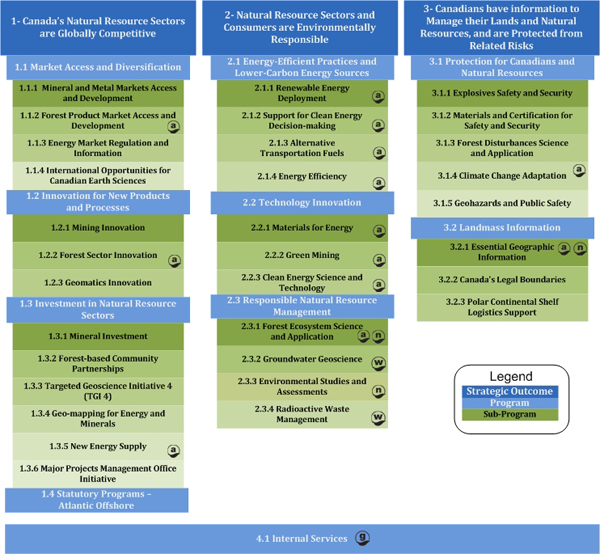
Text Version - Program Alignment Architecture
Program Alignment Architecture – Long descriptions – (Page 3 of the PDF)
1- Canada’s Natural Resource Sectors are Globally Competitive
1.1 Market Access and Diversification
1.1.1 Mineral and Metal Markets Access and Development
1.1.2 Forest Product Market Access and Developmentv
1.1.3 Energy Market Regulation and Information
1.1.4 International Opportunities for Canadian Earth Sciences
1.2 Innovation for New Products and Processes
1.2.1 Mining Innovation
1.2.2 Forest Sector Innovation
1.2.3 Geomatics Innovation
1.3 Investment in Natural Resource Sectors
1.3.1 Mineral Investment
1.3.2 Forest-based Community Partnerships
1.3.3 Targeted Geoscience Initiative 4 (TGI 4)
1.3.4 Geo-mapping for Energy and Minerals
1.3.5 New Energy Supply
1.3.6 Major Projects Management Office Initiative
1.4 Statutory Programs – Atlantic Offshore
2- Natural Resource Sectors and Consumers are Environmentally Responsible
2.1 Energy-Efficient Practices and Lower-Carbon Energy Sources
2.1.1 Renewable Energy Deployment
2.1.2 Support for Clean Energy Decision-making
2.1.3 Alternative Transportation Fuels
2.1.4 Energy Efficiency
2.2 Technology Innovation
2.2.1 Materials for Energy
2.2.2 Green Mining
2.2.3 Clean Energy Science and Technology
2.3 Responsible Natural Resource Management
2.3.1 Forest Ecosystem Science and Application
2.3.2 Groundwater Geoscience
2.3.3 Environmental Studies and Assessments
2.3.4 Radioactive Waste Management
3- Canadians have information to Manage their Lands and Natural Resources, and are Protected from Related Risks
3.1 Protection for Canadians and Natural Resources
3.1.1 Explosives Safety and Security
3.1.2 Materials and Certification for Safety and Security
3.1.3 Forest Disturbances Science and Application
3.1.4 Climate Change Adaptation
3.1.5 Geohazards and Public Safety
3.2 Landmass Information
3.2.1 Essential Geographic Information
3.2.2 Canada’s Legal Boundaries
3.2.3 Polar Continental Shelf Logistics Support
4.1 Internal Services
NRCan’s activities also contribute to the Federal Sustainable Development StrategyFootnote 14 (FSDS) (see legend below).
![]()
![]()
![]()
![]()
*The Management, Results and Resources Structure (MRRS) Policy underwent changes that came into effect in April 2012. Updates have been made to the MRRS nomenclature: “Program Activity Architecture” becomes “Program Alignment Architecture” (PAA); “Program Activity” becomes “Program”; “Sub-Activity” becomes “Sub-Program”.
Organizational Priorities
In 2012-13, NRCan identified five priorities critical to meeting its strategic outcomes and supporting Government of Canada priorities. These priorities have guided the delivery of results, which are presented below for each priority.
The success in delivering each priority is assessed against plans and commitments presented in NRCan’s 2012-13 Report on Plans and PrioritiesFootnote 15.
| Unlock resource potential through responsible development |
Type: Ongoing |
Strategic Outcomes (SO) 1&2 Programs 1.3 & 2.1 |
|
Why this is a priority Investments in Natural Resource Sectors (1.3) NRCan provided policy leadership to advance new initiatives to strengthen pipeline safety, including the development of new regulations to reinforce the National Energy Board’sFootnote 17 compliance and enforcement activities. It also provided scientific analysis to support federal efforts to ensure a world-class tanker safety regime. Investment in natural resources was further supported through the Geo-mapping for Energy and Minerals ProgramFootnote 18 (GEM). GEM released new maps, geophysical surveys and other information on all three territories and northern parts of six provinces to support resource investment and other types of land-use decisions. NRCan also continued to work in collaboration with Aboriginal Affairs and Northern Development Canada and the Canadian Northern Economic Development Agency in solidifying and applying a minerals development cycle approach to facilitate the sustainable development of mineral resources in the North. The Targeted Geoscience Initiative 4Footnote 19 (TGI-4) continued to support industry in developing better exploration methods and innovative ways for deep exploration. TGI-4 also delivered new information that improves stakeholders’ understanding of distal indicators of ore environments and relevant exploration methods and technology. Energy-Efficient Practices and Lower-Carbon Energy Sources (2.1) |
||
| Expand markets and global partnerships |
Type: Ongoing |
Strategic Outcome (SO) 1 Program(s) 1.1 & 1.3 |
|
Why this is a priority Market Access and Diversification (1.1) Canada pursued strategic bilateral engagement with the United States to strengthen their energy and natural resource relationship through various activities such as the annual Canada-US Energy Consultative Mechanism. The discussions were devoted to a wide range of energy issues, including oil market development and the oil market outlook for North America. Other outreach activities were undertaken, including visits by the Minister to promote Canada’s interests in US energy markets. NRCan leveraged multilateral fora to engage key partners and promote Canada as a reliable and responsible supplier of natural resources. For example, NRCan led a Canadian delegation to the meeting of energy ministers of the Asia-Pacific Economic Cooperation in St. Petersburg, Russia. The theme of the meeting was Energy Security: Challenges and Strategic Choices. Under the Expanding Market Opportunities ProgramFootnote 22 for Canadian forest products, NRCan signed contribution agreements valued at $8.5 million to develop offshore markets and another $4.5 million to support research for building code changes and the promotion of greater use of wood in non-residential and mid-rise applications in North America. The Department conducted significant outreach to enhance global market acceptance of Canadian energy and natural resources and to minimize discriminatory measures, such as the European Union’s Fuel Quality DirectiveFootnote 23.These included technical discussions with European officials, a visit by the Minister and engagement of European embassies in Canada. NRCan worked closely with Public Safety CanadaFootnote 24 and Industry CanadaFootnote 25 to develop policies that would allow the Government to deliver on its priority of expanding markets while ensuring that further foreign state control of Canadian business would be of net benefit to Canada. The Department thereby contributed to the clarification of the Government’s policy on investments in Canada by state-owned enterprises. Investments in Natural Resource Sectors (1.3) |
||
| Innovate for competitiveness and environmental performance |
Type: Ongoing |
Strategic Outcomes (SO) 1&2 Program(s) 1.2, 2.1 & 2.2 |
|
Why this is a priority Innovation for New Products and Processes (1.2) The Investments in Forest Industry Transformation Footnote 28(IFIT) program funded six new high-value technologies at forest products facilities, including two advanced bio-technology processes. Energy-Efficient Practices and Lower-Carbon Energy Sources (2.1) Innovation Technology (2.2) Contribution agreements were signed with provincial partners on alternative technologies for medical isotope production through the Isotope Technology Acceleration ProgramFootnote 31 (ITAP). NRCan undertook research and development (R&D) projects in collaboration with automotive parts suppliers and original equipment manufacturers—such as Cosma, Meridian, General Motors and Ford—which also help to enhance the competitiveness of Canadian industry. The types of technology developed included high formability aluminum sheet, high-integrity casting of magnesium components, friction stir welding, spot welding, and durability of aluminum joints. All of these technologies enable the manufacture of novel body structures that can reduce the weight of vehicles and thereby increase fuel economy. Budget 2013 announced the allocation of an additional $325 million to Sustainable Development Technology Canada (SDTC) over the next eight years, which would bring federal investments to a total of $915 million and would extend the end date of SDTC to 2020-21 once a new agreement is reached. |
||
| Leverage S&T knowledge for safety and security risk management |
Type: Ongoing |
Strategic Outcome (SO) 3 Program(s) 3.1 & 3.2 |
|
Why this is a priority Protection for Canadians and Natural Resources (3.1) Landmass Information (3.2) NRCan invested in its satellite infrastructure to address the growing demand and application of satellite imagery. Also, in 2012-13, NRCan launched the new GeoGratisFootnote 33 web site. The site, which houses over 180,000 geospatial datasets, enables users to more efficiently search for datasets that can be used in the development of new and innovative location-based applications. NRCan also launched the Federal Geospatial PlatformFootnote 34 initiative, which is consistent with Canada's Action Plan on Open GovernmentFootnote 35. This Platform will support data access, integration, analysis and visualization capacity to inform socioeconomic and environmental decision-making. These enhancements will allow users to develop innovative location-based applications tailored to their needs based on accurate and authoritative data, providing greater capacity to carry out safety and security risk management. |
||
| Increase the effectiveness and efficiency of NRCan operations |
Type: Ongoing |
Internal Services Program 4.1 |
|
Why this is a priority The Department implemented, or took steps to implement, government-wide efficiency initiatives. It transferred selected information technology services and 76 associated employees to Shared Services Canada. It completed three of the seven phases of the Common Human Resources Business Process, positioning the Department to meet the government-wide deadline for implementation. It launched a new, user-tested structure for a consolidated website, which will position it to transition to a single, Government of Canada website. And it carefully implemented workforce adjustment, monitoring progress through a Deputy Minister-led Implementation Steering Committee. NRCan undertook a number of department-specific initiatives. As part of its business transformation agenda, it is implementing GCDocs, which will transform the way its employees manage, access and use information. Through this project, the department will establish a new platform for electronic document and records management and will be able to cost-effectively implement the Treasury Board Directive on RecordkeepingFootnote 36. Actions were also taken to optimize the contribution of a smaller workforce. Performance reviews were completed for 95% of employees. The Department began implementation of its Wellness and Disability Management Initiative. And it published a Role of the Manager paper, explaining the basics of management in the Public Service. Finally, the Department took efforts to improve the effectiveness and efficiency of future investment decisions. It developed an Investment Plan and adopted a directive on Investment Planning and Project Management. It also developed an Information Management Technology Strategic Plan. |
||
Risk Analysis
In 2012-13, the Department managed a range of key risks, both strategic and operational, which are contained in its Corporate Risk Profile. Two of those risks—Market Diversification and Barriers to Investment, and Hazards and Emergency Management—are discussed here.
Context
Canada’s natural resource sectors—which directly and indirectly account for almost one-fifth of the country’s nominal Gross Domestic Product (GDP) and close to 1.8 million jobs—face both risks and opportunities in trying to diversify markets and reduce barriers to investment. The risks are particularly acute for the energy sector. Canada’s only customer for crude oil and gas, the United States, is expected to become not only energy self-sufficient in the next 20 years, but also a net exporter of liquefied natural gas. Oil transportation capacity is already tight, and will potentially be insufficient by 2016-17 to accommodate the expected growth in oil sands production. At the same time, however, the rapid growth in emerging economies presents opportunities for Canada to diversify its markets. According to the International Energy Agency, China is now the largest energy consumer in the world and India is set to become the third largest consumer by 2030.
Without concerted action to diversify our energy markets, Canada will be unable to fully realize the economic and social benefits of its natural resource endowment. New and improved infrastructure is needed to transport oil west, east and south to accommodate growing production from the oil sands, access the growing Asia-Pacific markets and to ensure Canada can obtain the best prices for its oil. For liquefied natural gas, export is the only means by which Canada can secure long-term contracts and sustain its natural gas industry in a growing, competitive market.
Canada’s natural resource sectors also face barriers to investment stemming from economic, environmental, and social factors. Development projects are capital intensive and highly sensitive to market volatility, labour and cost pressures, and fiscal regimes, and as global competition increases, investors have other options. This is why NRCan is undertaking regulatory reform under the plan for Responsible Resource Development to establish both certainty of timelines and better regulatory instruments that align with those of the provinces.
With respect to hazards and emergency management, NRCan plays a key role—in partnership with other government departments and stakeholders—in ensuring the safety and security of Canadians by providing timely and accurate scientific and technical information as well as advice and guidance on natural hazards. By providing knowledge on Canada’s lands and natural resources, NRCan enables informed decision making and facilitates the responsible development and management of Canada’s natural resources and land.
| Risk | Risk Response Strategy | Link to PAA * |
Link to Priorities |
|---|---|---|---|
|
Market Diversification and Barriers to Investment |
Through its policy, programs and science and technology, NRCan supports the diversification of markets for Canada’s natural resources and the reduction of barriers to investment. The effectiveness of NRCan’s risk responses is reflected in, for example, the increase of 54% in the value of exports of natural resource products during the period 2003 to 2012; they now represent more than half of all domestic exports. Comparatively, exports of all other goods, excluding those associated with the natural resource sectors, fell by 3% during the same period. Despite global market volatility, investors continue to pursue a range of opportunities for oil and liquefied natural gas infrastructure in Canada. Currently, 140 major oil and gas projects, valued at $310 billion, are under way or planned over the next 10 years. Proposed oil pipelines alone would add up to 3 million barrels per day of export capacity by 2018. Further, NRCan’s activities contributed to foreign direct investment in Canada’s natural resources of $217 billion in 2012, accounting for a third of Canada’s total foreign investment, a percentage that has remained stable for the past five years. In 2012-13, NRCan undertook a number of initiatives to address the risks and opportunities identified above, including:
|
Canada’s natural resource sectors are globally competitive Natural resource sectors and consumers are environmentally responsible Canadians have information to manage their lands and natural resources, and are protected from related risks |
Expand markets and global partnerships Unlock resource potential through responsible resource development |
|
Hazards and Emergency Management |
NRCan continuously scans its environment and that of the natural resource sectors to identify existing and emerging risks, assesses the potential impacts on the natural resource sectors, and ensures that it has the proper strategies, policies, programs, regulations and capacity in place to respond. The effectiveness of NRCan’s risk responses is reflected in stakeholders’ use of the Department’s data, tools and expertise to manage and mitigate risks and hazards. For example, the District of North Vancouver incorporated NRCan’s seismic risk assessment scenarios into its sustainable hazard risk management and disaster risk reduction initiatives. The Canadian Commission on Building and Fire Codes incorporated NRCan’s information into the National Building Code. And the Canadian Space Agency used NRCan's analysis of the radiation environment to inform the design of its Polar Communication and Weather mission. In 2012-13, NRCan undertook a number of initiatives to address the risks identified above, including:
|
Canadians have information to manage their lands and natural resources, and are protected from related risks |
Leverage S&T knowledge for safety and security risk management |
*Program Alignment Architecture
Summary of Performance
NRCan revised its 2012-13 Program Alignment Architecture (PAA) in an effort to better showcase its contribution to Canada and Canadians and more effectively measure results.
Throughout this report, the amount in the Difference column is calculated as Planned minus Actual for both financial and human resources.
| Total Budgetary Expenditures |
Planned Spending |
Total Authorities |
Actual Spending |
Difference | |
|---|---|---|---|---|---|
| Program Spending | 1,676,903 | 1,676,903 | 1,706,002 | 1,281,846 | 395,057 |
| Statutory Programs – Atlantic Offshore |
1,134,954 | 1,134,954 | 684,965 | 684,965 | 449,989 |
| TOTAL | 2,811,857 | 2,811,857 | 2,390,967 | 1,966,811 | 845,046 |
| Planned | Actual | Difference |
|---|---|---|
| 4,495 | 4,224 | 271 |
*FTEs are a measure of the extent to which an employee represents a full person-year charge against a departmental budget. FTEs are calculated as a ratio of assigned hours of work to scheduled hours of work. Scheduled hours of work are set out in collective agreements.
Performance Summary Tables – For Strategic Outcomes and Programs
Strategic Outcome 1: Canada’s Natural Resource Sectors are Globally Competitive
| Programs | Total Budgetary Expenditures 2012-13 |
Planned Spending | Total Authorities 2012-13 |
Actual Spending | Alignment to Government of Canada Outcomes |
||||
|---|---|---|---|---|---|---|---|---|---|
| 2012-13 | 2013-14 | 2014-15 | 2012-13 | 2011-12 | 2010-11 | ||||
|
Market Access and Diversification |
28,258
|
28,258
|
44,913
|
42,764
|
57,374
|
55,420
|
*
|
*
|
Strong economic growthFootnote 37 |
|
Innovation for New Products and Processes |
71,292
|
71,292
|
102,525
|
61,787
|
99,731
|
93,948
|
*
|
*
|
|
|
Investment in Natural Resource Sectors |
74,618
|
74,618
|
54,484
|
48,508
|
74,985
|
73,319
|
*
|
*
|
|
|
Statutory Programs — Atlantic Offshore |
1,134,954
|
1,134,954
|
1,255,167
|
1,100,100
|
684,965
|
684,965
|
*
|
*
|
|
| Strategic Outcome 1 Sub-Total |
1,309,122
|
1,309,122
|
1,457,089
|
1,253,159
|
917,054
|
907,652
|
*
|
*
|
|
*Actual Spending for 2011-12 reflects that year’s PAA structure, for which there were two program activities under Strategic Outcome 1: 1.1 Economic Opportunities for Natural Resources (Actual Spending for 2011-12 of $1,439,492,491), which includes the Statutory Programs related to the Atlantic Offshore, with Actual Spending for 2011-12 of $1,222,730,140), and 1.2 Natural Resource-based Communities (Actual Spending for 2011-12 of $23,288).
Actual Spending for 2010-11 reflects that year’s PAA structure, for which there were two program activities under Strategic Outcome 1: 1.1 Economic Opportunities for Natural Resources (Actual Spending for 2010-11 of $2,351,960,558), which includes the Statutory Programs related to the Atlantic Offshore, and Actual Spending for 2010-11 of $2,103,259,499) and 1.2 Natural Resource-based Communities (Actual Spending for 2010-11 of $12,683,530).
The difference between Planned Spending and Total Authorities is mainly attributable to adjustments of statutory payments under the Newfoundland Offshore Petroleum Resource Revenue Fund, the payments to the Nova Scotia Offshore Revenue Account, the Crown Share Adjustment Payment for Nova Scotia Offshore Petroleum Resources and the announcement in Canada’s Economic Action Plan 2012 of funding to support the Forest Innovation Program and Expanding Market Opportunities Program.
Strategic Outcome 2: Natural Resource Sectors and Consumers are Environmentally Responsible
| Programs | Total Budgetary Expenditures 2012-13 |
Planned Spending | Total Authorities 2012-13 |
Actual Spending | Alignment to Government of Canada Outcomes |
||||
|---|---|---|---|---|---|---|---|---|---|
| 2012-13 | 2013-14 | 2014-15 | 2012-13 | 2011-12 | 2010-11 | ||||
| Energy-Efficient Practices and Lower-Carbon Energy Sources | 585,488 | 585,488 | 444,318 | 464,096 | 521,650 | 342,425 | * | * |
A clean and healthy environmentFootnote 38
|
| Technology Innovation | 430,843 | 430,843 | 265,762 | 202,009 | 290,673 | 152,200 | * | * | |
|
Responsible Natural Resource Management |
234,547 | 234,547 | 341,051 | 157,779 | 310,838 | 236,875 | * | * | |
| Strategic Outcome 2 Sub-Total |
1,250,878 | 1,250,878 | 1,051,131 | 823,885 | 1,123,161 | 731,500 | * | * | |
*Actual Spending for 2011-12 reflects that year’s PAA structure, for which there were two program activities under Strategic Outcome 2: 2.1 Clean Energy (Actual Spending for 2011-12 of $1,323,313,646) and 2.2 Ecosystem Risk Management (Actual Spending for 2011-12 of $199,083,001).
Actual Spending for 2010-11 reflects that year’s PAA structure, for which there were two program activities under Strategic Outcome 2: 2.1 Clean Energy (Actual Spending for 2010-11 of $1,329,561,608) and 2.2 Ecosystem Risk Management (Actual Spending for 2010-11 of $198,295,951).
The difference between Planned Spending and Total Authorities is primarily a result of Budget 2012 Savings Measures in relation to ecoENERGY for Biofuels, ecoENERGY for Renewable Power, ecoENERGY for Innovation Initiative, lapsing funds due to, on average, lower incentive amounts claimed by project proponents under ecoENERGY for Renewable Power, the use of funding related to the reprofiling of the Clean Energy Fund, and the announcement in Budget 2012 of funding to compensate property owners and municipalities for potential losses as part of the Port Hope Area Initiative.
Strategic Outcome 3: Canadians have Information to Manage their Lands and Natural Resources, and are Protected from Related Risks
| Programs | Total Budgetary Expenditures 2012-13 |
Planned Spending | Total Authorities 2012-13 |
Actual Spending | Alignment to Government of Canada Outcomes |
||||
|---|---|---|---|---|---|---|---|---|---|
| 2012-13 | 2013-14 | 2014-15 | 2012-13 | 2011-12 | 2010-11 | ||||
|
Protection for Canadians and Natural Resources |
56,020 | 56,020 | 59,202 | 58,051 | 60,234 | 55,604 | * | * |
A safe and secure CanadaFootnote 39
|
|
Landmass Information |
48,117 | 48,117 | 44,500 | 41,888 | 103,326 | 90,961 | * | * | |
| Strategic Outcome 3 Sub-Total |
104,137 | 104,137 | 103,702 | 99,939 | 163,560 | 146,565 | * | * | |
*Actual Spending for 2011-12 reflects that year’s PAA structure, for which there were three program activities under Strategic Outcome 3: 3.1 Adapting to a Changing Climate and Hazard Risk Management (Actual Spending for 2011-12 of $50,834,868), 3.2 Natural Resource and Landmass Knowledge and Systems (Actual Spending for 2011-12 of $87,235,443) and 3.3 Geomatics Canada Revolving Fund (Actual Spending for 2011-12 of $444,250).
Actual Spending for 2010-11 reflects that year’s PAA structure, for which there were three program activities under Strategic Outcome 3: 3.1 Adapting to a Changing Climate and Hazard Risk Management (Actual Spending for 2010-11 of $60,822,193), 3.2 Natural Resource and Landmass Knowledge and Systems (Actual Spending for 2010-11 of $95,524,071) and 3.3 Geomatics Canada Revolving Fund (Actual Spending deficit for 2010-11 of $253,414).
The difference between Planned Spending and Total Authorities is primarily a result of the funding for the Revitalization of NRCan’s Satellite Station Facilities across Canada and the transfer from National Defence for the construction of the Canadian Forces Arctic Training Centre.
Performance Summary Table – For Internal Services ($ thousands)
| Total Budgetary Expenditures 2012-13 |
Planned Spending | Total Authorities 2012-13 |
Actual Spending | |||||
|---|---|---|---|---|---|---|---|---|
| 2012-13 | 2013-14 | 2014-15 | 2012-13 | 2011-12 | 2010-11 | |||
|
Internal Services |
147,720 | 147,720 | 155,862 | 139,913 | 187,192 | 181,093 | 251,746 | 308,434 |
| Sub-Total | 147,720 | 147,720 | 155,862 | 139,913 | 187,192 | 181,093 | 251,746 | 308,434 |
The difference between Planned Spending and Total Authorities results from increases received in Supplementary Estimates to support internal services where programs have also been increased through Supplementary Estimates and increases resulting from programs paying for internal services in year.
Performance Summary Table – Total Spending ($ thousands)
| Total Budgetary Expenditures 2012-13 |
Planned Spending | Total Authorities 2012-13 |
Actual Spending | |||||
|---|---|---|---|---|---|---|---|---|
| 2012-13 | 2013-14 | 2014-15 | 2012-13 | 2011-12 | 2010-11 | |||
|
Strategic Outcomes and Internal Services |
2,811,857 | 2,811,857 | 2,767,784 | 2,316,896 | 2,390,967 | 1,966,811 | 3,352,173 | 4,357,029 |
| Total | 2,811,857 | 2,811,857 | 2,767,784 | 2,316,896 | 2,390,967 | 1,966,811 | 3,352,173 | 4,357,029 |
NRCan's Planned Spending of $2.81 billion was adjusted during the year to $2.39 billion to reflect the changes in authorities granted in Budget 2012 and adjustments to statutory items. The overall reduction of $0.42 billion is explained by a combination of increases and decreases. Increases include funding for the Port Hope Area Initiative, Forest Innovation Program and Expanding Market Opportunities Program, Government Advertising Campaign, the Revitalization of NRCan’s Satellite Station Facilities across Canada, Isotope Technology Acceleration Program, Major Projects Management Office Initiative, the transfer from National Defence for the construction of the Canadian Forces Arctic Training Centre and an increase with the new statutory item of Crown Share Adjustment Payment for Nova Scotia Offshore Petroleum Resources. Decreases include Budget 2012 Savings Measures, return to the fiscal framework of reprofiled Clean Energy Funds, payments to the Newfoundland Offshore Petroleum Resource Revenue Fund, which were lower than initially forecasted due to decreases in production resulting from the shut-down of oil producing platforms, and payments to the Nova Scotia Offshore Revenue Account, which were lower due to decreases in production resulting from depressed natural gas prices and reduction in operating capacity.
NRCan's Actual Spending of $1.967 billion compared to total authorities of $2.391 billion resulted in a lapse of $424 million, primarily due to lapses in the Grants and Contributions Vote pertaining to the ecoENERGY for Biofuels program, Clean Energy Fund, and the Grant to Sustainable Development Technology Canada’s* Next Generation Biofuels Fund and a lapse in the Operating Vote for the Port Hope Area Initiative. These lapses are mainly due to lower-than-anticipated fuel production levels for ecoENERGY for Biofuels, reduced funding requirements from Sustainable Development Technology Canada for the Next Generation Biofuels Fund, reprofiling of funds to future years for the Clean Energy Fund and the Enhancing Competiveness in a Changing Climate Program, and delays in the implementation of the Port Hope Area Initiative. Also various other items were reprofiled in the Operating Vote.
*Sustainable Development Technology Canada (SDTC) is an arm’s length organization created by the Government of Canada to demonstrate new technologies to promote sustainable development, including technologies to address issues related to climate change and the quality of air, water and soil.
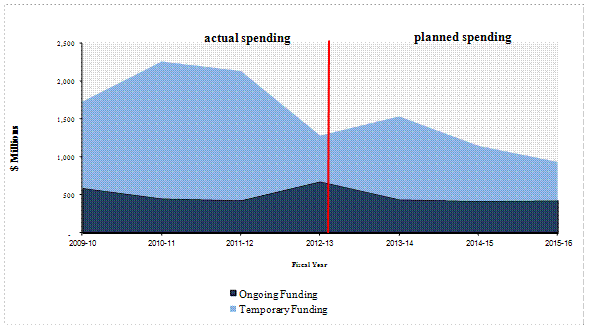
Expenditure Profile
The graph below illustrates the departmental spending trend for the period 2009-10 to 2015-16, excluding statutory funding. Note that it does not include information from Budget 2013.
Funding
Text Version - Spending Trends
The graph below illustrates the departmental spending trend for the period 2009-10 to 2015-16, excluding statutory funding. Note that it does not include information from Budget 2013.
| 2009-10 | 2010-11 | 2011-12 | 2012-13 | 2013-14 | 2014-15 | 2015-16 | |
|---|---|---|---|---|---|---|---|
| Ongoing Funding | 591,935,567 | 455,462,093 | 430,465,079 | 678,700,653 | 442,456,682 | 420,865,581 | 429,262,159 |
| Temporary Funding | 1,135,328,000 | 1,798,308,317 | 1,698,978,474 | 603,145,542 | 1,090,660,446 | 725,092,643 | 506,028,623 |
NRCan’s ongoing funding is holding at a fairly consistent level, although it has seen some reductions through both Strategic Review 2009 and Budget 2012 Savings Measures.
NRCan had a significant spike in temporary funding during the period 2008-09 to 2011-12, resulting principally from programs announced as part of Canada’s Economic Action Plan 2009, including the Pulp and Paper Green Transformation Program and the ecoENERGY Retrofit Homes grant program. As these programs have terminated, NRCan’s spending trend for programs with temporary funding has declined. Additionally, as the department moves into 2013-14 and future years, other programs (such as Investments in Forest Industry Transformation and the Clean Energy Fund) are scheduled to sunset and other programs (such as ecoENERGY for Biofuels) have declining funding profiles. NRCan recognizes that some of these programs may continue, which—depending on the amount of renewal—could level the spending trend in temporary funding over the period 2012-13 to 2015-16.
NRCan’s statutory payments are primarily associated with the offshore agreements between the Government of Canada and the provinces of Nova Scotia and Newfoundland and Labrador. As the majority of the statutory payments are related to revenue, the spending trend for statutory payments fluctuates depending on a number of factors such as production and pricing levels.
NRCan’s projected spending profile indicates a declining trend in expenditures after fiscal year 2011-12 as a result of sunsetting funding for Canada’s Economic Action Plan initiatives as well as other programs, notably the Pulp and Paper Green Transformation Program ($549.8 million), the ecoENERGY Retrofit – Homes program ($400 million), and the ecoENERGY Technology Initiative ($48.7 million).
Estimates by Vote
For information on NRCan’s organizational Votes and/or statutory expenditures, see the Public Accounts of Canada 2013 (Volume II). Footnote 40 An electronic version of the Public Accounts 2013 is available on the Public Works and Government Services Canada’s websiteFootnote 41.
Contribution to the Federal Sustainable Development Strategy
The Federal Sustainable Development Strategy (FSDS) fulfills the requirements of the Federal Sustainable Development ActFootnote 42, as passed by Parliament in 2008. It outlines the Government of Canada’s commitment to improving the transparency of environmental decision-making by articulating its key strategic environmental goals and targets. The FSDS brings together goals, targets, and implementation strategies organized under four themes:


Addressing Climate Change and Air Quality
NRCan supports the goals of this theme, which are to reduce greenhouse gas (GHG) emissions and mitigate the impacts of climate change, as well as to minimize the threats to air quality so that the air Canadians breathe is clean and supports healthy ecosystems. NRCan contributes to GHG mitigation and air quality through the following sub-programs: Forest Products Market Access and Development (1.1.2); Forest Sector Innovation (1.2.2); New Energy Supply (1.3.5); Renewable Energy Deployment (2.1.1); Support for Clean Energy Decision-making (2.1.2); Alternative Transportation Fuels (2.1.3); Energy Efficiency (2.1.4); Materials for Energy (2.2.1); Green Mining (2.2.2); Clean Energy Science and Technology (2.2.3); Forest Ecosystem Science and Application (2.3.1); Climate Change Adaptation (3.1.4); and Essential Geographic Information (3.2.1).
Maintaining Water Quality and Availability
NRCan supports the goals to protect and enhance the quality of water so that it is clean, safe and secure for all Canadians and supports healthy ecosystems through activities under the Radioactive Waste Management sub-program (2.3.4). NRCan also supports the goal to enhance resources in a manner consistent with the sustainability of the resource, through the Groundwater Geoscience sub-program (2.3.2).
Protecting Nature
NRCan supports the goals to maintain productive and resilient ecosystems with the capacity to recover and adapt; and protect areas in ways that leave them unimpaired for present and future generations through the Environmental Studies and Assessment sub-program (2.3.3). NRCan also supports the goal that sustainable production and consumption of biological resources are within ecosystem limits though the Forest Ecosystem Science and Application sub-program (2.3.1).
NRCan contributes to progress in all FSDS themes through its programs as articulated in its Departmental Sustainable Development Strategy. For details on the contribution of programs to sustainable development, consult the departmental website Footnote 43.
NRCan plays a key role in delivering on the Government’s Clean Air Agenda (CAA) Footnote 44 by leading on the clean energy component, as well as contributing to adaptation and international engagement efforts such as the Canada-US Clean Energy DialogueFootnote 45. In Budget 2011, the Government renewed its commitment to the CAA as part of Canada’s Economic Action PlanFootnote 46 with a focus on regulatory actions to achieve real emissions reductions while maintaining Canada’s economic advantage.
Strategic Environmental Assessments
During 2012-13, NRCan considered the environmental effects of initiatives subject to the Cabinet Directive on the Environmental Assessment of Policy, Plan and Program Proposals Footnote 47. Through a strategic environmental assessment process, 38% of departmental initiatives were found to contribute to the above FSDS themes, goals and targets, with the majority contributing to themes I, III and IV. The remaining 62% were not applicable to the FSDS.
NRCan’s web site offers more information on strategic environmental assessmentsFootnote 48 and activitiesFootnote 49 that support sustainable development. Complete information on the FSDS can be found on the Environment Canada website Footnote 50.
Page details
- Date modified: