Fuel Focus, April 8, 2013
Table of Contents
- National Overview
- Recent Developments
- Retail Gasoline Overview
- Wholesale Gasoline Prices
- Gasoline Refining and Marketing Margins
- Crude Oil Overview
- Download the report
National Overview
National Retail Gasoline Prices Decreased 1 Cent per Litre from Last Week
Canadian retail pump prices decreased by 1 cent per litre to a six-week low of $1.29 per litre for the week ending April 2, 2013. Average Canadian pump prices declined mainly due to lower wholesale gasoline prices.
Diesel fuel prices rose by less than 1 cent per litre to $1.31 per litre compared to the previous week. This represents an increase of 1 cent per litre from the same period last year. Furnace oil prices rose by less than 1 cent per litre to $1.23 per litre from the previous week.
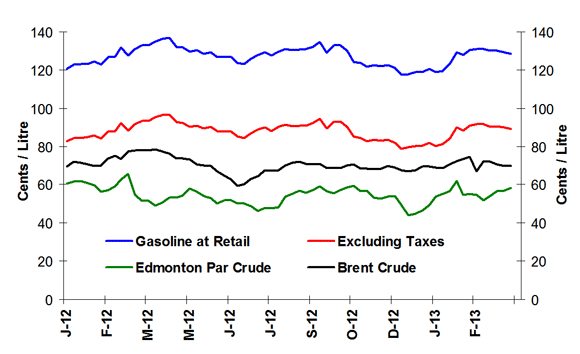
Figure 1: Crude Oil and Regular Gasoline Price Comparison
(National Average)
text version - Figure 1
The graph shows prices in cents per litre for gasoline at retail, gasoline excluding taxes, and Edmonton Par and Brent crude oil prices. Gasoline prices ended the period of April 2, 2013 at 128.7 cents per litre, excluding taxes at 89.3 cents per litre, Edmonton Par at 58.4 cents per litre and Brent at 69.9 cents per litre.
| Dates | Gasoline at retail | Excluding Taxes | Edmonton Par crude | Brent crude |
|---|---|---|---|---|
| 03/01/2012 | 120.6 | 82.7 | 60.5 | 69.6 |
| 10/01/2012 | 122.9 | 84.4 | 61.7 | 72.1 |
| 17/01/2012 | 123.0 | 84.4 | 61.8 | 71.8 |
| 24/01/2012 | 123.3 | 84.8 | 61.0 | 70.4 |
| 31/01/2012 | 124.7 | 86.0 | 59.7 | 69.7 |
| 07/02/2012 | 122.7 | 84.2 | 56.1 | 70.2 |
| 14/02/2012 | 126.7 | 87.8 | 57.1 | 73.6 |
| 21/02/2012 | 127.0 | 88.1 | 58.9 | 75.1 |
| 28/02/2012 | 131.7 | 92.4 | 62.6 | 73.4 |
| 06/03/2012 | 127.3 | 88.5 | 65.6 | 77.5 |
| 13/03/2012 | 131.0 | 91.8 | 54.9 | 77.9 |
| 20/03/2012 | 132.8 | 93.4 | 51.6 | 78.2 |
| 27/03/2012 | 132.7 | 93.3 | 51.7 | 78.1 |
| 03/04/2012 | 135.1 | 95.2 | 48.9 | 78.3 |
| 10/04/2012 | 136.4 | 96.4 | 50.8 | 77.5 |
| 17/04/2012 | 136.7 | 96.7 | 52.9 | 76.2 |
| 24/04/2012 | 132.0 | 92.6 | 53.4 | 73.9 |
| 01/05/2012 | 131.9 | 92.4 | 54.4 | 73.9 |
| 08/05/2012 | 129.5 | 90.3 | 58.1 | 73.0 |
| 15/05/2012 | 130.3 | 91.0 | 56.2 | 70.7 |
| 22/05/2012 | 128.5 | 89.4 | 54.2 | 70.2 |
| 29/05/2012 | 129.3 | 90.1 | 53.0 | 69.9 |
| 05/06/2012 | 126.8 | 88.0 | 50.0 | 66.8 |
| 12/06/2012 | 126.7 | 87.9 | 51.9 | 64.7 |
| 19/06/2012 | 126.8 | 87.9 | 52.1 | 62.6 |
| 26/06/2012 | 123.7 | 85.2 | 50.3 | 59.5 |
| 03/07/2012 | 123.1 | 84.5 | 50.3 | 60.0 |
| 10/07/2012 | 126.0 | 87.1 | 48.8 | 63.1 |
| 17/07/2012 | 128.0 | 88.8 | 46.0 | 64.3 |
| 24/07/2012 | 129.2 | 89.9 | 48.0 | 67.7 |
| 31/07/2012 | 127.3 | 88.2 | 47.6 | 67.4 |
| 07/08/2012 | 129.7 | 90.3 | 48.5 | 67.5 |
| 14/08/2012 | 131.0 | 91.2 | 53.6 | 70.3 |
| 21/08/2012 | 130.3 | 90.5 | 55.1 | 71.8 |
| 28/08/2012 | 130.7 | 90.9 | 56.9 | 72.1 |
| 04/09/2012 | 130.9 | 91.1 | 55.9 | 70.8 |
| 11/09/2012 | 132.2 | 92.2 | 57.3 | 70.4 |
| 18/09/2012 | 134.6 | 94.4 | 59.0 | 71.0 |
| 25/09/2012 | 128.9 | 89.4 | 56.7 | 68.6 |
| 02/10/2012 | 132.8 | 92.8 | 55.3 | 69.1 |
| 09/10/2012 | 133.0 | 93.0 | 57.2 | 68.6 |
| 16/10/2012 | 130.1 | 90.4 | 58.7 | 70.3 |
| 23/10/2012 | 124.3 | 85.3 | 59.6 | 70.5 |
| 30/10/2012 | 123.5 | 84.5 | 56.6 | 68.5 |
| 06/11/2012 | 121.6 | 82.7 | 57.0 | 68.3 |
| 13/11/2012 | 122.5 | 83.5 | 53.5 | 68.0 |
| 20/11/2012 | 122.2 | 83.2 | 52.7 | 68.6 |
| 27/11/2012 | 122.6 | 83.5 | 53.8 | 69.7 |
| 04/12/2012 | 120.9 | 81.9 | 54.2 | 69.0 |
| 11/12/2012 | 117.3 | 78.7 | 49.4 | 67.8 |
| 18/12/2012 | 117.7 | 79.5 | 44.1 | 67.1 |
| 25/12/2012 | 119.0 | 80.3 | 44.8 | 67.7 |
| 01/01/2013 | 118.9 | 80.4 | 46.6 | 69.3 |
| 08/01/2013 | 120.6 | 81.9 | 49.4 | 69.5 |
| 15/01/2013 | 118.9 | 80.3 | 53.7 | 69.2 |
| 22/01/2013 | 119.7 | 81.1 | 55.2 | 68.7 |
| 29/01/2013 | 123.3 | 84.3 | 56.6 | 70.7 |
| 05/02/2013 | 129.2 | 89.7 | 61.9 | 72.5 |
| 12/02/2013 | 127.7 | 88.4 | 54.8 | 73.5 |
| 19/02/2013 | 130.5 | 90.9 | 55.3 | 74.6 |
| 26/02/2013 | 131.2 | 91.6 | 54.7 | 67.1 |
| 05/03/2013 | 131.2 | 91.6 | 51.8 | 72.5 |
| 12/03/2013 | 129.9 | 90.4 | 54.2 | 71.8 |
| 19/03/2013 | 130.1 | 90.7 | 56.7 | 70.6 |
| 26/03/2013 | 129.4 | 90.0 | 57.0 | 69.7 |
| 02/04/2013 | 128.7 | 89.3 | 58.4 | 69.9 |
Figure 2: Weekly Regular Gasoline Prices

text version - Figure 2
This graph shows the gasoline price trends from 2011 to 2013.
| 2011 | 2012 | 2013 | |||
|---|---|---|---|---|---|
| Gasoline at Retail | Gasoline at Retail | Gasoline at Retail | |||
| 11-01-04 | 113.30 | 12-01-03 | 120.60 | 13-01-01 | 118.90 |
| 11-01-11 | 113.10 | 12-01-10 | 122.90 | 13-01-08 | 120.60 |
| 11-01-18 | 115.60 | 12-01-17 | 123.00 | 13-01-15 | 118.90 |
| 11-01-25 | 114.90 | 12-01-24 | 123.30 | 13-01-22 | 119.70 |
| 11-02-01 | 113.70 | 12-01-31 | 124.70 | 13-01-29 | 123.30 |
| 11-02-08 | 112.90 | 12-02-07 | 122.70 | 13-02-05 | 129.20 |
| 11-02-15 | 114.60 | 12-02-14 | 126.70 | 13-02-12 | 127.70 |
| 11-02-22 | 115.10 | 12-02-21 | 127.00 | 13-02-19 | 130.50 |
| 11-03-01 | 120.60 | 12-02-28 | 131.70 | 13-02-26 | 131.20 |
| 11-03-08 | 124.50 | 12-03-06 | 127.30 | 13-03-05 | 131.20 |
| 11-03-15 | 123.50 | 12-03-13 | 131.00 | 13-03-12 | 129.90 |
| 11-03-22 | 121.80 | 12-03-20 | 132.80 | 13-03-19 | 130.10 |
| 11-03-29 | 125.40 | 12-03-27 | 132.70 | 13-03-26 | 129.40 |
| 11-04-05 | 127.70 | 12-04-03 | 135.10 | 13-04-02 | 128.70 |
| 11-04-12 | 129.70 | 12-04-10 | 136.40 | 13-04-09 | |
| 11-04-19 | 133.40 | 12-04-17 | 136.70 | 13-04-16 | |
| 11-04-26 | 133.90 | 12-04-24 | 132.00 | 13-04-23 | |
| 11-05-03 | 135.70 | 12-05-01 | 131.90 | 13-04-30 | |
| 11-05-10 | 135.40 | 12-05-08 | 129.50 | 13-05-07 | |
| 11-05-17 | 130.90 | 12-05-15 | 130.30 | 13-05-14 | |
| 11-05-24 | 127.20 | 12-05-22 | 128.50 | 13-05-21 | |
| 11-05-31 | 129.90 | 12-05-29 | 129.30 | 13-05-28 | |
| 11-06-07 | 127.60 | 12-06-05 | 126.80 | 13-06-04 | |
| 11-06-14 | 127.30 | 12-06-12 | 126.70 | 13-06-11 | |
| 11-06-21 | 126.60 | 12-06-19 | 126.80 | 13-06-18 | |
| 11-06-28 | 124.50 | 12-06-26 | 123.70 | 13-06-25 | |
| 11-07-05 | 125.80 | 12-07-03 | 123.10 | 13-07-02 | |
| 11-07-12 | 127.90 | 12-07-10 | 126.00 | 13-07-09 | |
| 11-07-19 | 128.40 | 12-07-17 | 128.00 | 13-07-16 | |
| 11-07-26 | 128.10 | 12-07-24 | 129.20 | 13-07-23 | |
| 11-08-02 | 128.40 | 12-07-31 | 127.30 | 13-07-30 | |
| 11-08-09 | 125.50 | 12-08-07 | 129.70 | 13-08-06 | |
| 11-08-16 | 126.40 | 12-08-14 | 131.00 | 13-08-13 | |
| 11-08-23 | 126.00 | 12-08-21 | 130.30 | 13-08-20 | |
| 11-08-30 | 128.00 | 12-08-28 | 130.60 | 13-08-27 | |
| 11-09-06 | 128.60 | 12-09-04 | 130.90 | 13-09-03 | |
| 11-09-13 | 127.20 | 12-09-11 | 132.20 | 13-09-10 | |
| 11-09-20 | 124.90 | 12-09-18 | 134.60 | 13-09-17 | |
| 11-09-27 | 123.90 | 12-09-25 | 128.90 | 13-09-24 | |
| 11-10-04 | 123.40 | 12-10-02 | 132.80 | 13-10-01 | |
| 11-10-11 | 125.60 | 12-10-09 | 133.00 | 13-10-08 | |
| 11-10-18 | 126.40 | 12-10-16 | 130.10 | 13-10-15 | |
| 11-10-25 | 124.00 | 12-10-23 | 124.30 | 13-10-22 | |
| 11-11-01 | 121.90 | 12-10-30 | 123.50 | 13-10-29 | |
| 11-11-08 | 124.70 | 12-11-06 | 121.60 | 13-11-05 | |
| 11-11-15 | 123.00 | 12-11-13 | 122.50 | 13-11-12 | |
| 11-11-22 | 120.20 | 12-11-20 | 122.20 | 13-11-19 | |
| 11-11-29 | 119.20 | 12-11-27 | 122.60 | 13-11-26 | |
| 11-12-06 | 120.50 | 12-12-04 | 120.90 | 13-12-03 | |
| 11-12-13 | 118.30 | 12-12-11 | 117.30 | 13-12-10 | |
| 11-12-20 | 116.20 | 12-12-18 | 117.70 | 13-12-17 | |
| 11-12-27 | 119.00 | 12-12-25 | 119.00 | 13-12-24 | |
| 13-12-31 |
| ¢/L |
Week of: 2013-04-02 |
Change from: Previous Week |
Change from: Last Year |
|---|---|---|---|
| Gasoline | 128.7 | -0.8 | -6.4 |
| Diesel | 130.9 | +0.2 | +0.9 |
| Furnace Oil | 122.9 | +0.2 | +1.5 |
Source: NRCan
Recent Developments
-
Increased Capital Expenditures in 2013: According to the Daily Oil Bulletin, oil producers plan to spend $55 billion in 2013 in capital projects. Several of the 75 producers tracked by the Daily Oil Bulletin have reported increases to their capital spending plans for 2013. (Source: Daily Oil Bulletin, March 25, 2013)
-
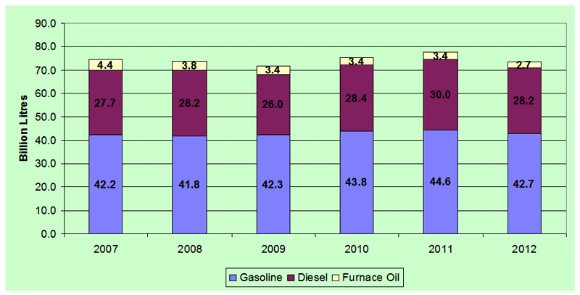
Sales of Domestic Refined Products Declined in 2012: Motor gasoline sales decreased by 1.8 billion litres (4%) to almost 43 billion litres in 2012 compared to 2011—a three year low. Diesel fuel sales also declined by 1.8 billion litres (6%) to 28 billion litres, while light fuel oil (furnace oil) decreased by 0.7 billion litres (20%) to 2.7 billion litres in the same time period. (Source: Statistics Canada and NRCan)
- U.S. Midwest Refineries Increase Capacity for Heavy Crude Oil: Some Midwest refiners are reconfiguring their facilities to process heavier crude oil, which will likely come from Canada. The refinery coking capacity in the Petroleum Administration for Defense District 2 (the Midwest) is set to increase significantly this year as refiners in the region focus on heavy crude oil. As this additional coking capacity comes online, Midwest refiners will be able to significantly increase runs of heavy crude, such as Western Canadian Select (WCS). WCS currently sells at a steep discount to other crude oil benchmarks used in the United States and processing WCS reduces refiner crude oil costs. (Source: US-DOE Energy Information Administration, This Week in Petroleum)
Retail Gasoline Overview
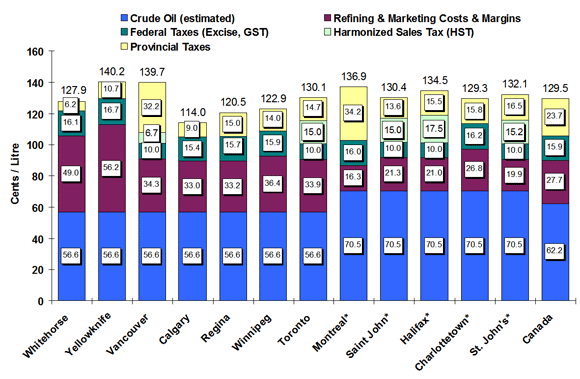
The average Canadian pump price in selected cities for the four-week average ending April 2, 2013, was $1.29 per litre—a decrease of 3 cents per litre from the last report on March 22, 2013. This represents a 3 cent- per-litre decrease from the same period in 2012.
The four-week average crude oil price component of gasoline registered at 62 cents per litre, up by 1 cent per litre from two weeks ago. The crude oil price component of gasoline is almost unchanged from the same time last year.Retail gasoline prices in most Western centres (Winnipeg to Vancouver), which ranged from $1.14 to $1.40 per litre, declined by 0.1 cent per litre when compared to the previous report. Prices in Eastern centres (Toronto to St. John's) declined on average by nearly 2 cents per litre and ranged from $1.29 to $1.37 per litre.
Overall, the refining and marketing costs and margins component decreased by 3 cents per litre to 28 cents per litre compared to two weeks ago, and is 3.5 cents per litre lower than at the same time last year.Figure 3: Regular Gasoline Pump Prices in Selected Cities
Four-Week Average (March 12 to April 2, 2013)
Source: NRCan
* Regulated Markets
text version - Figure 3
This graph shows the gasoline price components for 2 territories and 10 cities plus the national average.
| Whitehorse | Yellowknife | Vancouver | Calgary | Regina | Winnipeg | Toronto | Montreal* | Saint John* | Halifax* | Charlottetown* | St. John's* | Canada | |
|---|---|---|---|---|---|---|---|---|---|---|---|---|---|
| Pump Price | 127.9 | 140.2 | 139.7 | 114.0 | 120.5 | 122.9 | 130.1 | 136.9 | 130.4 | 134.5 | 129.3 | 132.1 | 129.5 |
| Crude (est.) | 56.6 | 56.6 | 56.6 | 56.6 | 56.6 | 56.6 | 56.6 | 70.5 | 70.5 | 70.5 | 70.5 | 70.5 | 62.2 |
| Federal Taxes | 16.1 | 16.7 | 10.0 | 15.4 | 15.7 | 15.9 | 10.0 | 16.0 | 10.0 | 10.0 | 16.2 | 10.0 | 15.9 |
| Provincial Tax | 6.2 | 10.7 | 32.2 | 9.0 | 15.0 | 14.0 | 14.7 | 34.2 | 13.6 | 15.5 | 15.8 | 16.5 | 23.7 |
| HST | 6.7 | 15.0 | 15.0 | 17.5 | 15.2 | ||||||||
| Refining & Marketing Costs & Margins | 49.0 | 56.2 | 34.3 | 33.0 | 33.2 | 36.4 | 33.9 | 16.3 | 21.3 | 21.0 | 26.8 | 19.9 | 27.7 |
Figure 3a: Sales of Selected Refined Petroleum Products in Canada
Source: Statistics Canada CANSIM table 134-0004, vector numbers v22455, v23190, v23428 and NRCan
text version - Figure 3a
This graph shows the sales of Refined Petroleum Products from 2007 to 2012.
| Year | Gasoline | Diesel | Furnace Oil |
|---|---|---|---|
| 2007 | 42.2 | 27.7 | 4.4 |
| 2008 | 41.8 | 28.2 | 3.8 |
| 2009 | 42.3 | 26.0 | 3.4 |
| 2010 | 43.8 | 28.4 | 3.4 |
| 2011 | 44.6 | 30.0 | 3.4 |
| 2012 | 42.7 | 28.2 | 2.7 |
Wholesale Gasoline Prices
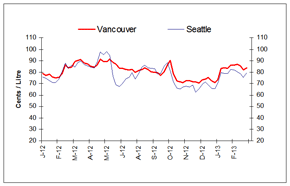
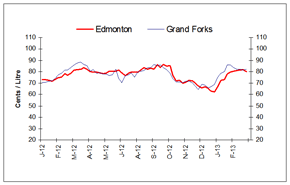
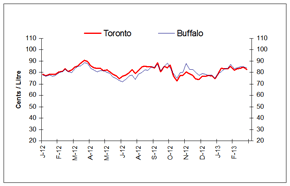
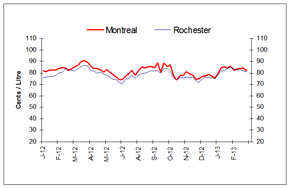
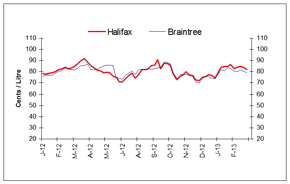
Wholesale gasoline prices, compared to the previous week, decreased in most centres for the week ending March 28, 2013.
Wholesale gasoline prices in the Eastern markets of both Canada and the United States decreased in the range of 1 to 3 cents per litre, compared to the previous week, and ended the period in the 79 to 84 cent-per- litre range.In the Western centres, price changes ranged from a decrease of 2 cents per litre to an increase of 4 cents per litre. Prices ended the period in the 80 to 84 cent-per-litre range.
In the last four weeks, wholesale price changes in selected Canadian and American centres ranged from a decrease of 3 cents per litre to an increase of 1 cent per litre.
Overall, wholesale gasoline prices in all markets are 2 to 10 cents per litre below last year's level.
Figure 4: Wholesale Gasoline Prices
Rack Terminal Prices for Selected Canadian and American Cities Ending March 28, 2013
(Can ¢/L)
|
|
|
|
|
|
|
text version - Figure 4
This graph shows the trend in wholesale gasoline prices for selected centres in Canada and the U.S.
| DATE | Halifax | Braintree | Montreal | Rochester | Toronto | Buffalo | Edmonton | Grand Forks | Vancouver | Seattle |
|---|---|---|---|---|---|---|---|---|---|---|
| Thu 05-Jan-12 | 78.30 | 75.98 | 81.60 | 75.96 | 78.50 | 78.12 | 72.80 | 70.73 | 78.90 | 76.05 |
| Thu 12-Jan-12 | 78.00 | 76.93 | 81.40 | 76.17 | 77.20 | 76.78 | 73.00 | 70.78 | 77.30 | 74.34 |
| Thu 19-Jan-12 | 79.00 | 77.11 | 82.60 | 76.67 | 78.40 | 77.87 | 72.70 | 71.87 | 77.90 | 72.89 |
| Thu 26-Jan-12 | 79.40 | 76.87 | 82.30 | 76.65 | 78.20 | 76.77 | 71.50 | 72.13 | 75.70 | 70.92 |
| Thu 02-Feb-12 | 80.10 | 78.57 | 82.50 | 77.46 | 78.50 | 77.55 | 73.20 | 74.13 | 75.00 | 71.02 |
| Thu 09-Feb-12 | 81.80 | 80.57 | 83.80 | 80.07 | 80.40 | 79.83 | 74.80 | 77.38 | 75.20 | 73.88 |
| hu 16-Feb-12 | 82.70 | 81.17 | 84.60 | 80.70 | 81.10 | 80.53 | 75.20 | 78.68 | 79.10 | 80.62 |
| Thu 23-Feb-12 | 84.20 | 83.12 | 84.50 | 83.26 | 83.30 | 82.83 | 78.30 | 81.53 | 86.30 | 87.84 |
| Thu 01-Mar-12 | 83.00 | 82.67 | 82.10 | 83.10 | 81.20 | 80.92 | 77.20 | 81.51 | 83.70 | 83.24 |
| Thu 08-Mar-12 | 83.20 | 81.93 | 83.40 | 82.01 | 82.20 | 79.67 | 79.00 | 84.37 | 84.20 | 86.03 |
| Thu 15-Mar-12 | 85.30 | 81.51 | 85.40 | 81.64 | 84.60 | 83.41 | 81.40 | 85.85 | 89.10 | 84.33 |
| Thu 22-Mar-12 | 87.30 | 83.23 | 86.30 | 83.69 | 86.10 | 85.62 | 82.00 | 87.65 | 90.50 | 88.72 |
| Thu 9-Mar-12 | 89.60 | 85.57 | 89.40 | 85.29 | 88.10 | 86.11 | 82.30 | 88.42 | 91.10 | 89.74 |
| Thu 05-Apr-12 | 91.80 | 85.57 | 91.00 | 86.50 | 90.90 | 88.65 | 83.50 | 86.17 | 88.00 | 86.61 |
| Thu 2-Apr-12 | 88.90 | 86.73 | 89.00 | 86.24 | 89.60 | 87.79 | 82.50 | 85.65 | 87.50 | 85.43 |
| Thu 19-Apr-12 | 85.80 | 82.15 | 85.40 | 81.69 | 86.00 | 83.66 | 80.10 | 80.61 | 85.20 | 84.31 |
| Thu 26-Apr-12 | 83.30 | 82.09 | 83.90 | 81.75 | 84.00 | 82.15 | 79.60 | 81.72 | 84.40 | 84.04 |
| Thu 03-May-12 | 81.50 | 82.57 | 84.00 | 79.72 | 83.80 | 80.81 | 79.90 | 78.77 | 86.00 | 88.50 |
| Thu 10-May-12 | 81.20 | 83.82 | 83.10 | 80.79 | 83.80 | 81.50 | 79.40 | 79.14 | 91.40 | 97.78 |
| Thu 17-May-12 | 79.10 | 85.05 | 80.60 | 78.79 | 81.50 | 81.63 | 78.50 | 77.97 | 89.20 | 95.59 |
| Thu 24-May-12 | 79.90 | 85.98 | 82.80 | 78.04 | 82.20 | 80.07 | 78.60 | 78.09 | 89.10 | 97.99 |
| Thu 31-May-12 | 79.30 | 86.07 | 80.90 | 76.24 | 80.80 | 79.07 | 80.80 | 76.64 | 91.60 | 94.29 |
| Thu 07-Jun-12 | 75.90 | 85.72 | 78.70 | 74.45 | 78.40 | 76.04 | 80.50 | 77.57 | 88.60 | 76.45 |
| Thu 14-Jun-12 | 75.00 | 75.71 | 76.30 | 74.07 | 77.10 | 74.98 | 80.80 | 82.24 | 87.00 | 69.43 |
| Thu 21-Jun-12 | 70.90 | 73.99 | 74.20 | 71.22 | 74.80 | 73.12 | 81.40 | 74.20 | 83.60 | 67.29 |
| Thu 28-Jun-12 | 71.10 | 73.37 | 74.30 | 70.57 | 76.80 | 71.79 | 79.20 | 70.40 | 83.30 | 70.25 |
| Thu 05-Jul-12 | 74.00 | 76.84 | 77.10 | 74.49 | 77.70 | 74.13 | 76.50 | 76.50 | 82.30 | 73.89 |
| Thu 12-Jul-12 | 77.00 | 79.06 | 79.90 | 75.64 | 79.70 | 77.17 | 78.90 | 77.33 | 82.00 | 75.98 |
| Thu 19-Jul-12 | 78.70 | 80.51 | 81.90 | 77.65 | 82.80 | 78.00 | 79.80 | 79.34 | 82.50 | 79.29 |
| Thu 26-Jul-12 | 74.10 | 78.00 | 78.20 | 75.33 | 79.30 | 73.91 | 79.50 | 75.41 | 79.70 | 74.08 |
| Thu 02-Aug-12 | 77.50 | 81.71 | 81.50 | 77.89 | 81.70 | 78.15 | 79.90 | 80.06 | 81.00 | 78.57 |
| Thu 09-Aug-12 | 81.80 | 82.28 | 85.00 | 80.00 | 85.20 | 80.22 | 81.90 | 80.55 | 82.50 | 84.38 |
| Thu 16-Aug-12 | 82.10 | 82.18 | 84.50 | 80.04 | 85.60 | 82.22 | 83.80 | 81.19 | 83.80 | 86.04 |
| Thu 23-Aug-12 | 82.50 | 82.70 | 85.10 | 80.56 | 84.90 | 82.09 | 82.40 | 83.57 | 82.50 | 83.89 |
| Thu 30-Aug-12 | 85.60 | 82.23 | 85.50 | 81.71 | 85.20 | 84.70 | 83.10 | 83.91 | 80.50 | 83.35 |
| Thu 06-Sep-12 | 86.00 | 82.67 | 84.60 | 81.65 | 84.30 | 84.61 | 82.40 | 86.24 | 79.70 | 83.15 |
| Thu 13-Sep-12 | 90.80 | 83.28 | 88.60 | 81.81 | 88.60 | 87.08 | 86.50 | 85.28 | 79.50 | 78.61 |
| Thu 20-Sep-12 | 82.80 | 84.03 | 80.80 | 79.82 | 80.50 | 81.33 | 83.60 | 85.93 | 77.30 | 79.04 |
| Thu 27-Sep-12 | 87.70 | 84.38 | 88.40 | 84.06 | 85.30 | 85.30 | 86.30 | 83.65 | 80.70 | 85.58 |
| Thu 04-Oct-12 | 87.30 | 84.45 | 85.40 |
83.55 | 84.20 | 88.22 | 85.00 |
81.73 | 85.90 | 88.43 |
| Thu 11-Oct-12 | 86.00 |
84.10 | 87.00 |
81.16 | 86.50 | 83.98 | 85.40 |
78.69 | 90.60 | 81.35 |
| Thu 18-Oct-12 | 77.80 | 84.33 | 77.70 | 76.05 | 77.20 | 79.28 | 76.60 | 73.80 | 78.50 | 71.33 |
| Thu 25-Oct-12 | 73.00 | 85.48 | 73.80 | 74.24 | 72.70 | 74.59 | 72.10 | 71.37 | 72.10 | 66.33 |
| Thu 01-Nov-12 | 76.30 | 85.75 | 78.10 | 76.16 | 77.40 | 79.83 | 72.60 | 71.19 | 71.60 | 65.42 |
| Thu 08-Nov-12 | 76.80 | 85.86 | 77.60 | 75.63 | 77.40 | 79.93 | 69.90 | 70.30 | 71.10 | 67.09 |
| Thu 15-Nov-12 | 80.10 | 78.06 | 81.20 | 76.45 | 80.60 | 87.66 | 70.90 | 71.58 | 72.80 | 67.68 |
| Thu 22-Nov-12 | 77.20 | 76.48 | 79.20 | 75.80 | 78.90 | 83.00 | 72.50 | 71.84 | 72.80 | 67.14 |
| Thu 29-Nov-12 | 76.70 | 76.01 | 78.30 | 76.51 | 77.50 | 82.63 | 72.10 | 70.37 | 71.30 | 68.68 |
| Thu 06-Dec-12 | 73.10 | 71.08 | 74.60 | 73.05 | 74.40 | 80.37 | 70.10 | 67.40 | 71.40 | 62.39 |
| Thu 13-Dec-12 | 72.10 | 70.22 | 74.90 | 71.94 | 73.90 | 77.52 | 67.70 | 64.43 | 70.50 | 65.70 |
| Thu 20-Dec-12 | 75.40 | 74.02 | 76.90 | 74.59 | 76.40 | 79.11 | 66.10 | 68.86 | 73.30 | 69.53 |
| Thu 27-Dec-12 | 75.80 | 76.29 | 77.10 | 76.52 | 76.80 | 78.58 | 66.70 | 67.97 | 74.00 | 71.30 |
| Thu 03-Jan-13 | 77.50 | 75.42 | 78.60 | 75.82 | 77.50 | 77.31 | 65.40 | 66.07 | 75.50 | 68.79 |
| Thu 10-Jan-13 | 76.70 | 74.48 | 77.40 | 75.49 | 76.90 | 77.88 | 63.40 | 66.67 | 72.40 | 65.77 |
| Thu 17-Jan-13 | 74.80 | 73.73 | 75.40 | 74.81 | 75.00 | 74.96 | 62.40 | 69.13 | 70.90 | 65.72 |
| Thu 13-Dec-12 | 72.10 | 70.22 | 74.90 | 71.94 | 73.90 | 77.52 | 67.70 | 64.43 | 70.50 | 65.70 |
| Thu 24-Jan-13 | 79.00 | 78.00 | 79.00 | 78.15 | 78.30 | 78.93 | 66.80 | 75.06 | 73.50 | 70.59 |
| Thu 31-Jan-13 | 84.10 | 81.70 | 84.70 | 81.81 | 83.50 | 80.51 | 72.50 | 78.85 | 83.40 | 79.19 |
| Thu 07-Feb-13 | 84.60 | 80.98 | 85.10 | 81.47 | 83.20 | 83.16 | 73.10 | 80.16 | 84.00 | 78.87 |
| Thu 14-Feb-13 | 84.50 | 83.61 | 84.20 | 84.35 | 83.20 | 83.55 | 78.10 | 86.03 | 83.30 | 79.18 |
| Thu 21-Feb-13 | 86.70 | 83.01 | 85.90 | 84.51 | 85.40 | 87.44 | 79.70 | 85.90 | 86.00 | 82.60 |
| Thu 28-Feb-13 | 82.80 | 80.41 | 81.90 | 83.34 | 81.90 | 83.14 | 80.50 | 83.70 | 86.20 | 81.99 |
| Thu 07-Mar-13 | 84.10 | 80.00 | 83.60 | 82.22 | 83.30 | 84.09 | 81.00 | 82.56 | 86.90 | 80.15 |
| Thu 14-Mar-13 | 84.60 | 81.52 | 84.00 | 83.10 | 83.90 | 85.12 | 81.70 | 82.24 | 85.40 | 78.61 |
| Thu 21-Mar-13 | 84.10 | 80.55 | 84.50 | 81.59 | 84.80 | 84.95 | 81.80 | 81.66 | 82.10 | 75.28 |
| Thu 28-Mar-13 | 82.00 | 79.08 | 81.50 | 80.79 | 82.60 | 84.24 | 80.20 | 82.51 | 83.80 | 79.62 |
Sources: NRCan, Bloomberg Oil Buyers Guide
Refinery Economics and Environmental Requirements
Not all investment decisions are driven by refinery economics. Refiners also make investment decisions because of voluntary actions or legislative and regulatory requirements. In recent years, governments and industry have directed considerable effort towards reducing the environmental impact of burning fossil fuels. Many of the initiatives have been aimed at providing 'cleaner' fuels for Canadians. Environmental regulations require industry to make additional investments to meet the more stringent standards.
Gasoline Refining and Marketing Margins
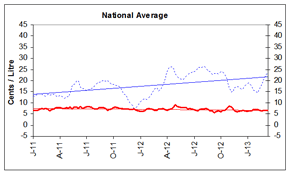
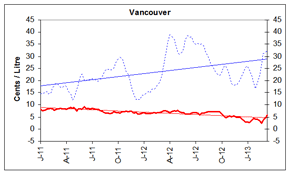
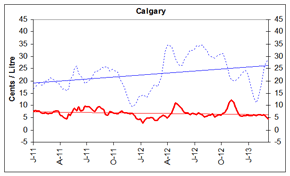
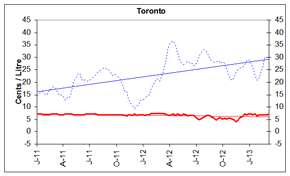
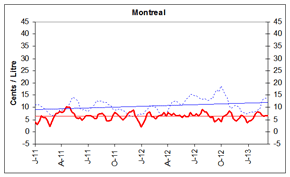
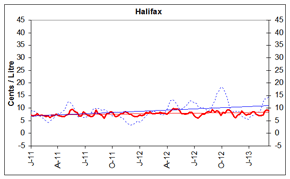
Four-week rolling averages are used for gasoline refining and marketing margins. After rising since February, refining margins have shown downward movement in the last three weeks. Reductions in refining margins are indicative of adequate supply, while larger margins are a sign of a tightening in supplies.
The March–April period can often present challenges for refiners. If the early spring is colder than expected, heating oil demand will remain strong at a time when refiners are trying to convert their operations away from distillate production toward more gasoline production. Refiners need to build gasoline inventories through the spring in anticipation of the higher summer demand. This is also a time of the year that many refiners perform maintenance on equipment, which often requires short-term closures of specific units or even the whole refinery for a few days or a few weeks. All of these conditions can limit the available supply of products and put upward pressure on prices, thereby increasing refining margins.Conversely, marketing margins remained fairly stable nationally, hovering around 7 cents per litre as indicated by the trend line. Overall, these graphs show that marketing margins can be volatile as outlets compete for market share. As gasoline is essentially the same from outlet to outlet, the only way for retailers to differentiate themselves is through price and other product offerings.
Figure 5: Gasoline Refining and Marketing Margins
(Four-Week Rolling Average Ending April 2, 2013)
_________ Refining Margin _______ Marketing Margin
|
|
|
|
|
|
|
|
text version - Figure 5
These graphs show the trend in refining and marketing costs and margins for selected centres in Canada and the national average.
| 4-week rolling average | Canada | Vancouver | Calgary | Toronto | Montreal | Halifax | ||||||
|---|---|---|---|---|---|---|---|---|---|---|---|---|
| Marketing Margin | Refining Margin | Marketing Margin | Refining Margin | Marketing Margin | Refining Margin | Marketing Margin | Refining Margin | Marketing Margin | Refining Margin | Marketing Margin | Refining Margin | |
| 2011-01-04 | 6.8 | 12.7 | 8.0 | 14.4 | 7.5 | 16.6 | 7.1 | 14.4 | 4.1 | 11.0 | 7.4 | 9.0 |
| 2011-01-11 | 6.8 | 13.2 | 7.6 | 14.8 | 8.1 | 17.5 | 7.0 | 15.4 | 2.9 | 11.1 | 6.9 | 8.8 |
| 2011-01-18 | 6.6 | 13.7 | 7.9 | 15.1 | 7.7 | 18.7 | 7.1 | 16.0 | 4.3 | 11.1 | 7.2 | 8.7 |
| 2011-01-25 | 6.9 | 14.1 | 8.2 | 15.6 | 7.8 | 19.2 | 7.0 | 16.1 | 6.7 | 10.3 | 7.7 | 7.9 |
| 2011-02-01 | 7.6 | 14.0 | 8.3 | 14.5 | 6.9 | 18.2 | 7.0 | 15.0 | 6.0 | 9.7 | 7.1 | 7.2 |
| 2011-02-08 | 7.3 | 13.1 | 8.6 | 15.1 | 6.9 | 18.7 | 7.0 | 15.3 | 5.9 | 9.0 | 7.3 | 6.4 |
| 2011-02-15 | 7.4 | 13.1 | 8.3 | 17.0 | 7.1 | 19.9 | 7.0 | 16.7 | 4.5 | 8.2 | 7.2 | 5.9 |
| 2011-02-22 | 7.2 | 13.6 | 7.9 | 17.7 | 6.7 | 20.1 | 7.0 | 17.2 | 2.1 | 7.2 | 6.6 | 4.9 |
| 2011-03-01 | 6.5 | 13.5 | 8.1 | 18.9 | 6.8 | 21.3 | 7.0 | 18.3 | 4.1 | 6.3 | 6.7 | 4.3 |
| 2011-03-08 | 6.9 | 13.8 | 8.3 | 18.3 | 6.8 | 21.2 | 7.0 | 17.8 | 5.9 | 6.8 | 6.4 | 4.9 |
| 2011-03-15 | 7.2 | 13.8 | 8.6 | 17.3 | 7.6 | 20.4 | 7.0 | 16.1 | 7.7 | 6.9 | 6.9 | 5.3 |
| 2011-03-22 | 7.7 | 13.1 | 8.4 | 17.0 | 7.8 | 19.3 | 7.0 | 15.0 | 7.6 | 7.7 | 7.0 | 6.4 |
| 2011-03-29 | 7.7 | 12.8 | 8.3 | 17.9 | 7.7 | 19.2 | 7.0 | 14.8 | 8.4 | 8.7 | 7.5 | 7.5 |
| 2011-04-05 | 7.8 | 13.2 | 8.1 | 17.4 | 6.1 | 18.2 | 7.0 | 14.2 | 7.8 | 8.8 | 7.0 | 7.9 |
| 2011-04-12 | 7.4 | 12.8 | 8.5 | 15.5 | 5.7 | 16.7 | 7.1 | 12.8 | 8.1 | 8.9 | 6.9 | 8.0 |
| 2011-04-19 | 7.4 | 11.9 | 8.9 | 14.4 | 4.9 | 17.0 | 7.1 | 13.9 | 10.4 | 9.6 | 6.6 | 8.8 |
| 2011-04-26 | 7.7 | 12.6 | 8.6 | 12.2 | 4.6 | 15.9 | 7.1 | 13.9 | 10.2 | 10.1 | 6.6 | 9.2 |
| 2011-05-03 | 7.6 | 12.5 | 8.9 | 12.9 | 6.6 | 17.0 | 7.0 | 16.0 | 10.1 | 11.6 | 7.2 | 10.9 |
| 2011-05-10 | 8.0 | 14.2 | 7.5 | 16.6 | 5.8 | 20.5 | 7.0 | 20.5 | 7.8 | 14.2 | 7.6 | 12.5 |
| 2011-05-17 | 7.3 | 17.8 | 8.3 | 18.3 | 8.1 | 22.1 | 7.0 | 21.4 | 7.7 | 14.1 | 9.3 | 12.2 |
| 2011-05-24 | 8.0 | 18.5 | 8.3 | 21.5 | 9.1 | 25.0 | 6.9 | 23.3 | 5.8 | 13.4 | 9.5 | 10.9 |
| 2011-05-31 | 7.9 | 19.7 | 8.1 | 22.6 | 7.8 | 26.1 | 7.0 | 23.5 | 5.3 | 12.3 | 8.5 | 9.2 |
| 2011-06-07 | 7.6 | 19.7 | 9.3 | 20.3 | 9.6 | 23.1 | 7.0 | 21.0 | 5.8 | 9.6 | 8.2 | 6.9 |
| 2011-06-14 | 8.3 | 17.0 | 8.4 | 20.3 | 7.8 | 22.3 | 7.0 | 20.9 | 4.6 | 9.0 | 6.8 | 6.3 |
| 2011-06-21 | 7.5 | 16.5 | 8.6 | 20.3 | 8.2 | 20.9 | 7.1 | 20.7 | 5.9 | 9.4 | 7.0 | 7.0 |
| 2011-06-28 | 7.8 | 16.3 | 8.3 | 20.5 | 9.9 | 19.0 | 7.0 | 20.3 | 6.6 | 8.5 | 8.4 | 6.3 |
| 2011-07-05 | 8.4 | 15.5 | 8.5 | 20.8 | 9.4 | 19.6 | 7.1 | 21.0 | 6.7 | 8.7 | 7.9 | 6.1 |
| 2011-07-12 | 8.2 | 15.9 | 8.3 | 20.6 | 9.5 | 20.2 | 7.1 | 21.6 | 6.8 | 9.7 | 7.2 | 6.7 |
| 2011-07-19 | 8.1 | 16.4 | 8.2 | 19.8 | 8.8 | 21.0 | 7.0 | 22.2 | 6.1 | 10.3 | 6.9 | 7.3 |
| 2011-07-26 | 7.6 | 16.9 | 8.1 | 19.7 | 7.7 | 22.5 | 7.1 | 23.0 | 5.3 | 11.4 | 6.7 | 8.5 |
| 2011-08-02 | 7.2 | 17.8 | 7.7 | 20.5 | 7.7 | 23.9 | 6.9 | 24.1 | 5.4 | 12.7 | 7.2 | 10.1 |
| 2011-08-09 | 7.1 | 18.9 | 7.5 | 22.0 | 9.3 | 24.1 | 6.9 | 24.5 | 7.1 | 12.4 | 9.2 | 10.0 |
| 2011-08-16 | 7.8 | 19.1 | 6.8 | 23.4 | 9.4 | 24.4 | 6.8 | 25.3 | 7.3 | 12.5 | 7.9 | 10.0 |
| 2011-08-23 | 7.8 | 19.6 | 6.5 | 24.5 | 8.7 | 25.5 | 6.8 | 25.8 | 7.6 | 12.3 | 7.6 | 9.7 |
| 2011-08-30 | 7.7 | 20.1 | 6.6 | 24.8 | 8.3 | 25.3 | 6.9 | 25.2 | 6.6 | 11.9 | 7.2 | 9.1 |
| 2011-09-06 | 7.5 | 19.7 | 6.5 | 24.6 | 6.4 | 25.8 | 6.9 | 25.2 | 4.4 | 12.0 | 5.8 | 9.4 |
| 2011-09-13 | 6.7 | 19.9 | 6.8 | 24.4 | 6.2 | 25.5 | 7.0 | 24.0 | 4.4 | 11.2 | 7.8 | 8.9 |
| 2011-09-20 | 6.8 | 19.2 | 7.2 | 25.1 | 7.5 | 24.1 | 6.9 | 22.7 | 4.7 | 10.5 | 8.1 | 8.3 |
| 2011-09-27 | 7.3 | 18.2 | 6.8 | 27.8 | 7.2 | 24.7 | 6.9 | 23.4 | 6.5 | 9.4 | 8.5 | 7.4 |
| 2011-10-04 | 7.6 | 18.4 | 7.0 | 29.0 | 6.9 | 24.2 | 6.9 | 22.7 | 7.8 | 9.0 | 8.2 | 6.7 |
| 2011-10-11 | 8.0 | 17.9 | 6.7 | 29.5 | 6.8 | 24.0 | 6.9 | 21.9 | 7.4 | 8.9 | 6.6 | 6.5 |
| 2011-10-18 | 7.7 | 17.6 | 7.0 | 29.0 | 6.7 | 23.5 | 6.9 | 21.5 | 6.8 | 9.3 | 6.5 | 6.9 |
| 2011-10-25 | 7.5 | 17.4 | 7.2 | 26.5 | 7.4 | 21.1 | 6.8 | 18.6 | 5.6 | 9.1 | 7.1 | 7.0 |
| 2011-11-01 | 7.4 | 15.7 | 7.3 | 23.8 | 7.7 | 19.0 | 6.8 | 16.6 | 4.9 | 8.6 | 7.7 | 6.4 |
| 2011-11-08 | 7.4 | 14.2 | 7.2 | 22.4 | 7.0 | 17.8 | 6.4 | 15.8 | 5.6 | 8.3 | 7.9 | 6.0 |
| 2011-11-15 | 7.3 | 13.4 | 7.5 | 19.5 | 7.2 | 15.0 | 7.0 | 13.1 | 7.2 | 7.1 | 8.4 | 4.8 |
| 2011-11-22 | 7.4 | 11.2 | 7.4 | 16.7 | 6.9 | 12.8 | 6.9 | 11.8 | 8.2 | 6.5 | 8.3 | 3.8 |
| 2011-11-29 | 7.0 | 10.1 | 6.6 | 14.6 | 6.6 | 10.7 | 6.8 | 10.6 | 8.2 | 6.3 | 7.6 | 3.4 |
| 2011-12-06 | 7.1 | 8.9 | 6.9 | 12.3 | 6.7 | 9.2 | 7.2 | 9.3 | 8.8 | 6.1 | 7.5 | 3.3 |
| 2011-12-13 | 7.3 | 7.6 | 6.2 | 12.2 | 6.0 | 10.1 | 6.6 | 10.3 | 6.7 | 6.7 | 6.8 | 3.7 |
| 2011-12-20 | 6.8 | 8.0 | 6.2 | 12.4 | 4.6 | 11.5 | 6.8 | 11.0 | 5.3 | 6.7 | 6.7 | 4.0 |
| 2011-12-27 | 6.4 | 9.1 | 6.8 | 14.0 | 4.3 | 13.5 | 7.0 | 12.6 | 3.7 | 7.3 | 6.5 | 4.8 |
| 2012-01-03 | 6.1 | 10.4 | 6.9 | 14.1 | 4.6 | 13.9 | 6.9 | 13.0 | 1.9 | 7.1 | 7.3 | 4.4 |
| 2012-01-10 | 6.1 | 11.3 | 6.4 | 14.9 | 3.0 | 14.2 | 6.7 | 13.8 | 3.7 | 7.5 | 7.1 | 5.0 |
| 2012-01-17 | 6.5 | 11.8 | 6.4 | 15.4 | 4.0 | 14.1 | 6.9 | 14.5 | 5.1 | 8.7 | 7.2 | 6.0 |
| 2012-01-24 | 7.3 | 11.5 | 6.3 | 15.1 | 5.0 | 13.6 | 7.0 | 14.9 | 7.5 | 9.1 | 8.3 | 6.5 |
| 2012-01-31 | 7.6 | 12.3 | 6.7 | 16.6 | 5.0 | 15.0 | 7.4 | 17.3 | 8.0 | 10.6 | 8.2 | 8.1 |
| 2012-02-07 | 7.2 | 13.6 | 6.8 | 16.6 | 5.2 | 16.5 | 7.4 | 18.9 | 6.2 | 10.6 | 8.4 | 8.2 |
| 2012-02-14 | 7.0 | 15.2 | 6.8 | 17.4 | 4.8 | 17.9 | 7.3 | 20.8 | 6.1 | 10.3 | 7.8 | 8.4 |
| 2012-02-21 | 6.6 | 16.2 | 6.9 | 18.5 | 3.9 | 18.6 | 7.5 | 21.4 | 5.1 | 10.1 | 7.9 | 8.7 |
| 2012-02-28 | 6.8 | 16.9 | 6.8 | 19.3 | 3.9 | 17.7 | 7.3 | 20.3 | 6.5 | 8.8 | 8.0 | 8.2 |
| 2012-03-06 | 7.1 | 15.4 | 7.2 | 22.2 | 4.9 | 18.9 | 7.3 | 21.6 | 6.7 | 7.7 | 8.1 | 7.9 |
| 2012-03-13 | 7.3 | 16.2 | 7.5 | 26.6 | 5.6 | 22.4 | 7.4 | 23.8 | 6.9 | 6.9 | 8.4 | 7.6 |
| 2012-03-20 | 7.5 | 18.1 | 7.5 | 31.2 | 6.0 | 26.7 | 7.2 | 27.6 | 7.8 | 6.4 | 8.0 | 7.3 |
| 2012-03-27 | 6.9 | 20.1 | 7.1 | 36.2 | 5.6 | 31.9 | 6.9 | 32.5 | 6.3 | 6.9 | 8.0 | 7.7 |
| 2012-04-03 | 6.8 | 24.3 | 6.8 | 39.0 | 4.8 | 34.7 | 6.7 | 35.3 | 7.8 | 8.7 | 7.6 | 9.6 |
| 2012-04-10 | 7.1 | 25.8 | 7.1 | 38.3 | 5.8 | 34.4 | 6.8 | 36.2 | 7.4 | 10.4 | 8.4 | 11.4 |
| 2012-04-17 | 7.5 | 26.2 | 7.5 | 37.4 | 7.2 | 33.9 | 7.0 | 36.6 | 6.9 | 12.1 | 8.8 | 13.1 |
| 2012-04-24 | 8.0 | 25.7 | 7.4 | 34.4 | 9.0 | 31.8 | 6.7 | 34.9 | 7.6 | 12.4 | 10.0 | 13.3 |
| 2012-05-01 | 9.3 | 23.3 | 7.8 | 31.6 | 11.0 | 28.9 | 7.0 | 32.0 | 6.5 | 12.6 | 9.8 | 12.6 |
| 2012-05-08 | 8.7 | 21.7 | 7.2 | 31.0 | 10.5 | 27.3 | 6.9 | 29.5 | 6.6 | 12.0 | 9.8 | 11.3 |
| 2012-05-15 | 8.4 | 20.7 | 6.8 | 32.0 | 9.7 | 26.3 | 6.6 | 27.5 | 6.8 | 11.2 | 9.2 | 10.1 |
| 2012-05-22 | 8.0 | 20.6 | 7.0 | 33.2 | 8.6 | 26.3 | 7.0 | 27.0 | 5.9 | 11.4 | 7.8 | 9.7 |
| 2012-05-29 | 8.1 | 20.5 | 6.2 | 37.0 | 7.4 | 28.4 | 6.8 | 28.0 | 7.0 | 12.0 | 7.8 | 10.1 |
| 2012-06-05 | 8.0 | 21.8 | 6.1 | 38.6 | 7.1 | 30.0 | 6.5 | 28.5 | 6.3 | 13.2 | 7.6 | 10.9 |
| 2012-06-12 | 7.5 | 22.8 | 6.2 | 37.9 | 7.0 | 30.9 | 6.7 | 27.8 | 6.2 | 14.0 | 7.9 | 11.5 |
| 2012-06-19 | 7.8 | 23.3 | 6.7 | 38.0 | 6.3 | 32.5 | 6.7 | 27.5 | 8.0 | 15.3 | 8.3 | 12.9 |
| 2012-06-26 | 7.6 | 23.7 | 6.8 | 35.7 | 6.8 | 32.5 | 6.6 | 26.5 | 6.9 | 15.2 | 8.4 | 12.9 |
| 2012-07-03 | 7.3 | 23.7 | 7.0 | 34.9 | 6.5 | 33.0 | 6.1 | 27.0 | 6.6 | 14.8 | 7.3 | 12.1 |
| 2012-07-10 | 7.0 | 24.5 | 6.6 | 35.3 | 6.3 | 34.4 | 5.3 | 29.0 | 7.4 | 14.7 | 6.4 | 11.8 |
| 2012-07-17 | 6.6 | 25.8 | 5.9 | 34.9 | 7.0 | 34.0 | 4.9 | 30.9 | 6.3 | 14.0 | 6.2 | 10.7 |
| 2012-07-24 | 7.1 | 25.9 | 6.7 | 35.0 | 6.6 | 34.6 | 5.4 | 32.5 | 7.7 | 13.6 | 6.9 | 10.3 |
| 2012-07-31 | 7.6 | 26.1 | 6.6 | 34.3 | 6.2 | 34.6 | 5.8 | 33.3 | 9.0 | 13.4 | 7.5 | 10.4 |
| 2012-08-07 | 7.5 | 26.6 | 6.8 | 32.0 | 5.3 | 33.2 | 6.3 | 32.7 | 8.1 | 13.5 | 7.6 | 9.9 |
| 2012-08-14 | 7.6 | 25.4 | 7.1 | 30.2 | 5.5 | 32.4 | 6.7 | 31.2 | 8.2 | 13.0 | 8.4 | 9.3 |
| 2012-08-21 | 7.2 | 24.5 | 7.1 | 27.9 | 6.1 | 30.7 | 6.3 | 29.3 | 6.9 | 12.8 | 8.4 | 8.8 |
| 2012-08-28 | 6.5 | 23.9 | 7.1 | 26.4 | 6.0 | 30.0 | 5.8 | 28.8 | 5.8 | 13.6 | 8.2 | 9.9 |
| 2012-09-04 | 6.5 | 22.7 | 7.1 | 25.2 | 6.5 | 29.7 | 5.5 | 27.9 | 6.1 | 13.4 | 9.6 | 10.9 |
| 2012-09-11 | 5.6 | 23.3 | 7.0 | 23.6 | 5.3 | 29.3 | 4.8 | 28.3 | 4.2 | 15.9 | 8.4 | 13.5 |
| 2012-09-18 | 6.1 | 23.3 | 7.2 | 22.8 | 5.9 | 30.1 | 5.4 | 28.8 | 4.8 | 17.3 | 9.0 | 15.8 |
| 2012-09-25 | 6.5 | 22.9 | 7.0 | 22.3 | 6.2 | 30.4 | 5.7 | 27.6 | 5.4 | 16.4 | 8.8 | 16.4 |
| 2012-10-02 | 5.9 | 24.2 | 6.3 | 23.3 | 6.0 | 31.2 | 5.3 | 28.3 | 4.3 | 18.7 | 7.0 | 18.5 |
| 2012-10-09 | 6.6 | 23.8 | 5.7 | 25.6 | 6.9 | 31.1 | 5.4 | 27.5 | 6.1 | 17.4 | 8.4 | 17.9 |
| 2012-10-16 | 6.7 | 22.9 | 4.7 | 26.6 | 7.3 | 29.3 | 5.2 | 26.3 | 6.8 | 15.7 | 8.0 | 16.6 |
| 2012-10-23 | 7.5 | 20.4 | 5.1 | 24.4 | 9.1 | 25.9 | 5.5 | 23.7 | 7.2 | 14.0 | 9.3 | 14.3 |
| 2012-10-30 | 8.5 | 17.2 | 5.5 | 21.6 | 11.4 | 22.0 | 5.5 | 20.9 | 8.6 | 10.3 | 9.3 | 10.3 |
| 2012-11-06 | 8.3 | 14.8 | 5.1 | 18.7 | 12.4 | 20.3 | 5.1 | 20.8 | 7.9 | 9.6 | 8.5 | 8.6 |
| 2012-11-13 | 7.3 | 15.1 | 5.4 | 17.2 | 11.5 | 19.3 | 4.6 | 21.7 | 5.2 | 10.4 | 6.7 | 8.7 |
| 2012-11-20 | 6.3 | 16.8 | 5.1 | 18.2 | 9.4 | 20.0 | 4.1 | 24.4 | 4.7 | 10.8 | 6.1 | 8.9 |
| 2012-11-27 | 6.0 | 17.2 | 5.0 | 18.7 | 7.3 | 21.2 | 4.9 | 25.5 | 4.4 | 10.8 | 7.4 | 8.9 |
| 2012-12-04 | 6.2 | 17.2 | 4.8 | 20.1 | 5.8 | 21.8 | 5.8 | 25.7 | 5.5 | 9.9 | 7.5 | 8.6 |
| 2012-12-11 | 6.5 | 16.3 | 4.3 | 19.3 | 5.5 | 21.0 | 6.1 | 24.0 | 6.9 | 7.9 | 9.1 | 6.3 |
| 2012-12-18 | 6.7 | 16.6 | 3.6 | 23.2 | 5.8 | 24.0 | 7.1 | 27.1 | 6.5 | 7.8 | 8.0 | 6.0 |
| 2012-12-25 | 6.4 | 17.7 | 3.0 | 25.6 | 5.8 | 24.4 | 6.8 | 28.8 | 5.4 | 7.5 | 7.4 | 5.8 |
| 2013-01-01 | 6.2 | 18.6 | 2.8 | 25.9 | 6.1 | 23.1 | 7.1 | 28.9 | 3.6 | 7.3 | 7.7 | 5.6 |
| 2013-01-08 | 6.4 | 19.0 | 2.7 | 24.5 | 6.0 | 19.8 | 7.1 | 27.6 | 4.4 | 8.0 | 7.5 | 6.6 |
| 2013-01-15 | 6.5 | 17.5 | 3.5 | 22.2 | 5.9 | 16.3 | 6.8 | 25.5 | 4.6 | 8.2 | 8.5 | 7.2 |
| 2013-01-22 | 6.9 | 15.6 | 4.4 | 20.2 | 6.3 | 14.3 | 7.0 | 23.9 | 5.5 | 8.3 | 8.5 | 7.6 |
| 2013-01-29 | 6.9 | 15.0 | 4.2 | 16.8 | 5.8 | 11.0 | 6.5 | 20.7 | 7.7 | 8.4 | 7.6 | 7.9 |
| 2013-02-05 | 7.0 | 14.6 | 4.2 | 18.2 | 6.4 | 12.3 | 6.8 | 21.1 | 8.1 | 9.5 | 7.1 | 9.2 |
| 2013-02-12 | 6.8 | 16.2 | 3.4 | 22.2 | 6.4 | 16.1 | 6.9 | 23.6 | 7.8 | 9.4 | 7.1 | 9.1 |
| 2013-02-19 | 6.4 | 18.5 | 2.4 | 25.6 | 6.2 | 19.9 | 6.8 | 25.7 | 7.0 | 11.0 | 7.4 | 10.8 |
| 2013-02-26 | 6.6 | 20.8 | 3.4 | 31.1 | 6.3 | 26.0 | 7.0 | 30.0 | 6.3 | 13.7 | 8.6 | 13.6 |
| 2013-03-05 | 6.7 | 22.7 | 4.7 | 32.0 | 5.2 | 27.8 | 7.0 | 30.1 | 6.7 | 13.9 | 9.3 | 14.0 |
| 2013-03-12 | 6.8 | 23.3 | 5.8 | 32.1 | 4.7 | 28.9 | 7.1 | 29.7 | 6.8 | 14.3 | 9.0 | 14.6 |
| 2013-03-19 | 7.2 | 23.1 | 7.0 | 31.5 | 5.1 | 29.1 | 7.4 | 29.4 | 6.8 | 12.3 | 9.1 | 12.8 |
| 2013-03-26 | 7.5 | 21.7 | 7.3 | 27.8 | 6.0 | 26.5 | 7.8 | 26.4 | 6.7 | 12.3 | 9.0 | 12.9 |
| 2013-04-02 | 7.1 | 20.9 | 6.9 | 26.5 | 6.4 | 25.8 | 7.5 | 25.6 | 5.2 | 12.6 | 8.4 | 12.9 |
Source: NRCan
Crude Oil Overview
Brent and North American Crude Price Gap Tapered to Lowest Level in 7 Months
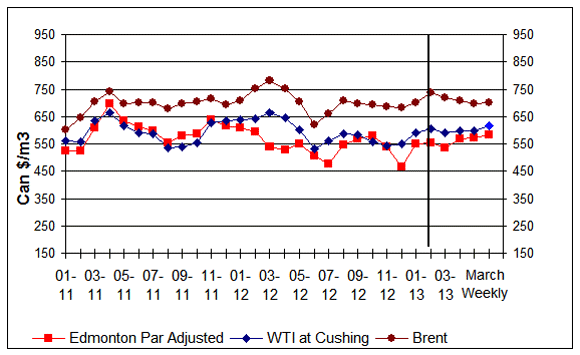
For the week ending March 29, 2013, crude oil prices averaged between $584 and $699/m3 ($US91 to $US109 per barrel). All three crude oil benchmarks increased in the range of $2 and $17/m3 ($US1 to $US3 per barrel). For the week ending March 29, 2013, the crude oil price differential between Brent and WTI decreased to $83/m3 ($US13 per barrel).
Edmonton Par and WTI saw an increase of $13 and $17/m3 ($US3 per barrel), respectively, compared to the previous week. Compared to the same period in 2012, Edmonton Par prices have increased by $77/m3 ($US10 per barrel) while the other benchmarks are lower.
Brent oil prices continue to weaken mainly due to poor world economic growth outlook. The price differential between Brent and WTI, the main North American crude oil benchmark, narrowed as the WTI price firmed up.
While U.S. domestic oil production continues to grow, so does the large crude oil inventory, now above the five-year historical average in the last 12 months. Improved pipeline access for crude oil production might help work down oil inventories. Meanwhile, analysts are concerned about the impact of a slow U.S. economic recovery and ongoing fiscal hurdles on oil demand.
Figure 6: Crude Oil Price Comparisons
text version - Figure 6
This graph shows crude oil prices for Edmonton Par, WTI and Brent. The average weekly prices for the period ending March 25, 2013, were $584/cubic metres, $616/cubic metres and $699/cubic metres for Edmonton Par, WTI and Brent, respectively.
| Dates | Edmonton Par Prices | WTI Prices | Brent Prices |
|---|---|---|---|
| 01/11 | 525.08 | 559.18 | 601.95 |
| 02/11 | 525.75 | 556.16 | 645.23 |
| 03/11 | 609.96 | 632.59 | 703.16 |
| 04/11 | 696.77 | 662.59 | 741.59 |
| 05/11 | 634.91 | 617.17 | 697.06 |
| 06/11 | 614.21 | 591.76 | 699.64 |
| 07/11 | 599.18 | 585.28 | 701.96 |
| 08/11 | 554.74 | 533.58 | 679.51 |
| 09/11 | 578.01 | 538.55 | 696.18 |
| 10/11 | 585.88 | 554.72 | 702.66 |
| 11/11 | 636.41 | 627.49 | 713.92 |
| 12/11 | 615.54 | 633.97 | 693.85 |
| 01/12 | 608.11 | 639.88 | 709.45 |
| 02/12 | 594.50 | 640.89 | 750.59 |
| 03/12 | 538.60 | 663.34 | 780.71 |
| 04/12 | 528.21 | 644.60 | 751.91 |
| 05/12 | 548.81 | 601.64 | 704.10 |
| 06/12 | 507.78 | 532.76 | 618.43 |
| 07/12 | 477.07 | 560.69 | 659.07 |
| 08/12 | 544.82 | 587.49 | 707.75 |
| 09/12 | 570.15 | 582.08 | 697.56 |
| 10/12 | 578.61 | 555.66 | 694.60 |
| 11/12 | 539.87 | 543.52 | 686.30 |
| 12/12 | 467.14 | 549.56 | 680.33 |
| 01/13 | 549.97 | 592.14 | 699.83 |
| 02/13 | 553.76 | 605.29 | 736.06 |
| March 4, 2013 | 535.51 | 589.18 | 718.48 |
| March 11, 2013 | 567.91 | 597.81 | 706.38 |
| March 18, 2013 | 571.17 | 598.86 | 696.96 |
| March 25, 2013 | 583.71 | 616.10 | 699.08 |
Sources: NRCan
| Crude Oil Types |
Week Ending:
2013-03-29 |
Change From: | ||||
|---|---|---|---|---|---|---|
| Previous Week | Last Year | |||||
| $Can/m 3 | $US/bbl | $Can/m3 | $US/bbl | $Can/m 3 | $US/bbl | |
| Edmonton Par | 583.71 | 91.22 | +12.53 | +2.59 | +76.53 | +10.30 |
| WTI | 616.10 | 96.24 | +17.24 | +3.31 | -42.71 | -8.87 |
| Brent | 699.08 | 109.21 | +2.12 | +1.05 | -84.05 | -15.74 |
Source: NRCan
Two New Refineries In North Dakota
Rising oil production and demand in North Dakota spur two new refinery builds. The 20,000 barrel-per-day (bbl/d) Dakota Prairie facility is scheduled to be built in 20 months. The impetus for the state's second and third refineries is the rapid increase in demand for diesel fuel and kerosene for trucking and industrial use within the state. Much of the increase in demand has been fueled by the boom in crude oil production from the new wells in the Bakken Formation in North Dakota's northwest corner. The demand for these middle distillates rose 80% in North Dakota from 2009 to 2012, providing the incentive to invest in local refineries.
The Trenton Diesel Refinery is also planned and expected to cost $200 million to build and start up. The primary product from the refinery will be light gas oil, a type of distillate. The two new refineries are smaller, both rated at 20,000 bbl/d capacity, and both will be fairly simple units that focus on creating the diesel and kerosene that are needed locally. North Dakota currently has one refinery, the Tesoro Mandan refinery located near Bismarck with a capacity of 60,000 bbl/d.Source: U.S. Energy Administration Information
Download the report
Fuel Focus - Printable Version [PDF, 197 KB]
To read Adobe Acrobat® files, you will need to download and install the free Acrobat Reader® software available from Adobe Systems Incorporated.
Page details
- Date modified: