
Fuel Focus, May 19, 2015
Table of Contents
- National Overview
- Recent Developments
- Retail Gasoline Overview
- Wholesale Gasoline Prices
- Gasoline Refining and Marketing Margins
- Crude Oil Overview
- Download the report
National Overview
Canadian Retail Gasoline Prices Increased by 2.7 Cents over past two weeks
For the two-week period ending May 12, 2015, the Canadian average retail gasoline price reached $1.14 per litre. This represents an increase of 5.9 cents from the two-week period ending April 28, 2015. Prices are 23 cents per litre lower than last year at this time.
Average retail diesel prices increased by 1.3 cents per litre over the same time period reaching $1.12 per litre, this is 26 cents less than for the same period last year. Over the same period, furnace oil prices increased by 0.6 cents per litre to reach $1.09, a decrease of 19 cents per litre from a year ago.
Figure 1: Crude Oil and Regular Gasoline Price Comparison
(National Average)
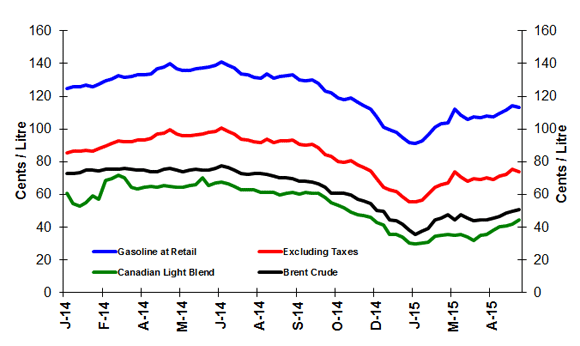
Text version
Figure 1
The graph shows prices in cents per litre for gasoline at retail, gasoline excluding taxes, and Canadian Light Sweet and Brent crude oil prices. Gasoline prices ended the period of May 12,2015 at 114.5 cents per litre, excluding taxes at 74.0 cents per litre, Canadian Light Sweet at 44.3 cents per litre and Brent at 50.5 cents per litre.
| Dates | Gasoline at retail | Excluding Taxes | Canadian Light Sweet | Brent crude |
|---|---|---|---|---|
| 07/01/2014 | 125.0 | 85.6 | 60.6 | 73.0 |
| 14/01/2014 | 125.6 | 86.2 | 54.6 | 72.6 |
| 21/01/2014 | 125.7 | 86.3 | 52.8 | 73.2 |
| 28/01/2014 | 126.6 | 87.0 | 55.1 | 74.9 |
| 04/02/2014 | 125.9 | 86.7 | 59.0 | 75.1 |
| 11/02/2014 | 127.6 | 88.2 | 57.0 | 74.4 |
| 18/02/2014 | 129.3 | 89.8 | 68.5 | 75.3 |
| 25/02/2014 | 130.7 | 91.0 | 69.7 | 75.4 |
| 04/03/2014 | 132.5 | 92.7 | 71.5 | 75.4 |
| 11/03/2014 | 131.8 | 92.1 | 70.3 | 75.9 |
| 18/03/2014 | 132.0 | 92.3 | 64.3 | 75.4 |
| 25/03/2014 | 132.9 | 93.2 | 63.4 | 74.7 |
| 01/04/2014 | 132.9 | 93.2 | 64.4 | 75.2 |
| 08/04/2014 | 133.9 | 94.1 | 65.1 | 73.7 |
| 15/04/2014 | 136.8 | 96.7 | 64.2 | 73.8 |
| 22/04/2014 | 137.7 | 97.4 | 65.5 | 75.7 |
| 29/04/2014 | 139.8 | 99.4 | 65.0 | 76.1 |
| 06/05/2014 | 136.9 | 96.8 | 64.2 | 74.8 |
| 13/05/2014 | 135.7 | 95.8 | 64.2 | 73.9 |
| 20/05/2014 | 136.0 | 95.9 | 65.2 | 75.0 |
| 27/05/2014 | 136.8 | 96.6 | 66.2 | 75.5 |
| 03/06/2014 | 137.4 | 97.2 | 70.3 | 75.0 |
| 10/06/2014 | 138.1 | 97.9 | 65.5 | 74.7 |
| 17/06/2014 | 138.8 | 98.5 | 67.1 | 76.0 |
| 24/06/2014 | 141.2 | 100.7 | 67.3 | 77.8 |
| 01/07/2014 | 138.7 | 98.4 | 66.5 | 76.7 |
| 08/07/2014 | 137.2 | 97.0 | 65.2 | 74.9 |
| 15/07/2014 | 133.8 | 93.9 | 62.9 | 72.9 |
| 22/07/2014 | 133.0 | 93.2 | 62.7 | 72.4 |
| 29/07/2014 | 131.8 | 92.1 | 63.0 | 72.9 |
| 05/08/2014 | 131.1 | 91.5 | 63.7 | 72.9 |
| 2014-08-12 | 133.6 | 93.8 | 61.0 | 72.3 |
| 2014-08-19 | 131.3 | 91.7 | 61.1 | 71.1 |
| 26/08/2014 | 132.1 | 92.5 | 59.8 | 70.2 |
| 02/09/2014 | 132.8 | 93.0 | 60.6 | 70.4 |
| 09/09/2014 | 133.0 | 93.3 | 61.2 | 69.5 |
| 16/09/2014 | 129.9 | 90.4 | 60.5 | 68.2 |
| 23/09/2014 | 129.4 | 90.0 | 61.1 | 68.0 |
| 30/09/2014 | 130.1 | 90.6 | 60.6 | 67.6 |
| 07/10/2014 | 128.0 | 88.8 | 60.8 | 66.4 |
| 14/10/2014 | 123.1 | 84.4 | 58.0 | 64.2 |
| 21/10/2014 | 121.9 | 83.2 | 54.8 | 60.5 |
| 28/10/2014 | 118.8 | 80.3 | 53.1 | 60.8 |
| 04/11/2014 | 117.8 | 79.5 | 51.7 | 60.8 |
| 11/11/2014 | 119.2 | 80.7 | 49.0 | 59.6 |
| 18/11/2014 | 116.2 | 78.1 | 47.5 | 57.2 |
| 25/11/2014 | 114.4 | 76.4 | 47.0 | 56.2 |
| 02/12/2014 | 112.3 | 74.4 | 45.9 | 54.3 |
| 09/12/2014 | 107.2 | 69.9 | 42.9 | 50.3 |
| 16/12/2014 | 101.1 | 64.4 | 41.4 | 49.7 |
| 23/12/2014 | 99.4 | 62.8 | 35.6 | 44.3 |
| 30/12/2014 | 98.1 | 61.6 | 35.7 | 44.2 |
| 06/01/2015 | 95.0 | 58.8 | 33.8 | 42.0 |
| 13/01/2015 | 91.5 | 55.7 | 30.5 | 38.1 |
| 20/01/2015 | 91.3 | 55.4 | 29.8 | 35.8 |
| 27/01/2015 | 92.5 | 56.5 | 30.3 | 37.6 |
| 03/02/2015 | 96.5 | 60.2 | 30.7 | 39.1 |
| 10/02/2015 | 101.2 | 64.5 | 34.7 | 44.2 |
| 17/02/2015 | 103.0 | 66.2 | 35.0 | 45.3 |
| 24/02/2015 | 103.7 | 66.8 | 35.7 | 47.7 |
| 03/03/2015 | 112.3 | 74.1 | 35.1 | 44.6 |
| 10/03/2015 | 108.6 | 70.6 | 35.4 | 47.4 |
| 17/03/2015 | 105.8 | 68.0 | 33.8 | 45.4 |
| 2015-03-24 | 107.3 | 69.5 | 31.6 | 43.7 |
| 2015-03-31 | 107.1 | 69.3 | 34.9 | 44.6 |
| 2015-04-07 | 108.1 | 70.2 | 35.6 | 44.2 |
| 2015-04-14 | 107.6 | 69.1 | 38.1 | 45.3 |
| 2015-04-21 | 109.70 | 72.8 | 40.5 | 46.8 |
| 2015-04-28 | 111.40 | 71.0 | 40.7 | 48.9 |
| 2015-05-05 | 114.5 | 75.3 | 41.8 | 49.9 |
| 2015-05-12 | 113.0 | 74.0 | 44.3 | 50.5 |
Figure 2: Weekly Regular Gasoline Prices
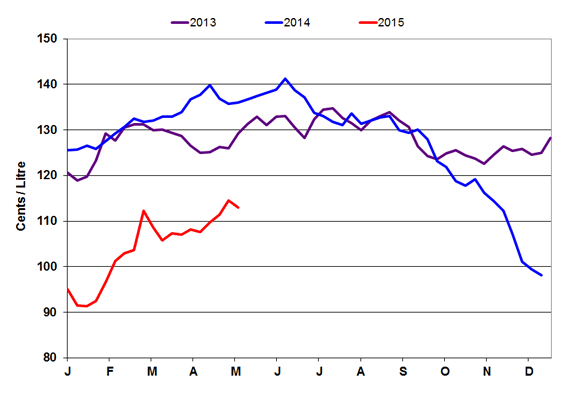
Text version
Figure 2
This graph shows the gasoline price trends from 2013 to 2015.
| Date | 2013 Gasoline at Retail | Date | 2014 Gasoline at Retail | Date | 2015 Gasoline at Retail |
|---|---|---|---|---|---|
| 13-01-01 | 118.90 | 14-01-07 | 125.00 | 15-01-06 | 95.00 |
| 13-01-08 | 120.60 | 14-01-14 | 125.60 | 15-01-13 | 91.50 |
| 13-01-15 | 118.90 | 14-01-21 | 125.70 | 15-01-20 | 91.30 |
| 13-01-22 | 119.70 | 14-01-28 | 126.60 | 15-01-27 | 92.50 |
| 13-01-29 | 123.30 | 14-02-04 | 125.90 | 15-02-03 | 96.50 |
| 13-02-05 | 129.20 | 14-02-11 | 127.60 | 15-02-10 | 101.20 |
| 13-02-12 | 127.70 | 14-02-18 | 129.30 | 15-02-17 | 103.00 |
| 13-02-19 | 130.50 | 14-02-25 | 130.70 | 15-02-24 | 103.70 |
| 13-02-26 | 131.20 | 14-03-04 | 132.50 | 15-03-03 | 112.30 |
| 13-03-05 | 131.20 | 14-03-11 | 131.80 | 15-03-10 | 108.60 |
| 13-03-12 | 129.90 | 14-03-18 | 132.00 | 15-03-17 | 105.80 |
| 13-03-19 | 130.10 | 14-03-25 | 132.90 | 15-03-24 | 107.30 |
| 13-03-26 | 129.40 | 14-04-01 | 132.90 | 15-03-31 | 107.10 |
| 13-04-02 | 128.70 | 14-04-08 | 133.90 | 15-04-07 | 108.10 |
| 13-04-09 | 126.50 | 14-04-15 | 136.80 | 15-04-14 | 107.60 |
| 13-04-16 | 125.00 | 14-04-22 | 137.70 | 15-04-21 | 109.70 |
| 13-04-23 | 125.10 | 14-04-29 | 139.80 | 15-04-28 | 111.40 |
| 13-04-30 | 126.30 | 14-05-06 | 136.90 | 15-05-05 | 114.50 |
| 13-05-07 | 126.00 | 14-05-13 | 135.70 | 15-05-12 | 113.00 |
| 13-05-14 | 129.30 | 14-05-20 | 136.00 | 15-05-19 | |
| 13-05-21 | 131.40 | 14-05-27 | 136.80 | 15-05-26 | |
| 13-05-28 | 132.90 | 14-06-03 | 137.40 | 15-06-02 | |
| 13-06-04 | 131.10 | 14-06-10 | 138.10 | 15-06-09 | |
| 13-06-11 | 132.90 | 14-06-17 | 138.80 | 15-06-16 | |
| 13-06-18 | 133.10 | 14-06-24 | 141.20 | 15-06-23 | |
| 13-06-25 | 130.50 | 14-07-01 | 138.70 | 15-06-30 | |
| 13-07-02 | 128.30 | 14-07-08 | 137.20 | 15-07-07 | |
| 13-07-09 | 132.40 | 14-07-15 | 133.80 | 15-07-14 | |
| 13-07-16 | 134.40 | 14-07-22 | 133.00 | 15-07-21 | |
| 13-07-23 | 134.70 | 14-07-29 | 131.80 | 15-07-28 | |
| 13-07-30 | 132.70 | 14-08-05 | 131.10 | 15-08-04 | |
| 13-08-06 | 131.50 | 14-08-12 | 133.60 | 15-08-11 | |
| 13-08-13 | 130.00 | 14-08-19 | 131.30 | 15-08-18 | |
| 13-08-20 | 132.00 | 14-08-26 | 132.10 | 15-08-25 | |
| 13-08-27 | 133.00 | 14-09-02 | 132.80 | 15-09-01 | |
| 13-09-03 | 133.90 | 14-09-09 | 133.00 | 15-09-08 | |
| 13-09-10 | 132.10 | 14-09-16 | 129.90 | 15-09-15 | |
| 13-09-17 | 130.60 | 14-09-23 | 129.40 | 15-09-22 | |
| 13-09-24 | 126.40 | 14-09-30 | 130.10 | 15-09-29 | |
| 13-10-01 | 124.30 | 14-10-07 | 128.00 | 15-10-06 | |
| 13-10-08 | 123.60 | 14-10-14 | 123.10 | 15-10-13 | |
| 13-10-15 | 124.80 | 14-10-21 | 121.90 | 15-10-20 | |
| 13-10-22 | 125.50 | 14-10-28 | 118.80 | 15-10-27 | |
| 13-10-29 | 124.40 | 14-11-04 | 117.80 | 15-11-03 | |
| 13-11-05 | 123.70 | 14-11-11 | 119.20 | 15-11-10 | |
| 13-11-12 | 122.60 | 14-11-18 | 116.20 | 15-11-17 | |
| 13-11-19 | 124.60 | 14-11-25 | 114.40 | 15-11-24 | |
| 13-11-26 | 126.40 | 14-12-02 | 112.30 | 15-12-01 | |
| 13-12-03 | 125.40 | 14-12-09 | 107.20 | 15-12-08 | |
| 13-12-10 | 125.90 | 14-12-16 | 101.10 | 15-12-15 | |
| 13-12-17 | 124.50 | 14-12-23 | 99.40 | 15-12-22 | |
| 13-12-24 | 125.00 | 14-12-30 | 98.10 | 15-12-29 | |
| 13-12-31 | 128.30 |
| ¢/L | Two week average ending: | Change from: 2 weeks ago | Change from: Last Year |
|---|---|---|---|
| Gasoline | 113.8 | +5.9 | -22.6 |
| Diesel | 112.2 | +1.3 | -25.7 |
| Furnace Oil | 108.5 | +0.6 | -19.0 |
| Natural Gas Prices in $CA/GJ | |||
| Alberta (NGX) | 2.58 | +0.18 | -1.94 |
| Ontario (Dawn) | 3.25 | -0.13 | -1.58 |
Source: NRCan, Bloomberg, NGX
| 2015-05-12 | ¢/kilogram | ¢/L gasoline equivalent | ¢/L diesel equivalent |
|---|---|---|---|
| Vancouver | 123.6 | 81.5 | 84.5 |
| Edmonton | 115.0 | 75.9 | 78.7 |
| Toronto | 128.4 | 84.7 | 87.8 |
Source: ¢/kg Kent Marketing Services Limited
Recent Developments
- U.S. crude inventories decrease for the first time in 4 months: U.S. EIA data show that U.S. crude inventories fell by 3.9 million barrels, compared with analysts’ expectations for an increase of 1.5 million barrels. Despite this small decline, U.S. commercial crude oil inventories remain at the highest level for this time of year in at least the last 80 years, at 487 million barrels. Source: U.S. EIA Weekly Petroleum Status Report
- February Crude Oil Exports up by 12%: The National Energy Board released crude oil export data for February 2015, which showed that Canadian exports in February 2015 were 12% higher by volume than in February 2014. Exports of heavy crude made up 70% of these exports, and reached 335,000 m3/d (2.1 MMbb / d). Exports of light crude were 150,000 m3 /d (0.94 MMbbl/d). Source: National Energy Board Commodity Statistics
- Ontario to establish Cap and Trade emissions trading system: On April 13, 2015, the Government of Ontario announced that it would create a cap and trade emissions trading system. This would establish a market for carbon emissions, by creating tradeable permits for carbon emissions, allowing businesses that can most cost effectively reduce their emissions to sell these quotas to those less able to do so. The province will join the existing emissions trading system established in other jurisdictions including Quebec and California through the Western Climate Initiative. A detailed implementation plan has not been released but is expected within the next six months. Source: Government of Ontario
Retail Gasoline Overview
For the period ending May 12, 2015, the four-week average regular gasoline pump price in selected cities across Canada increased by 5 cents to reach $1.12 per litre compared to the previous report of May 4,2015. Compared to the same period in 2014, the average Canadian pump price is 30 cents per litre lower.
The four-week average crude component remained at 44 cents compared to two weeks ago. The crude oil price component of gasoline is 29 cents per litre lower than this time last year.
Retail gasoline prices in Western centres increased by an average of 6.7 cents per litre compared to the previous report and ranged from 97 cents per litre to $1.31 per litre. Prices in Eastern cities increased by an average of 6 cents per litre and ranged from $1.11 to $1.21 per litre.
At the national level, refining and marketing costs and margins remained the same at 25 cents per litre compared to the last report two weeks ago.
Figure 3: Regular Gasoline Pump Prices in Selected Cities Four-Week Average (April 7 to April 28, 2015)
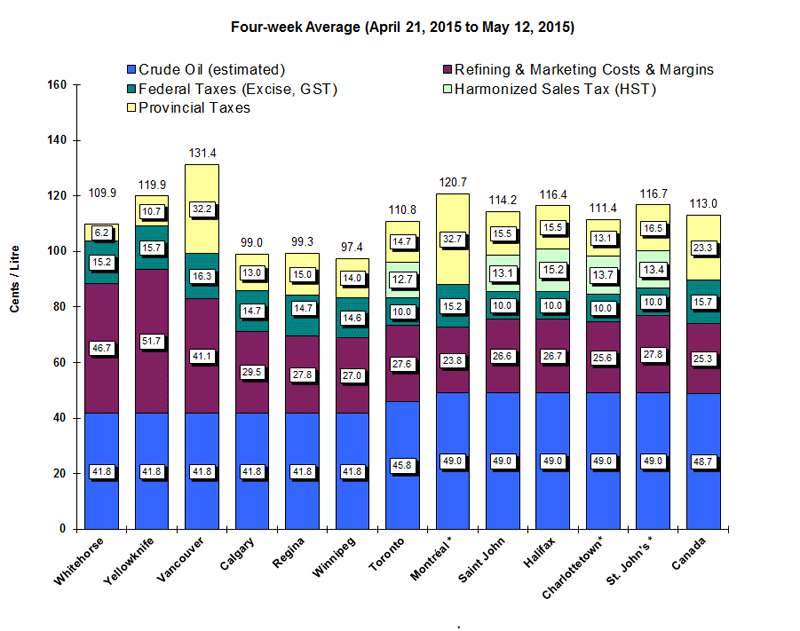
Text version
Figure 3
This graph shows the gasoline price components for 2 territories and 10 cities plus the national average.
| Whitehorse | Yellowknife | Vancouver | Calgary | Regina | Winnipeg | Toronto | Montreal* | Saint John* | Halifax* | Charlottetown* | St. John's* | Canada | |
|---|---|---|---|---|---|---|---|---|---|---|---|---|---|
| Pump Price/Prix à la pompe | 109.9 | 119.9 | 131.4 | 99.0 | 99.3 | 97.4 | 110.8 | 120.7 | 114.2 | 116.4 | 111.4 | 116.7 | 113.0 |
| Crude (est.) / Brut (est.) | 41.8 | 41.8 | 41.8 | 41.8 | 41.8 | 41.8 | 45.8 | 49.0 | 49.0 | 49.0 | 49.0 | 49.0 | 48.7 |
| Federal Taxes / Taxes fédérales | 15.2 | 15.7 | 16.3 | 14.7 | 14.7 | 14.6 | 10.0 | 15.2 | 10.0 | 10.0 | 10.0 | 10.0 | 15.7 |
| Provincial Tax / Taxe provinciale | 6.2 | 10.7 | 32.2 | 13.0 | 15.0 | 14.0 | 14.7 | 32.7 | 15.5 | 15.5 | 13.1 | 16.5 | 23.3 |
| HST | 12.7 | 13.1 | 15.2 | 13.7 | 13.4 | ||||||||
| Refining & Marketing Costs & Margins / Coûts et | 46.7 | 51.7 | 41.1 | 29.5 | 27.8 | 27.0 | 27.6 | 23.8 | 26.6 | 26.7 | 25.6 | 27.8 | 25.3 |
Source: NRCan
* Regulated Markets
Note: Toronto crude oil cost includes pipeline tolls of $4 per barrel for light crude oil from Edmonton to Sarnia, Ontario.
SmartWay Program
The SmartWay Transport Partnership is a collaboration designed to help businesses reduce fuel costs while transporting goods in the cleanest most efficient way possible. SmartWay works with freight carriers and shippers committed to benchmarking their operations, tracking their fuel consumption and improving their annual performance. Originally launched by the United States Environmental Protection Agency in 2004, SmartWay has been administered in Canada by Natural Resources Canada (NRCan) since 2012.
One of SmartWay’s partners is Thomson Terminals, which is a full-service logistics provider, offering innovative solutions in warehousing, transportation, design build and consulting, based in Toronto, Ontario. They operate a fleet of 1,000 pieces of equipment out of 12 terminals. The arrival of the SmartWay program was welcomed because it provided the tools for carriers to more accurately measure their environmental footprint. SmartWay validated many of the fuel-saving initiatives that Thomson had implemented.
For example, some of the most effective fuel-saving strategies have involved the maintenance of vehicles, especially tires. Being fuel-efficient not only provides a direct benefit to the company’s profitability, but also helps it earn new business. Requests for Proposals often have a check box asking if a prospective carrier is a member of the SmartWay program, to demonstrate that they are making efforts to improve their environmental performance.
Thomson has incorporated its SmartWay membership and environmental programs into its marketing materials.
Source: NRCan’s SmartWay program
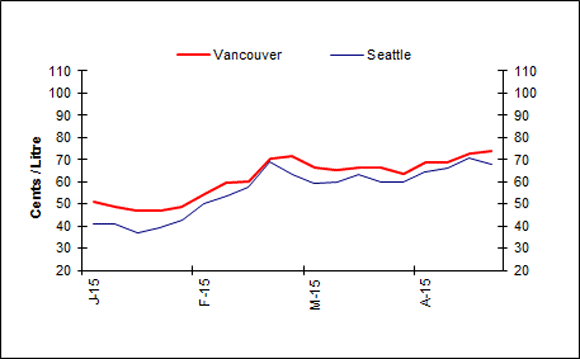
Wholesale Gasoline Prices
For the week ending May 7, 2015, wholesale gasoline prices in the selected Canadian cities increased, while in U.S. cities prices decreased.
Overall North American wholesale gasoline price changes ranged from an increase of 2.8 cents to a decrease of 3.1 cents. Prices for the period ended in the 60 to 74 cent-per-litre range. (All figures in Canadian cents per litre).
In the eastern Canadian markets wholesale gasoline prices increased by nearly 2 cents, while in the eastern U.S. markets, they declined by between 2 and 3 cents.
Overall, prices in Eastern markets ended in the 61 to 67 cent-per-litre range.
Wholesale gasoline prices in western centres followed the same pattern, with Canadian prices going up between 1 and 3 cents. In western U.S. centres, they decreased between 2 and 3 cents. Prices in selected western centres ended in the 60 to 74 cent-per-litre range.
In the last four weeks, overall wholesale price changes in selected Canadian centres increased by 2 cents, while they remained flat in the selected American centres.
 |
 |
|
 |
 |
|
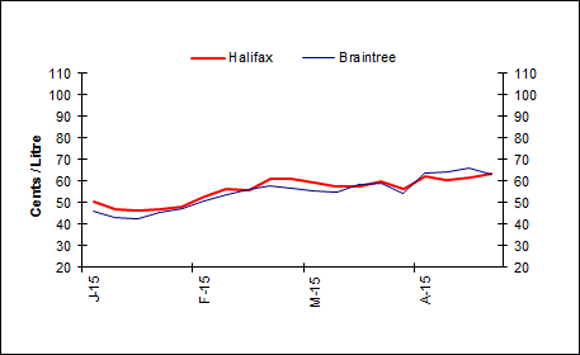 |
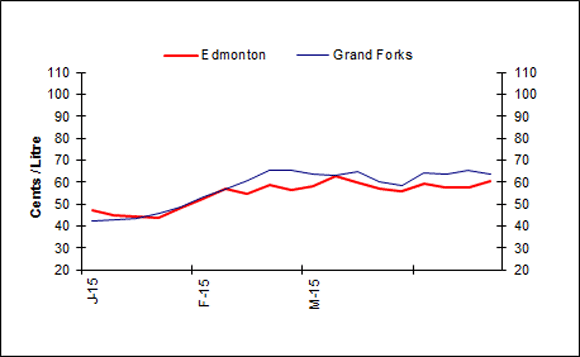
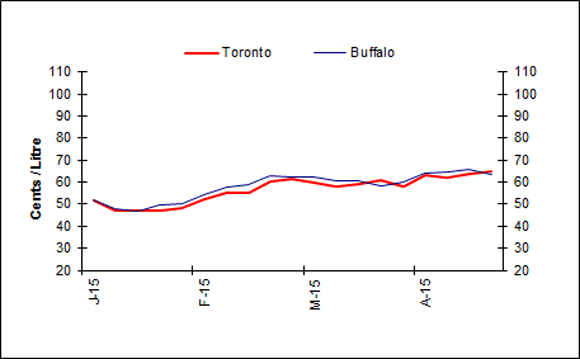
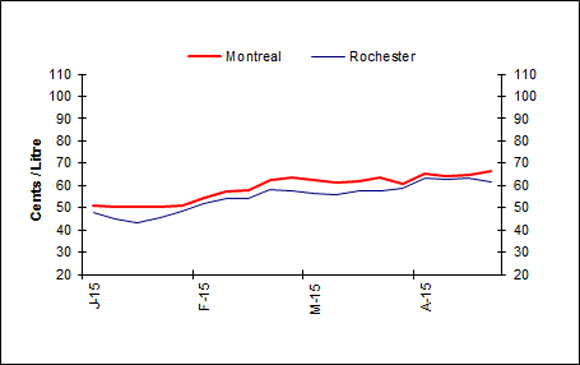
Text version
Figure 4
This graph shows the trend in wholesale gasoline prices for selected centres in Canada and the U.S.
| DATE | Halifax | Braintree | Montreal | Rochester | Toronto | Buffalo | Edmonton | Grand Forks | Vancouver | Seattle |
|---|---|---|---|---|---|---|---|---|---|---|
| Thu 02-Jan-14 | 83.00 | 81.60 | 83.90 | 81.26 | 82.40 | 81.49 | 72.90 | 77.05 | 77.80 | 72.33 |
| Thu 09-Jan-14 | 81.80 | 79.89 | 81.30 | 81.25 | 80.00 | 81.12 | 72.60 | 77.50 | 75.40 | 69.37 |
| Thu 16-Jan-14 | 79.90 | 78.10 | 80.80 | 80.69 | 79.20 | 80.27 | 73.60 | 78.54 | 74.50 | 69.50 |
| Thu 23-Jan-14 | 83.30 | 81.27 | 82.50 | 80.86 | 81.50 | 84.27 | 75.20 | 81.56 | 77.80 | 72.04 |
| Thu 30-Jan-14 | 83.60 | 81.57 | 82.50 | 81.27 | 81.60 | 83.07 | 75.90 | 82.75 | 77.20 | 72.24 |
| Thu 06-Feb-14 | 83.00 | 81.77 | 81.00 | 79.85 | 80.60 | 82.00 | 75.00 | 82.38 | 76.40 | 73.02 |
| Thu 13-Feb-14 | 85.40 | 84.58 | 83.50 | 82.68 | 83.50 | 83.54 | 77.70 | 86.24 | 79.80 | 74.26 |
| Thu 20-Feb-14 | 87.30 | 87.33 | 84.90 | 85.83 | 85.20 | 88.00 | 79.60 | 89.82 | 80.40 | 76.56 |
| Thu 27-Feb-14 | 87.60 | 87.64 | 84.60 | 86.29 | 85.70 | 87.43 | 83.00 | 89.92 | 82.60 | 80.13 |
| Thu 06-Mar-14 | 85.10 | 84.56 | 83.30 | 84.37 | 84.20 | 85.84 | 84.10 | 91.11 | 84.80 | 81.55 |
| Thu 13-Mar-14 | 85.90 | 84.97 | 83.80 | 85.80 | 83.50 | 86.75 | 85.30 | 91.48 | 85.40 | 82.23 |
| Thu 20-Mar-14 | 84.20 | 86.34 | 82.40 | 86.82 | 82.10 | 87.62 | 85.00 | 91.13 | 85.70 | 84.11 |
| Thu 27-Mar-14 | 83.40 | 84.62 | 84.00 | 84.72 | 82.80 | 87.34 | 85.90 | 90.80 | 86.80 | 85.82 |
| Thu 03-Apr-14 | 81.90 | 82.99 | 83.10 | 83.94 | 82.50 | 87.19 | 85.30 | 90.11 | 85.90 | 83.37 |
| Thu 10-Apr-14 | 86.70 | 82.53 | 86.50 | 85.36 | 86.00 | 95.70 | 88.00 | 91.01 | 89.40 | 86.71 |
| Thu 17-Apr-14 | 90.60 | 88.47 | 87.90 | 88.00 | 88.70 | 97.62 | 88.80 | 90.24 | 91.20 | 88.76 |
| Thu 24-Apr-14 | 91.30 | 91.03 | 90.10 | 89.26 | 91.40 | 99.92 | 90.50 | 92.66 | 94.50 | 88.79 |
| Thu 01-May-14 | 87.60 | 88.06 | 87.00 | 86.18 | 88.80 | 87.36 | 88.70 | 88.15 | 91.30 | 83.13 |
| Thu 08-May-14 | 86.90 | 87.20 | 84.80 | 83.61 | 86.60 | 89.49 | 86.60 | 87.11 | 91.00 | 84.56 |
| Thu 15-May-14 | 86.50 | 84.35 | 85.10 | 84.57 | 87.20 | 86.86 | 86.90 | 88.18 | 92.50 | 85.56 |
| Thu 22-May-14 | 88.30 | 85.62 | 86.70 | 85.75 | 89.30 | 88.24 | 88.30 | 90.07 | 93.20 | 88.76 |
| Thu 29-May-14 | 87.30 | 85.51 | 86.80 | 85.31 | 89.40 | 87.46 | 88.60 | 90.44 | 93.60 | 87.32 |
| Thu 05-Jun-14 | 84.80 | 84.40 | 86.10 | 82.54 | 89.80 | 86.83 | 90.60 | 89.57 | 93.60 | 88.04 |
| Thu 12-Jun-14 | 86.10 | 87.14 | 86.30 | 84.73 | 91.30 | 88.58 | 89.80 | 90.68 | 95.40 | 89.01 |
| Thu 19-Jun-14 | 88.80 | 87.87 | 89.70 | 86.27 | 93.50 | 88.82 | 90.50 | 91.88 | 97.40 | 90.68 |
| Thu 26-Jun-14 | 87.20 | 85.34 | 88.00 | 82.13 | 92.30 | 86.41 | 87.70 | 89.10 | 95.80 | 89.24 |
| Thu 03-Jul-14 | 85.20 | 83.69 | 86.20 | 81.51 | 91.00 | 83.83 | 86.10 | 87.49 | 92.60 | 84.50 |
| Thu 10-Jul-14 | 83.30 | 85.59 | 84.00 | 81.81 | 88.30 | 81.79 | 82.70 | 85.06 | 87.10 | 77.57 |
| Thu 17-Jul-14 | 83.00 | 80.56 | 83.20 | 80.28 | 87.00 | 80.73 | 81.10 | 83.27 | 85.90 | 80.33 |
| Thu 24-Jul-14 | 82.80 | 79.09 | 82.80 | 79.34 | 86.20 | 79.74 | 80.00 | 81.68 | 85.80 | 81.44 |
| Thu 31-Jul-14 | 83.80 | 87.46 | 83.40 | 80.18 | 86.40 | 80.24 | 82.20 | 83.30 | 87.80 | 84.44 |
| Thu 07-Aug-14 | 81.40 | 79.26 | 81.80 | 80.46 | 84.90 | 79.89 | 81.90 | 88.04 | 87.30 | 86.85 |
| Thu 14-Aug-14 | 82.60 | 77.16 | 82.40 | 79.65 | 84.90 | 78.55 | 84.30 | 84.66 | 87.00 | 84.17 |
| Thu 21-Aug-14 | 81.90 | 79.42 | 81.70 | 79.51 | 83.90 | 81.73 | 81.80 | 85.88 | 86.20 | 87.20 |
| Thu 28-Aug-14 | 83.10 | 78.90 | 82.80 | 80.35 | 84.40 | 80.39 | 82.90 | 83.88 | 86.70 | 83.98 |
| Thu 04-Sep-14 | 83.10 | 80.84 | 83.70 | 79.15 | 84.90 | 82.42 | 84.60 | 83.78 | 87.50 | 82.30 |
| Thu 11-Sep-14 | 81.50 | 76.41 | 81.80 | 76.36 | 81.60 | 81.51 | 83.70 | 81.38 | 84.00 | 76.59 |
| Thu 18-Sep-14 | 80.60 | 77.81 | 80.50 | 74.98 | 80.70 | 79.17 | 81.60 | 80.84 | 82.80 | 71.42 |
| Thu 25-Sep-14 | 83.60 | 78.95 | 83.50 | 80.27 | 83.20 | 82.88 | 82.40 | 84.63 | 81.10 | 74.90 |
| Thu 02-Oct-14 | 81.10 | 79.27 | 80.70 | 78.81 | 80.80 | 77.62 | 80.70 | 77.68 | 79.00 | 70.20 |
| Thu 09-Oct-14 | 76.90 | 79.26 | 76.00 | 68.83 | 75.10 | 72.60 | 76.90 | 75.00 | 73.00 | 62.09 |
| Thu 16-Oct-14 | 72.80 | 80.09 | 71.40 | 71.13 | 70.90 | 73.39 | 71.60 | 77.11 | 68.80 | 60.12 |
| Thu 23-Oct-14 | 73.00 | 79.88 | 71.20 | 68.07 | 71.40 | 73.20 | 71.00 | 84.35 | 68.90 | 61.00 |
| Thu 30-Oct-14 | 72.80 | 67.77 | 72.30 | 68.97 | 73.10 | 71.65 | 70.00 | 74.62 | 71.90 | 62.09 |
| Thu 06-Nov-14 | 68.60 | 67.60 | 68.40 | 68.48 | 69.50 | 72.40 | 70.10 | 69.67 | 71.40 | 67.60 |
| Thu 13-Nov-14 | 69.50 | 65.75 | 69.90 | 65.51 | 70.50 | 69.41 | 69.90 | 62.53 | 74.60 | 68.81 |
| Thu 20-Nov-14 | 68.20 | 65.89 | 68.10 | 64.70 | 68.40 | 70.32 | 65.70 | 62.55 | 70.30 | 64.40 |
| Thu 27-Nov-14 | 67.50 | 65.06 | 67.70 | 65.72 | 68.10 | 70.63 | 63.70 | 62.26 | 65.70 | 59.13 |
| Thu 04-Dec-14 | 61.90 | 58.14 | 62.40 | 58.98 | 62.70 | 62.97 | 59.20 | 56.59 | 60.20 | 51.92 |
| Thu 11-Dec-14 | 55.60 | 52.87 | 57.20 | 53.75 | 57.10 | 58.20 | 55.70 | 53.10 | 54.70 | 44.73 |
| Thu 18-Dec-14 | 53.90 | 50.11 | 55.60 | 52.37 | 55.80 | 56.36 | 52.20 | 48.09 | 54.70 | 42.88 |
| Thu 25-Dec-14 | 54.20 | 51.09 | 55.70 | 52.54 | 56.30 | 57.54 | 52.10 | 47.32 | 55.20 | 44.15 |
| Thu 01-Jan-15 | 50.20 | 45.88 | 51.30 | 47.82 | 51.70 | 52.04 | 47.20 | 42.25 | 51.20 | 41.16 |
| Thu 08-Jan-15 | 46.90 | 43.19 | 50.60 | 44.81 | 47.30 | 48.09 | 45.00 | 42.87 | 48.50 | 40.72 |
| Thu 15-Jan-15 | 46.60 | 42.30 | 50.30 | 43.50 | 47.20 | 46.68 | 44.20 | 43.28 | 47.00 | 37.04 |
| Thu 22-Jan-15 | 47.20 | 45.26 | 50.50 | 45.67 | 47.20 | 49.64 | 43.90 | 45.92 | 47.00 | 39.15 |
| Thu 29-Jan-15 | 48.20 | 47.00 | 51.00 | 48.37 | 48.00 | 50.44 | 48.40 | 48.80 | 48.80 | 42.85 |
| Thu 05-Feb-15 | 52.90 | 50.65 | 54.60 | 51.75 | 52.20 | 54.13 | 52.10 | 53.44 | 54.60 | 50.12 |
| Thu 12-Feb-15 | 56.20 | 53.56 | 57.40 | 54.19 | 55.40 | 57.51 | 56.70 | 56.48 | 59.40 | 53.76 |
| Thu 19-Feb-15 | 55.60 | 55.91 | 57.70 | 54.23 | 55.40 | 58.78 | 54.70 | 60.87 | 60.40 | 57.33 |
| Thu 26-Feb-15 | 60.80 | 57.71 | 62.30 | 58.17 | 60.20 | 62.69 | 58.60 | 65.23 | 70.30 | 68.96 |
| Thu 05-Mar-15 | 61.20 | 56.75 | 63.80 | 57.62 | 61.20 | 62.49 | 56.30 | 65.32 | 71.60 | 63.08 |
| Thu 12-Mar-15 | 59.30 | 55.45 | 62.70 | 56.74 | 62.36 | 62.36 | 58.20 | 63.71 | 66.40 | 59.34 |
| Thu 19-Mar-15 | 57.90 | 54.71 | 61.40 | 55.89 | 58.30 | 60.60 | 63.00 | 63.29 | 65.20 | 59.76 |
| Thu 26-Mar-15 | 58.10 | 58.24 | 62.00 | 57.84 | 58.90 | 60.60 | 60.10 | 64.71 | 66.30 | 63.29 |
| Thu 02-Apr-15 | 59.60 | 58.97 | 63.70 | 57.44 | 60.80 | 58.31 | 57.10 | 59.91 | 66.20 | 59.80 |
| Thu 09-Apr-15 | 59.60 | 54.12 | 60.70 | 58.63 | 57.80 | 60.01 | 55.90 | 58.28 | 63.30 | 59.94 |
| Thu 16-Apr-15 | 62.10 | 63.74 | 65.30 | 63.38 | 63.10 | 63.81 | 59.20 | 63.94 | 68.60 | 64.41 |
| Thu 23-Apr-15 | 60.70 | 64.33 | 64.20 | 62.59 | 62.20 | 64.43 | 57.80 | 63.33 | 68.60 | 66.20 |
| Thu 30 Apr-15 | 61.70 | 65.85 | 64.70 | 63.49 | 63.50 | 65.56 | 57.40 | 65.51 | 72.60 | 70.92 |
| Thu 7 May-15 | 63.50 | 63.07 | 66.60 | 61.79 | 65.20 | 63.39 | 60.20 | 63.71 | 73.80 | 67.87 |
Sources: NRCan, Bloomberg Oil Buyers Guide
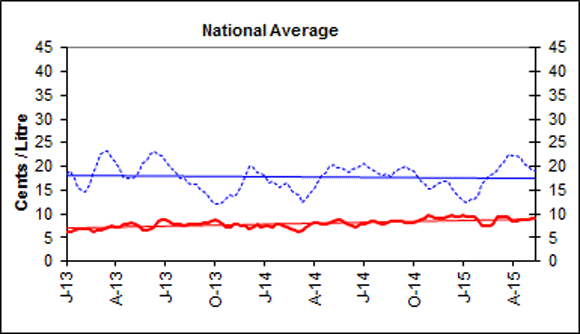
Gasoline Refining and Marketing Margins
Four-week rolling averages are used for gasoline refining and marketing margins.
These gasoline refining margins refer to the difference between the cost of crude oil and the wholesale price at which the refiner can sell gasoline. The margin includes the cost associated with refining the product as well as a profit for the retailer.
The gasoline marketing margins represent the difference between the wholesale and retail prices of gasoline. This margin pays for the costs associated with operating a service station.
In general, both refining and marketing margins are influenced by specific market conditions, mainly due to changes in product supply and demand balances.
Gasoline refining margins exhibit similar patterns as the wholesale gasoline market, rising and falling closely with demand. Individual markets determine each individual margin and ultimately the overall price at the pump.
Gasoline refining margins have been trending lower since their peak this year in mid-March, where they reached a national average of 22 cents per litre. They have since come down slightly, reaching 19 cents per litre this week, compared to last year at this time when margins were 3 cents per litre higher.
 |
 |
|
 |
 |
|
 |
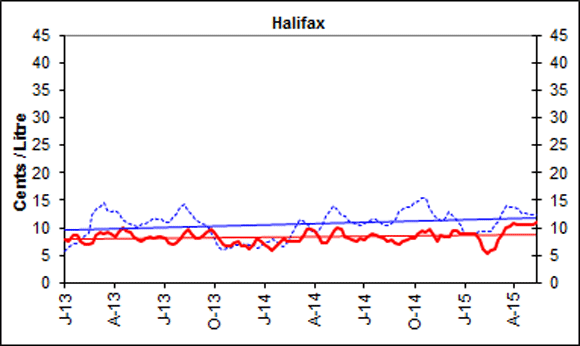 |
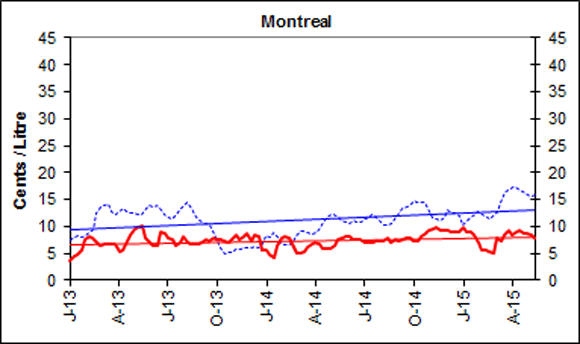
Text version
Figure 5
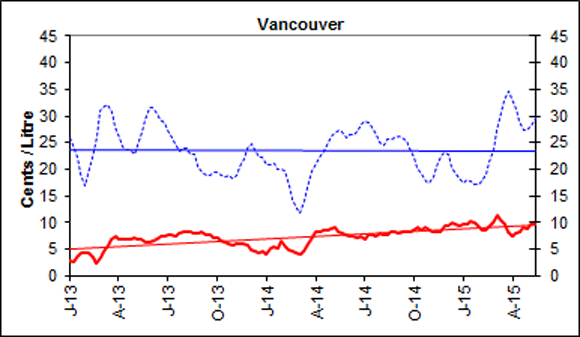
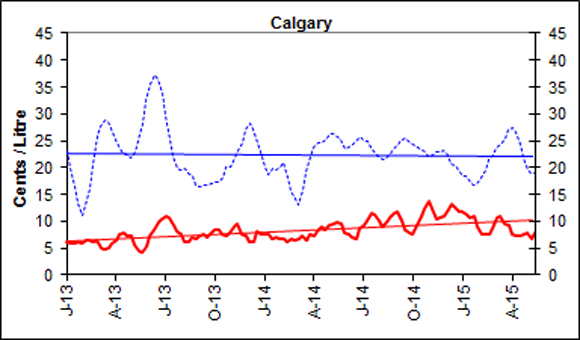
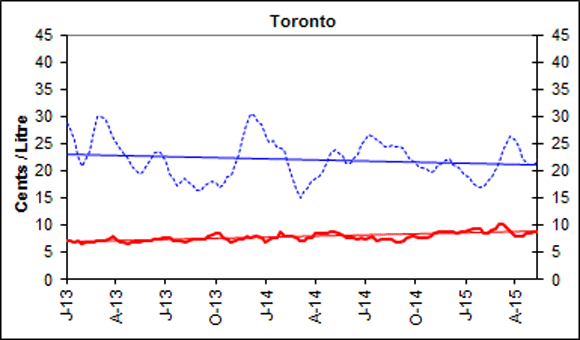
These graphs show the trend in refining and marketing costs and margins for selected centres in Canada and the national average.
| 4-week rolling average | Canada | Vancouver | Calgary | Toronto | Montreal | Halifax | ||||||
|---|---|---|---|---|---|---|---|---|---|---|---|---|
| Marketing Margin | Refining Margin | Marketing Margin | Refining Margin | Marketing Margin | Refining Margin | Marketing Margin | Refining Margin | Marketing Margin | Refining Margin | Marketing Margin | Refining Margin | |
| 2013-01-01 | 6.2 | 18.6 | 2.8 | 25.9 | 6.1 | 23.1 | 7.1 | 28.9 | 3.6 | 7.3 | 7.7 | 5.6 |
| 2013-01-08 | 6.4 | 19.0 | 2.7 | 24.5 | 6.0 | 19.8 | 7.1 | 27.6 | 4.4 | 8.0 | 7.5 | 6.6 |
| 2013-01-15 | 6.5 | 17.5 | 3.5 | 22.2 | 5.9 | 16.3 | 6.8 | 25.5 | 4.6 | 8.2 | 8.5 | 7.2 |
| 2013-01-22 | 6.9 | 15.6 | 4.4 | 20.2 | 6.3 | 14.3 | 7.0 | 23.9 | 5.5 | 8.3 | 8.5 | 7.6 |
| 2013-01-29 | 6.9 | 15.0 | 4.2 | 16.8 | 5.8 | 11.0 | 6.5 | 20.7 | 7.7 | 8.4 | 7.6 | 7.9 |
| 2013-02-05 | 7.0 | 14.6 | 4.2 | 18.2 | 6.4 | 12.3 | 6.8 | 21.1 | 8.1 | 9.5 | 7.1 | 9.2 |
| 2013-02-12 | 6.8 | 16.2 | 3.4 | 22.2 | 6.4 | 16.1 | 6.9 | 23.6 | 7.8 | 9.4 | 7.1 | 9.1 |
| 2013-02-19 | 6.4 | 18.5 | 2.4 | 25.6 | 6.2 | 19.9 | 6.8 | 25.7 | 7.0 | 11.0 | 7.4 | 10.8 |
| 2013-02-26 | 6.6 | 20.8 | 3.4 | 31.1 | 6.3 | 26.0 | 7.0 | 30.0 | 6.3 | 13.7 | 8.6 | 13.6 |
| 2013-03-05 | 6.7 | 22.7 | 4.7 | 32.0 | 5.2 | 27.8 | 7.0 | 30.1 | 6.7 | 13.9 | 9.3 | 14.0 |
| 2013-03-12 | 6.8 | 23.3 | 5.8 | 32.1 | 4.7 | 28.9 | 7.1 | 29.7 | 6.8 | 14.3 | 9.0 | 14.6 |
| 2013-03-19 | 7.2 | 23.1 | 7.0 | 31.5 | 5.1 | 29.1 | 7.4 | 29.4 | 6.8 | 12.3 | 9.1 | 12.8 |
| 2013-03-26 | 7.5 | 21.7 | 7.3 | 27.8 | 6.0 | 26.5 | 7.8 | 26.4 | 6.7 | 12.3 | 9.0 | 12.9 |
| 2013-04-02 | 7.1 | 20.9 | 6.9 | 26.5 | 6.4 | 25.8 | 7.5 | 25.6 | 5.2 | 12.6 | 8.4 | 12.9 |
| 2013-04-09 | 7.3 | 19.4 | 6.8 | 24.2 | 7.4 | 23.6 | 6.8 | 24.1 | 5.7 | 13.2 | 9.2 | 12.6 |
| 2013-04-16 | 7.8 | 17.9 | 6.9 | 22.7 | 7.7 | 21.6 | 6.7 | 22.2 | 7.2 | 11.6 | 10.1 | 10.5 |
| 2013-04-23 | 7.9 | 17.6 | 7.0 | 23.6 | 7.3 | 22.4 | 6.6 | 22.5 | 8.4 | 12.6 | 9.5 | 11.1 |
| 2013-04-30 | 8.2 | 17.6 | 7.2 | 24.1 | 7.4 | 22.9 | 6.8 | 22.2 | 9.5 | 12.2 | 9.2 | 10.6 |
| 2013-05-07 | 7.8 | 17.9 | 6.8 | 24.4 | 5.6 | 23.0 | 6.9 | 20.1 | 9.9 | 12.1 | 8.3 | 10.3 |
| 2013-05-14 | 7.4 | 19.2 | 6.7 | 27.0 | 4.4 | 25.1 | 6.9 | 19.3 | 10.2 | 12.4 | 7.8 | 10.2 |
| 2013-05-21 | 6.6 | 20.7 | 6.3 | 29.2 | 4.1 | 28.2 | 7.0 | 19.6 | 7.7 | 13.4 | 7.6 | 10.7 |
| 2013-05-28 | 6.7 | 21.3 | 6.3 | 31.3 | 5.4 | 32.2 | 7.0 | 20.8 | 6.9 | 13.8 | 8.1 | 10.9 |
| 2013-06-04 | 7.0 | 22.6 | 6.6 | 31.4 | 7.2 | 35.6 | 7.2 | 22.0 | 6.3 | 13.7 | 8.4 | 11.2 |
| 2013-06-11 | 7.3 | 23.3 | 6.8 | 29.9 | 8.5 | 36.8 | 7.2 | 22.9 | 6.4 | 13.9 | 8.1 | 11.8 |
| 2013-06-18 | 8.5 | 22.7 | 7.5 | 29.4 | 9.9 | 36.5 | 7.4 | 23.5 | 9.0 | 13.0 | 8.2 | 11.5 |
| 2013-10-22 | 7.3 | 13.2 | 5.9 | 18.8 | 7.3 | 20.0 | 7.4 | 18.8 | 6.9 | 5.1 | 6.8 | 6.3 |
| 2013-10-29 | 7.3 | 13.9 | 5.7 | 18.1 | 7.8 | 20.1 | 6.9 | 19.1 | 7.6 | 5.1 | 6.7 | 6.3 |
| 2013-11-05 | 7.8 | 13.6 | 5.9 | 18.8 | 8.9 | 21.3 | 7.2 | 20.8 | 8.4 | 5.7 | 7.3 | 6.9 |
| 2013-11-12 | 7.8 | 14.5 | 6.0 | 18.5 | 9.5 | 21.2 | 7.4 | 21.2 | 7.6 | 6.0 | 7.4 | 7.0 |
| 2013-11-19 | 7.6 | 16.2 | 6.1 | 21.9 | 7.7 | 24.7 | 7.3 | 25.6 | 8.3 | 5.9 | 6.6 | 7.0 |
| 2013-11-26 | 7.6 | 17.8 | 5.8 | 23.7 | 7.2 | 26.9 | 7.9 | 28.3 | 8.8 | 6.8 | 6.6 | 7.8 |
| 2013-12-03 | 7.0 | 19.9 | 4.9 | 24.8 | 6.1 | 28.1 | 7.7 | 30.5 | 7.3 | 5.9 | 6.1 | 6.9 |
| 2013-12-10 | 7.3 | 20.2 | 4.5 | 24.3 | 6.1 | 27.8 | 7.9 | 30.9 | 8.3 | 6.2 | 6.9 | 7.0 |
| 2013-12-17 | 7.8 | 18.9 | 4.3 | 22.2 | 8.2 | 24.6 | 7.8 | 28.9 | 8.0 | 6.1 | 8.0 | 6.4 |
| 2013-12-24 | 7.2 | 18.4 | 4.7 | 22.3 | 7.6 | 22.9 | 7.7 | 28.5 | 5.6 | 6.8 | 7.6 | 6.5 |
| 2013-12-31 | 7.5 | 18.1 | 4.0 | 21.0 | 7.5 | 20.0 | 6.8 | 26.3 | 5.6 | 8.2 | 6.9 | 7.3 |
| 2014-01-07 | 7.7 | 16.4 | 5.2 | 20.8 | 7.6 | 18.6 | 7.4 | 25.3 | 4.7 | 8.1 | 6.3 | 7.4 |
| 2014-01-14 | 7.3 | 16.7 | 5.5 | 21.2 | 6.8 | 19.7 | 7.6 | 25.6 | 4.1 | 8.7 | 5.8 | 8.1 |
| 2014-01-21 | 7.9 | 16.3 | 5.2 | 20.1 | 7.0 | 19.4 | 7.6 | 24.3 | 6.4 | 8.1 | 6.6 | 7.7 |
| 2014-01-28 | 7.9 | 15.6 | 6.6 | 20.1 | 6.7 | 20.1 | 8.7 | 24.1 | 7.8 | 6.9 | 7.4 | 6.7 |
| 2014-02-04 | 7.6 | 16.1 | 5.5 | 20.0 | 6.7 | 21.3 | 8.0 | 24.2 | 8.2 | 6.5 | 8.1 | 6.7 |
| 2014-02-11 | 7.3 | 16.4 | 5.0 | 16.9 | 6.1 | 18.0 | 8.0 | 20.7 | 7.8 | 6.5 | 7.6 | 7.3 |
| 2014-02-18 | 7.0 | 15.0 | 4.6 | 16.4 | 6.7 | 17.7 | 7.9 | 20.3 | 6.6 | 7.2 | 7.6 | 8.7 |
| 2014-02-25 | 6.5 | 14.3 | 4.3 | 12.5 | 6.5 | 14.3 | 7.8 | 16.8 | 5.1 | 8.2 | 7.4 | 10.2 |
| 2014-03-04 | 6.3 | 14.1 | 4.0 | 11.8 | 6.7 | 13.3 | 7.2 | 15.0 | 5.0 | 9.1 | 7.4 | 11.6 |
| 2014-03-11 | 6.7 | 12.6 | 4.7 | 14.0 | 7.3 | 16.0 | 7.1 | 16.0 | 5.3 | 9.1 | 8.8 | 11.2 |
| 2014-03-18 | 7.1 | 13.3 | 5.9 | 15.3 | 6.5 | 17.9 | 7.6 | 15.7 | 6.3 | 8.5 | 9.6 | 10.4 |
| 2014-03-25 | 7.7 | 14.3 | 6.8 | 19.7 | 7.4 | 22.1 | 7.8 | 18.0 | 6.6 | 8.4 | 9.6 | 9.7 |
| 2014-04-01 | 8.1 | 15.1 | 8.3 | 21.5 | 7.3 | 24.1 | 8.4 | 18.9 | 7.0 | 8.4 | 9.4 | 8.7 |
| 2014-04-08 | 8.1 | 16.6 | 8.3 | 22.4 | 8.1 | 24.5 | 8.5 | 19.0 | 6.8 | 9.5 | 8.4 | 9.3 |
| 2014-04-15 | 7.8 | 18.2 | 8.5 | 23.7 | 9.0 | 24.9 | 8.4 | 20.3 | 5.8 | 11.1 | 7.1 | 11.0 |
| 2014-04-22 | 7.8 | 18.9 | 8.6 | 24.4 | 8.5 | 25.2 | 8.6 | 21.3 | 5.7 | 11.5 | 7.2 | 12.1 |
| 2014-04-29 | 8.0 | 20.0 | 8.7 | 26.0 | 9.3 | 26.1 | 8.7 | 23.0 | 5.9 | 12.2 | 8.2 | 13.2 |
| 2014-05-06 | 8.4 | 20.3 | 9.0 | 26.7 | 9.6 | 26.3 | 8.8 | 23.7 | 6.4 | 12.3 | 9.4 | 14.0 |
| 2014-05-13 | 8.7 | 19.8 | 8.4 | 27.4 | 9.9 | 26.0 | 8.5 | 23.5 | 7.4 | 11.5 | 10.0 | 13.3 |
| 2014-05-20 | 8.6 | 19.6 | 8.1 | 27.2 | 9.7 | 25.2 | 8.2 | 22.9 | 8.0 | 11.0 | 9.6 | 12.3 |
| 2014-05-27 | 8.0 | 19.4 | 7.7 | 27.2 | 7.9 | 24.8 | 7.8 | 22.5 | 8.0 | 10.8 | 8.4 | 12.1 |
| 2014-06-03 | 7.7 | 18.8 | 7.4 | 26.4 | 7.4 | 23.9 | 7.7 | 21.4 | 8.1 | 10.6 | 8.1 | 11.3 |
| 2014-06-10 | 7.4 | 19.4 | 7.3 | 26.4 | 6.9 | 24.3 | 7.6 | 22.0 | 7.7 | 11.2 | 7.8 | 11.3 |
| 2014-06-17 | 7.3 | 19.8 | 7.1 | 26.9 | 6.8 | 24.7 | 7.3 | 23.0 | 7.6 | 10.8 | 7.7 | 10.7 |
| 2014-06-24 | 7.8 | 19.9 | 7.3 | 28.5 | 8.6 | 25.7 | 7.7 | 24.8 | 7.6 | 11.0 | 8.0 | 10.5 |
| 2014-07-01 | 7.8 | 20.7 | 6.9 | 29.1 | 9.3 | 25.1 | 7.3 | 25.8 | 6.9 | 11.3 | 7.8 | 10.7 |
| 2014-07-08 | 8.2 | 20.0 | 7.7 | 28.0 | 10.0 | 24.0 | 7.7 | 25.6 | 7.1 | 10.8 | 8.2 | 10.3 |
| 2014-07-15 | 8.6 | 19.4 | 7.6 | 27.9 | 11.4 | 23.8 | 7.8 | 26.4 | 6.9 | 12.2 | 8.9 | 11.6 |
| 2014-07-22 | 8.4 | 19.0 | 7.3 | 26.2 | 11.2 | 22.4 | 7.1 | 25.6 | 7.2 | 11.6 | 8.7 | 11.3 |
| 2014-07-29 | 8.3 | 18.4 | 7.9 | 25.1 | 9.9 | 22.0 | 7.4 | 25.2 | 7.1 | 11.1 | 8.3 | 11.0 |
| 2014-08-05 | 7.9 | 18.2 | 7.6 | 24.6 | 8.9 | 21.6 | 7.2 | 24.4 | 7.2 | 10.4 | 8.1 | 10.4 |
| 2014-08-12 | 8.0 | 18.4 | 8.1 | 25.1 | 9.7 | 21.8 | 7.3 | 24.4 | 7.8 | 10.3 | 7.6 | 10.5 |
| 2014-08-19 | 8.6 | 17.8 | 8.3 | 25.2 | 10.5 | 22.3 | 7.3 | 24.2 | 7.0 | 10.1 | 7.8 | 10.4 |
| 2014-08-26 | 8.6 | 18.6 | 8.1 | 25.9 | 11.4 | 23.4 | 6.9 | 24.5 | 7.5 | 11.3 | 7.2 | 11.6 |
| 2014-09-02 | 8.4 | 19.5 | 7.9 | 26.6 | 11.8 | 24.5 | 6.8 | 24.7 | 7.4 | 12.2 | 7.0 | 12.5 |
| 2014-09-09 | 8.5 | 19.6 | 7.6 | 26.4 | 10.1 | 25.2 | 7.1 | 24.1 | 7.6 | 13.4 | 7.5 | 13.3 |
| 2014-09-16 | 8.0 | 20.1 | 8.2 | 25.4 | 8.5 | 25.4 | 7.6 | 22.9 | 7.7 | 13.4 | 7.8 | 13.3 |
| 2014-09-23 | 8.2 | 19.3 | 8.3 | 24.1 | 7.8 | 24.8 | 8.0 | 21.8 | 7.8 | 13.8 | 8.1 | 13.7 |
| 2014-09-30 | 8.1 | 19.2 | 8.6 | 22.2 | 7.5 | 24.4 | 7.9 | 21.6 | 7.3 | 14.3 | 8.0 | 14.2 |
| 2014-10-07 | 8.4 | 18.1 | 9.2 | 20.2 | 9.2 | 23.7 | 7.6 | 20.8 | 7.2 | 14.5 | 8.9 | 14.9 |
| 2014-10-14 | 8.8 | 17.0 | 8.6 | 17.9 | 11.0 | 22.1 | 7.7 | 19.2 | 8.0 | 13.2 | 9.6 | 13.9 |
| 2014-10-21 | 9.2 | 15.7 | 9.2 | 17.7 | 12.4 | 23.0 | 7.7 | 20.4 | 8.8 | 14.5 | 9.3 | 15.4 |
| 2014-10-28 | 9.6 | 13.4 | 8.5 | 16.5 | 13.8 | 21.1 | 8.0 | 18.8 | 9.2 | 12.5 | 9.6 | 13.5 |
| 2014-11-04 | 9.3 | 15.2 | 8.1 | 18.5 | 12.3 | 22.2 | 8.4 | 19.9 | 9.4 | 11.5 | 8.9 | 12.3 |
| 2014-11-11 | 9.2 | 16.2 | 8.3 | 19.7 | 10.5 | 21.9 | 8.7 | 20.2 | 9.9 | 10.6 | 7.5 | 11.1 |
| 2014-11-18 | 9.2 | 16.4 | 8.4 | 22.4 | 10.7 | 22.9 | 8.8 | 21.4 | 9.1 | 11.0 | 8.5 | 11.3 |
| 2014-11-25 | 9.2 | 16.8 | 9.4 | 22.7 | 10.9 | 22.7 | 8.7 | 21.4 | 9.4 | 10.8 | 8.3 | 11.0 |
| 2014-12-02 | 9.4 | 16.8 | 9.4 | 22.9 | 11.8 | 22.4 | 8.8 | 22.2 | 9.1 | 13.1 | 8.5 | 12.9 |
| 2014-12-09 | 9.7 | 15.7 | 9.9 | 19.4 | 13.2 | 19.6 | 8.8 | 20.1 | 8.9 | 11.5 | 9.4 | 11.1 |
| 2014-12-16 | 9.5 | 14.2 | 9.5 | 19.2 | 12.5 | 20.2 | 8.5 | 20.9 | 9.1 | 12.5 | 9.3 | 11.7 |
| 2014-12-23 | 9.4 | 13.8 | 9.5 | 18.3 | 11.8 | 19.4 | 8.8 | 20.1 | 9.1 | 11.9 | 9.0 | 10.4 |
| 2014-12-30 | 9.6 | 12.9 | 9.8 | 17.5 | 11.8 | 18.4 | 8.9 | 19.0 | 9.7 | 10.3 | 9.0 | 8.9 |
| 2015-01-06 | 9.4 | 12.5 | 9.7 | 18.1 | 11.3 | 18.3 | 9.1 | 18.9 | 8.8 | 11.2 | 9.0 | 9.0 |
| 2015-01-13 | 9.6 | 13.0 | 10.1 | 17.6 | 10.7 | 17.1 | 9.4 | 17.8 | 8.9 | 11.6 | 9.0 | 8.9 |
| 2015-01-20 | 9.5 | 12.9 | 9.9 | 17.1 | 10.9 | 16.7 | 9.4 | 17.1 | 8.3 | 12.1 | 8.8 | 9.0 |
| 2015-01-27 | 8.7 | 13.9 | 9.4 | 17.2 | 8.9 | 17.4 | 9.3 | 17.0 | 7.0 | 12.7 | 7.9 | 9.2 |
| 2015-02-03 | 7.6 | 16.1 | 8.6 | 18.9 | 7.5 | 19.3 | 8.5 | 18.3 | 5.7 | 14.0 | 6.1 | 11.0 |
| 2015-02-10 | 7.5 | 17.2 | 8.6 | 19.3 | 7.6 | 19.6 | 8.6 | 18.0 | 5.5 | 11.8 | 5.4 | 9.4 |
| 2015-02-17 | 7.6 | 18.0 | 9.3 | 21.9 | 7.6 | 21.9 | 9.0 | 19.4 | 5.3 | 12.5 | 5.8 | 10.6 |
| 2015-02-24 | 7.8 | 18.5 | 10.1 | 23.7 | 8.6 | 22.5 | 9.3 | 20.0 | 5.0 | 12.0 | 6.2 | 10.4 |
| 2015-03-03 | 9.5 | 19.1 | 11.3 | 27.3 | 10.8 | 23.7 | 10.2 | 21.7 | 7.7 | 13.2 | 7.7 | 11.6 |
| 2015-03-10 | 9.5 | 20.2 | 10.5 | 30.6 | 11.0 | 24.4 | 10.1 | 23.6 | 7.3 | 14.5 | 8.9 | 12.6 |
| 2015-03-17 | 9.4 | 20.9 | 9.7 | 32.1 | 9.7 | 24.7 | 9.6 | 24.4 | 8.3 | 15.8 | 9.9 | 13.4 |
| 2015-03-24 | 9.5 | 22.6 | 8.2 | 34.7 | 9.2 | 27.1 | 8.6 | 26.2 | 9.2 | 16.8 | 10.3 | 13.9 |
| 2015-03-31 | 8.6 | 22.3 | 7.5 | 33.3 | 7.6 | 27.3 | 8.0 | 25.7 | 8.4 | 17.3 | 10.9 | 13.9 |
| 2015-04-07 | 8.6 | 22.4 | 7.9 | 31.2 | 7.2 | 26.5 | 7.9 | 24.4 | 9.1 | 17.2 | 10.6 | 13.4 |
| 2015-04-14 | 8.7 | 21.9 | 8.3 | 30.1 | 7.4 | 25.1 | 8.1 | 23.5 | 9.2 | 17.1 | 10.6 | 13.2 |
| 2015-04-21 | 8.6 | 20.7 | 9.2 | 27.3 | 7.5 | 21.7 | 8.5 | 21.4 | 8.7 | 16.4 | 10.6 | 12.6 |
| 2015-04-28 | 8.8 | 20.0 | 9.0 | 27.3 | 7.8 | 19.6 | 8.4 | 21.2 | 8.6 | 16.0 | 10.6 | 12.3 |
| 2015-05-05 | 9.2 | 19.6 | 9.6 | 28.2 | 6.8 | 18.9 | 8.8 | 21.2 | 8.3 | 15.7 | 10.5 | 12.4 |
| 2015-05-12 | 9.3 | 19.2 | 9.7 | 29.7 | 7.9 | 19.0 | 8.8 | 21.8 | 7.8 | 15.8 | 11.0 | 12.5 |
Source: NRCan
Crude Oil Overview
Crude prices continue on an upward trend
For the week ending May 8, 2015, prices for the three light crude benchmarks averaged between CAD$446.93/m3 and CAD$505.26/m3 (US$58.85 and US$66.53 per barrel).
The price for all three light crude benchmarks increased over the previous week. Canadian light crude oil prices at Edmonton increased by CAD$21.90/m3 (US$2.96 per barrel) from the previous week, WTI increased by CAD$37.11/m3 (US$4.91 per barrel) and Brent increased by CAD$6.03/m3 (US$0.82 per barrel).
The differential between Canadian light crude oil prices remain significantly cheaper than imported global crudes. Currently Canadian light is US$4.53 per barrel less than Brent. However the differential between Canadian light crude and WTI has narrowed significantly, reaching only $0.79 on May 8.
The Western Canada Select crude oil price increased by CAD$23.99/m3 (US$3.19 per barrel) from the previous week, and has decreased by CAD$171.15/m3 (US$30.48 per barrel) compared to last year.
In the past two months, WCS has surged more than 70%. The increase in the price of WCS has outpaced growth in other major benchmarks, including Brent and WTI. Thus in this period, the WTI-WCS spread has decreased from $13.75/bbl in mid-March to $8.40/bbl. The factors responsible for the surge in prices include seasonal uptick in demand for heavier crudes to make asphalt, improving access to U.S. refining regions, and recent reports of declining U.S. heavy imports from Mexico and Columbia, which compete for market share with WCS.
Figure 6: Crude Oil Price Comparisons
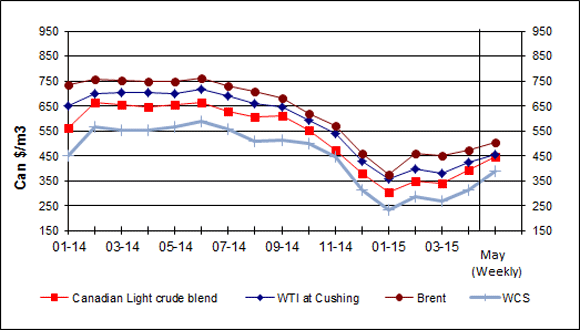
Text version
Figure 6
This graph shows crude oil prices for Canadian Light Sweet, WTI, Brent and WCS. The average weekly prices for the period ending May 8, 2015, were $446.93/cubic metres, $453.49/cubic metres, $505.26/cubic metres and $389.32/cubic metres for the Canadian Light, WTI, Brent and WCS, respectively.
| Dates | (Canadian Light Sweet) | WTI | Brent | WCS |
|---|---|---|---|---|
| 01/13 | 549.97 | 592.14 | 699.83 | 387.55 |
| 02/13 | 553.76 | 605.29 | 736.06 | 370.93 |
| 03/13 | 560.66 | 598.93 | 705.36 | 430.10 |
| 04/13 | 571.20 | 590.06 | 663.78 | 441.27 |
| 05/13 | 598.81 | 608.31 | 662.59 | 519.16 |
| 06/13 | 577.25 | 630.51 | 680.52 | 489.10 |
| 07/13 | 664.03 | 685.36 | 703.73 | 592.16 |
| 08/13 | 665.21 | 697.44 | 722.47 | 595.65 |
| 09/13 | 647.06 | 691.84 | 723.16 | 543.60 |
| 10/13 | 592.41 | 655.54 | 713.92 | 483.77 |
| 11/13 | 511.65 | 620.13 | 711.21 | 413.23 |
| 12/13 | 524.69 | 655.42 | 740.65 | 394.48 |
| 01/14 | 561.87 | 651.27 | 735.43 | 452.06 |
| 02/14 | 665.35 | 699.89 | 756.56 | 566.93 |
| 03/14 | 655.67 | 701.90 | 752.47 | 554.81 |
| 04/14 | 647.62 | 704.92 | 747.57 | 550.77 |
| 05/14 | 652.85 | 697.62 | 748.13 | 566.87 |
| 06/14 | 665.50 | 715.93 | 762.22 | 589.57 |
| 07/14 | 629.45 | 690.70 | 730.08 | 558.81 |
| 08/14 | 606.25 | 660.32 | 710.46 | 507.84 |
| 09/14 | 608.92 | 644.03 | 681.65 | 515.00 |
| 10/14 | 551.84 | 594.78 | 621.20 | 497.90 |
| 11/14 | 474.20 | 540.12 | 569.75 | 447.90 |
| 12/14 | 378.11 | 430.68 | 459.36 | 313.77 |
| 01/15 | 304.92 | 359.85 | 377.71 | 232.32 |
| 02/15 | 350.67 | 399.16 | 461.37 | 287.18 |
| 03-15 | 339.32 | 379.25 | 452.57 | 269.44 |
| 04-15 | 394.52 | 422.81 | 471.56 | 313.37 |
| May 4, 2015 | 446.93 | 453.49 | 505.26 | 389.32 |
Sources: NRCan
| Crude Oil Types | Week Ending: 2015-05-08 |
Change From: Previous Week |
Change From: Last Year |
|||
|---|---|---|---|---|---|---|
| $Can/ m3 |
$US/ bbl |
$Can/ m3 |
$US/ bbl |
$Can/ m3 |
$US/ bbl |
|
| Canadian Light | 446.93 | 58.85 | +21.90 | +2.96 | -188.13 | -34.73 |
| WTI | 453.49 | 59.72 | +37.11 | +4.91 | -232.10 | -40.28 |
| Brent | 505.26 | 66.53 | +0.96 | +0.82 | -233.60 | -41.23 |
| WCS | 389.32 | 51.27 | +3.19 | +3.19 | -171.15 | -30.48 |
Source: NRCan
Download the report
Fuel Focus - Printable Version [PDF, 404 KB]
To read Adobe Acrobat® files, you will need to download and install the free Acrobat Reader® software available from Adobe Systems Incorporated.
Page details
- Date modified: