Fuel Focus, May 31, 2013
Table of Contents
- National Overview
- Recent Developments
- Retail Gasoline Overview
- Wholesale Gasoline Prices
- Refining and Marketing Margins
- Crude Oil Overview
- Download the report
National Overview
National Retail Gasoline Prices Up 1.5 Cent per Litre from Last Week
Average Canadian retail gasoline prices for the week ending May 28, 2013 increased by 1.5 cent per litre for the third week in a row to $1.33 per litre compared to the previous week-its highest level since April 2012.
Tight gasoline supply conditions in Western Canada and in the U.S. Midwest contributed to the overall upward pressure on retail pump prices. The rise in wholesale gasoline prices appears to be easing as seen from the decline in some centres compared to two weeks ago. This should work its way through to the retail level as issues are resolved in the supply chain.
Diesel fuel prices increased by 1 cent per litre to $1.25 per litre for the week of May 28, 2013. This is nearly 2 cents per litre higher compared to last year during the same period. Furnace oil prices declined by less than 1 cent per litre from the previous week to $1.16 per litre.
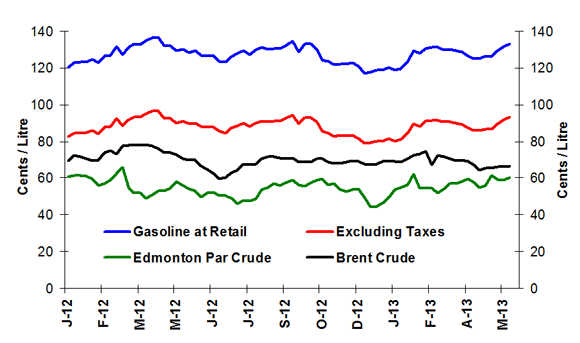
Figure 1: Crude Oil and Regular Gasoline Price Comparison
(National Average)
Text version - Figure 1
The graph shows prices in cents per litre for gasoline at retail, gasoline excluding taxes, and Edmonton Par and Brent crude oil prices. Gasoline prices ended the period of May 28, 2013 at 132.9 cents per litre, excluding taxes at 93.2 cents per litre, Edmonton Par at 60 cents per litre and Brent at 66.9 cents per litre.
| Dates | Gasoline at retail | Excluding Taxes | Edmonton Par crude | Brent crude |
|---|---|---|---|---|
| 03/01/2012 | 120.6 | 82.7 | 60.5 | 69.6 |
| 10/01/2012 | 122.9 | 84.4 | 61.7 | 72.1 |
| 17/01/2012 | 123.0 | 84.4 | 61.8 | 71.8 |
| 24/01/2012 | 123.3 | 84.8 | 61.0 | 70.4 |
| 31/01/2012 | 124.7 | 86.0 | 59.7 | 69.7 |
| 07/02/2012 | 122.7 | 84.2 | 56.1 | 70.2 |
| 14/02/2012 | 126.7 | 87.8 | 57.1 | 73.6 |
| 21/02/2012 | 127.0 | 88.1 | 58.9 | 75.1 |
| 28/02/2012 | 131.7 | 92.4 | 62.6 | 73.4 |
| 06/03/2012 | 127.3 | 88.5 | 65.6 | 77.5 |
| 13/03/2012 | 131.0 | 91.8 | 54.9 | 77.9 |
| 20/03/2012 | 132.8 | 93.4 | 51.6 | 78.2 |
| 27/03/2012 | 132.7 | 93.3 | 51.7 | 78.1 |
| 03/04/2012 | 135.1 | 95.2 | 48.9 | 78.3 |
| 10/04/2012 | 136.4 | 96.4 | 50.8 | 77.5 |
| 17/04/2012 | 136.7 | 96.7 | 52.9 | 76.2 |
| 24/04/2012 | 132.0 | 92.6 | 53.4 | 73.9 |
| 01/05/2012 | 131.9 | 92.4 | 54.4 | 73.9 |
| 08/05/2012 | 129.5 | 90.3 | 58.1 | 73.0 |
| 15/05/2012 | 130.3 | 91.0 | 56.2 | 70.7 |
| 22/05/2012 | 128.5 | 89.4 | 54.2 | 70.2 |
| 29/05/2012 | 129.3 | 90.1 | 53.0 | 69.9 |
| 05/06/2012 | 126.8 | 88.0 | 50.0 | 66.8 |
| 12/06/2012 | 126.7 | 87.9 | 51.9 | 64.7 |
| 19/06/2012 | 126.8 | 87.9 | 52.1 | 62.6 |
| 26/06/2012 | 123.7 | 85.2 | 50.3 | 59.5 |
| 03/07/2012 | 123.1 | 84.5 | 50.3 | 60.0 |
| 10/07/2012 | 126.0 | 87.1 | 48.8 | 63.1 |
| 17/07/2012 | 128.0 | 88.8 | 46.0 | 64.3 |
| 24/07/2012 | 129.2 | 89.9 | 48.0 | 67.7 |
| 31/07/2012 | 127.3 | 88.2 | 47.6 | 67.4 |
| 07/08/2012 | 129.7 | 90.3 | 48.5 | 67.5 |
| 14/08/2012 | 131.0 | 91.2 | 53.6 | 70.3 |
| 21/08/2012 | 130.3 | 90.5 | 55.1 | 71.8 |
| 28/08/2012 | 130.7 | 90.9 | 56.9 | 72.1 |
| 04/09/2012 | 130.9 | 91.1 | 55.9 | 70.8 |
| 11/09/2012 | 132.2 | 92.2 | 57.3 | 70.4 |
| 18/09/2012 | 134.6 | 94.4 | 59.0 | 71.0 |
| 25/09/2012 | 128.9 | 89.4 | 56.7 | 68.6 |
| 02/10/2012 | 132.8 | 92.8 | 55.3 | 69.1 |
| 09/10/2012 | 133.0 | 93.0 | 57.2 | 68.6 |
| 16/10/2012 | 130.1 | 90.4 | 58.7 | 70.3 |
| 23/10/2012 | 124.3 | 85.3 | 59.6 | 70.5 |
| 30/10/2012 | 123.5 | 84.5 | 56.6 | 68.5 |
| 06/11/2012 | 121.6 | 82.7 | 57.0 | 68.3 |
| 13/11/2012 | 122.5 | 83.5 | 53.5 | 68.0 |
| 20/11/2012 | 122.2 | 83.2 | 52.7 | 68.6 |
| 27/11/2012 | 122.6 | 83.5 | 53.8 | 69.7 |
| 04/12/2012 | 120.9 | 81.9 | 54.2 | 69.0 |
| 11/12/2012 | 117.3 | 78.7 | 49.4 | 67.8 |
| 18/12/2012 | 117.7 | 79.5 | 44.1 | 67.1 |
| 25/12/2012 | 119.0 | 80.3 | 44.8 | 67.7 |
| 01/01/2013 | 118.9 | 80.4 | 46.6 | 69.3 |
| 08/01/2013 | 120.6 | 81.9 | 49.4 | 69.5 |
| 15/01/2013 | 118.9 | 80.3 | 53.7 | 69.2 |
| 22/01/2013 | 119.7 | 81.1 | 55.2 | 68.7 |
| 29/01/2013 | 123.3 | 84.3 | 56.6 | 70.7 |
| 05/02/2013 | 129.2 | 89.7 | 61.9 | 72.5 |
| 12/02/2013 | 127.7 | 88.4 | 54.8 | 73.5 |
| 19/02/2013 | 130.5 | 90.9 | 55.3 | 74.6 |
| 26/02/2013 | 131.2 | 91.6 | 54.7 | 67.1 |
| 05/03/2013 | 131.2 | 91.6 | 51.8 | 72.5 |
| 12/03/2013 | 129.9 | 90.4 | 54.2 | 71.8 |
| 19/03/2013 | 130.1 | 90.7 | 56.7 | 70.6 |
| 23/04/2013 | 125.1 | 85.9 | 54.8 | 64.4 |
| 30/04/2013 | 126.3 | 87.0 | 55.8 | 65.5 |
| 07/05/2013 | 126.0 | 86.7 | 61.4 | 65.1 |
| 14/05/2013 | 129.3 | 89.8 | 59.1 | 66.1 |
| 21/05/2013 | 131.4 | 91.8 | 58.8 | 66.1 |
| 28/05/2013 | 132.9 | 93.2 | 60.0 | 66.9 |
Figure 2: Weekly Regular Gasoline Prices

Text version - Figure 2
This graph shows the gasoline price trends from 2011 to 2013.
| 2011 | 2012 | 2013 | |||
|---|---|---|---|---|---|
| Gasoline at Retail | Gasoline at Retail | Gasoline at Retail | |||
| 11-01-04 | 113.30 | 12-01-03 | 120.60 | 13-01-01 | 118.90 |
| 11-01-11 | 113.10 | 12-01-10 | 122.90 | 13-01-08 | 120.60 |
| 11-01-18 | 115.60 | 12-01-17 | 123.00 | 13-01-15 | 118.90 |
| 11-01-25 | 114.90 | 12-01-24 | 123.30 | 13-01-22 | 119.70 |
| 11-02-01 | 113.70 | 12-01-31 | 124.70 | 13-01-29 | 123.30 |
| 11-02-08 | 112.90 | 12-02-07 | 122.70 | 13-02-05 | 129.20 |
| 11-02-15 | 114.60 | 12-02-14 | 126.70 | 13-02-12 | 127.70 |
| 11-02-22 | 115.10 | 12-02-21 | 127.00 | 13-02-19 | 130.50 |
| 11-03-01 | 120.60 | 12-02-28 | 131.70 | 13-02-26 | 131.20 |
| 11-03-08 | 124.50 | 12-03-06 | 127.30 | 13-03-05 | 131.20 |
| 11-03-15 | 123.50 | 12-03-13 | 131.00 | 13-03-12 | 129.90 |
| 11-03-22 | 121.80 | 12-03-20 | 132.80 | 13-03-19 | 130.10 |
| 11-03-29 | 125.40 | 12-03-27 | 132.70 | 13-03-26 | 129.40 |
| 11-04-05 | 127.70 | 12-04-03 | 135.10 | 13-04-02 | 128.70 |
| 11-04-12 | 129.70 | 12-04-10 | 136.40 | 13-04-09 | 126.50 |
| 11-04-19 | 133.40 | 12-04-17 | 136.70 | 13-04-16 | 125.00 |
| 11-04-26 | 133.90 | 12-04-24 | 132.00 | 13-04-23 | 125.10 |
| 11-05-03 | 135.70 | 12-05-01 | 131.90 | 13-04-30 | 126.30 |
| 11-05-10 | 135.40 | 12-05-08 | 129.50 | 13-05-07 | 126.00 |
| 11-05-17 | 130.90 | 12-05-15 | 130.30 | 13-05-14 | 129.30 |
| 11-05-24 | 127.20 | 12-05-22 | 128.50 | 13-05-21 | 131.40 |
| 11-05-31 | 129.90 | 12-05-29 | 129.30 | 13-05-28 | 132.90 |
| 11-06-07 | 127.60 | 12-06-05 | 126.80 | 13-06-04 | |
| 11-06-14 | 127.30 | 12-06-12 | 126.70 | 13-06-11 | |
| 11-06-21 | 126.60 | 12-06-19 | 126.80 | 13-06-18 | |
| 11-06-28 | 124.50 | 12-06-26 | 123.70 | 13-06-25 | |
| 11-07-05 | 125.80 | 12-07-03 | 123.10 | 13-07-02 | |
| 11-07-12 | 127.90 | 12-07-10 | 126.00 | 13-07-09 | |
| 11-07-19 | 128.40 | 12-07-17 | 128.00 | 13-07-16 | |
| 11-07-26 | 128.10 | 12-07-24 | 129.20 | 13-07-23 | |
| 11-08-02 | 128.40 | 12-07-31 | 127.30 | 13-07-30 | |
| 11-08-09 | 125.50 | 12-08-07 | 129.70 | 13-08-06 | |
| 11-08-16 | 126.40 | 12-08-14 | 131.00 | 13-08-13 | |
| 11-08-23 | 126.00 | 12-08-21 | 130.30 | 13-08-20 | |
| 11-08-30 | 128.00 | 12-08-28 | 130.60 | 13-08-27 | |
| 11-09-06 | 128.60 | 12-09-04 | 130.90 | 13-09-03 | |
| 11-09-13 | 127.20 | 12-09-11 | 132.20 | 13-09-10 | |
| 11-09-20 | 124.90 | 12-09-18 | 134.60 | 13-09-17 | |
| 11-09-27 | 123.90 | 12-09-25 | 128.90 | 13-09-24 | |
| 11-10-04 | 123.40 | 12-10-02 | 132.80 | 13-10-01 | |
| 11-10-11 | 125.60 | 12-10-09 | 133.00 | 13-10-08 | |
| 11-10-18 | 126.40 | 12-10-16 | 130.10 | 13-10-15 | |
| 11-10-25 | 124.00 | 12-10-23 | 124.30 | 13-10-22 | |
| 11-11-01 | 121.90 | 12-10-30 | 123.50 | 13-10-29 | |
| 11-11-08 | 124.70 | 12-11-06 | 121.60 | 13-11-05 | |
| 11-11-15 | 123.00 | 12-11-13 | 122.50 | 13-11-12 | |
| 11-11-22 | 120.20 | 12-11-20 | 122.20 | 13-11-19 | |
| 11-11-29 | 119.20 | 12-11-27 | 122.60 | 13-11-26 | |
| 11-12-06 | 120.50 | 12-12-04 | 120.90 | 13-12-03 | |
| 11-12-13 | 118.30 | 12-12-11 | 117.30 | 13-12-10 | |
| 11-12-20 | 116.20 | 12-12-18 | 117.70 | 13-12-17 | |
| 11-12-27 | 119.00 | 12-12-25 | 119.00 | 13-12-24 | |
| 13-12-31 |
| ¢/L | Week of: 2013-05-28 |
Change from: Previous Week |
Change from: Last Year |
|---|---|---|---|
| Gasoline | 132.9 | +1.5 | +3.6 |
| Diesel | 125.4 | +0.9 | +1.5 |
| Furnace Oil | 116.4 | -0.1 | +1.2 |
Source: NRCan
Recent Developments
- Canadians Won’t Pay More at the Pumps This Summer: According to the National Energy Board’s Summer Energy Outlook 2013, Canadians will likely not pay more for gasoline this summer with the national average price expected to be similar to last summer. Seasonally higher demand due to the North American summer driving season, stronger U.S. economic growth, and the potential for escalating geopolitical tensions in supply regions are upside risks for gasoline prices. Slower economic growth in Europe and possibly China, as well as high U.S. inventories of gasoline are downside risks. The Canadian average gasoline price (including taxes) is expected to be between $1.20 and $1.30 per litre this summer, similar to last summer’s average price of $1.27 per litre. (Source: National Energy Board)
- Ultramar Ltd. Becomes Valero Energy Inc.: Effective June 1, 2013, Ultramar Ltd. will become Valero Energy Inc. The Jean Gaulin refinery in Lévis, Quebec, and the company’s wholesale operations, pipelines and terminals, including the Montreal East oil terminal, the largest of its kind in Canada, will remain with Valero’s Canadian operations. The retail sales business, operating under the Ultramar brand, has been transferred to a new independent entity, CST Canada Co., effective May 1, 2013. (Source: Valero Energy Inc. news release)
Retail Gasoline Overview
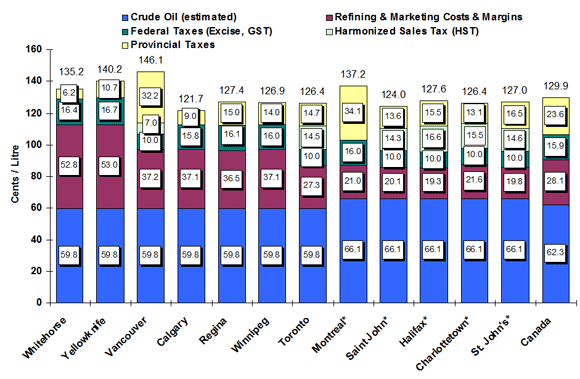
The average Canadian pump price in selected cities for the four-week average ending May 28, 2013, was $1.30 per litre, an increase of 3 cents per litre from the last report on May 17, 2013. This represents less than a 1 cent-per-litre increase compared to the same period in 2012.
The four-week average crude oil price increased by nearly 2 cents per litre to 62 cents per litre compared to two weeks ago.
Retail gasoline prices in most Western centres increased by nearly 7 cents per litre when compared to the previous report, and ranged from $1.22 per litre to $1.46 per litre. Prices in Eastern cities rose by 1 cent per litre, and ranged from $1.24 per litre to $1.37 per litre.
At the national level, refining and marketing costs and margins registered an increase of 1 cent per litre to 28 cents per litre. This represents a decrease of 1 cent per litre compared to the same time last year.
Figure 3: Regular Gasoline Pump Prices in Selected Cities
Four-Week Average (May 7 to 28, 2013)
Text version - Figure 3
This graph shows the gasoline price components for 2 territories and 10 cities plus the national average.
| Whitehorse | Yellowknife | Vancouver | Calgary | Regina | Winnipeg | Toronto | Montreal* | Saint John* | Halifax* | Charlottetown* | St. John's* | Canada | |
|---|---|---|---|---|---|---|---|---|---|---|---|---|---|
| Pump Price | 135.2 | 140.2 | 146.1 | 121.7 | 127.4 | 126.9 | 126.4 | 137.2 | 124.0 | 127.6 | 126.4 | 127.0 | 129.9 |
| Crude (est.) | 59.8 | 59.8 | 59.8 | 59.8 | 59.8 | 59.8 | 59.8 | 66.1 | 66.1 | 66.1 | 66.1 | 66.1 | 62.3 |
| Federal Taxes | 16.4 | 16.7 | 10.0 | 15.8 | 16.1 | 16.0 | 10.0 | 16.0 | 10.0 | 10.0 | 10.0 | 10.0 | 15.9 |
| Provincial Tax | 6.2 | 10.7 | 32.2 | 9.0 | 15.0 | 14.0 | 14.7 | 34.1 | 13.6 | 15.5 | 13.1 | 16.5 | 23.6 |
| HST |
|
|
7.0 |
|
|
|
14.5 |
|
14.3 | 16.6 | 15.5 | 14.6 |
|
| Refining & Marketing Costs & Margins | 52.8 | 53.0 | 37.2 | 37.1 | 36.5 | 37.1 | 27.3 | 21.0 | 20.1 | 19.3 | 21.6 | 19.8 | 28.1 |
Source: NRCan
* Regulated Markets
Sharp Increase in U.S. Midwest Gasoline Prices
According to the U.S. Energy Information’s Administration This Week in Petroleum, gasoline prices throughout the Midwest, also known as Petroleum Administration for Defense District (PADD) 2, have been trending sharply higher since mid-April.
A similar impact has been felt in Western Canada mainly due to refinery shutdowns in Edmonton and the nature of the North American wholesale gasoline market. On May 28, 2013, retail gasoline prices in Calgary and Edmonton rose by 13 cents per litre, respectively, from two weeks ago.
Both planned and unplanned refinery maintenance have limited gasoline production, and inventories, which were robust going into turnaround season, have been significantly depleted. While resupply from the U.S. Gulf Coast (PADD 3) is available via pipeline, transit time to the upper Midwest can take as long as three weeks. At the same time, price increases have spread westward to North Dakota and other parts of the upper Midwest.
Higher gasoline prices in the Midwest largely reflect supply constraints stemming from decreased refinery runs and lower-than-normal gasoline inventories. The combination of lower production from PADD 2 refineries and reduced inventories put upward pressure on prices.
Source: U.S. EIA, excerpt from This Week in Petroleum of May 23, 2013, and NRCan.
Wholesale Gasoline Prices
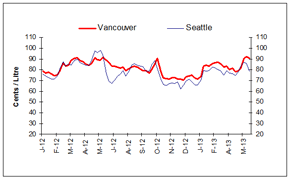
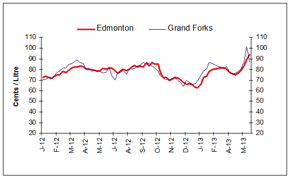
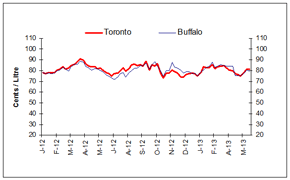
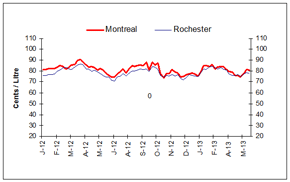
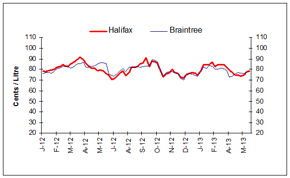
For the week of May 23, 2013, wholesale gasoline prices increased in four of the selected centres, while five centres declined compared to the previous week. Overall, price changes ranged from an increase of 5 cents per litre to a decrease of 14 cents per litre.
Wholesale gasoline prices in Eastern markets in both Canada and the United States, compared to the previous week, registered increases ranging from 1 cent per litre to decreases of 1 cent per litre and ended the period in the range of 78 to 81 cents per litre.
In comparison, Western wholesale gasoline price changes ranged from a drop of 14 cents per litre to an increase of 5 cents per litre and ended in the range of 78 to 94 cents per litre.
The price spike observed in Grand Forks stems from decreased refinery runs in the U.S. Midwest as part of both planned and unplanned refinery maintenance and lower-than-normal gasoline inventories putting upward pressure on prices. Western Canada prices moved up due to supply issues related to the Suncor refinery. The lack of rail cars to bring product back into Western Canada increased the tightness in supply. Higher gasoline prices are felt not only in Alberta, but in British Columbia, Saskatchewan and Manitoba.
Figure 4: Wholesale Gasoline Prices
Rack Terminal Prices for Selected Canadian and American Cities Ending May 23, 2013
(Can ¢/L)
 |
 |
|
 |
 |
|
 |
Text version - Figure 4
This graph shows the trend in wholesale gasoline prices for selected centres in Canada and the U.S.
| DATE | Halifax | Braintree | Montreal | Rochester | Toronto | Buffalo | Edmonton | Grand Forks | Vancouver | Seattle |
|---|---|---|---|---|---|---|---|---|---|---|
| Thu 05-Jan-12 | 78.30 | 75.98 | 81.60 | 75.96 | 78.50 | 78.12 | 72.80 | 70.73 | 78.90 | 76.05 |
| Thu 12-Jan-12 | 78.00 | 76.93 | 81.40 | 76.17 | 77.20 | 76.78 | 73.00 | 70.78 | 77.30 | 74.34 |
| Thu 19-Jan-12 | 79.00 | 77.11 | 82.60 | 76.67 | 78.40 | 77.87 | 72.70 | 71.87 | 77.90 | 72.89 |
| Thu 26-Jan-12 | 79.40 | 76.87 | 82.30 | 76.65 | 78.20 | 76.77 | 71.50 | 72.13 | 75.70 | 70.92 |
| Thu 02-Feb-12 | 80.10 | 78.57 | 82.50 | 77.46 | 78.50 | 77.55 | 73.20 | 74.13 | 75.00 | 71.02 |
| Thu 09-Feb-12 | 81.80 | 80.57 | 83.80 | 80.07 | 80.40 | 79.83 | 74.80 | 77.38 | 75.20 | 73.88 |
| hu 16-Feb-12 | 82.70 | 81.17 | 84.60 | 80.70 | 81.10 | 80.53 | 75.20 | 78.68 | 79.10 | 80.62 |
| Thu 23-Feb-12 | 84.20 | 83.12 | 84.50 | 83.26 | 83.30 | 82.83 | 78.30 | 81.53 | 86.30 | 87.84 |
| Thu 01-Mar-12 | 83.00 | 82.67 | 82.10 | 83.10 | 81.20 | 80.92 | 77.20 | 81.51 | 83.70 | 83.24 |
| Thu 08-Mar-12 | 83.20 | 81.93 | 83.40 | 82.01 | 82.20 | 79.67 | 79.00 | 84.37 | 84.20 | 86.03 |
| Thu 15-Mar-12 | 85.30 | 81.51 | 85.40 | 81.64 | 84.60 | 83.41 | 81.40 | 85.85 | 89.10 | 84.33 |
| Thu 22-Mar-12 | 87.30 | 83.23 | 86.30 | 83.69 | 86.10 | 85.62 | 82.00 | 87.65 | 90.50 | 88.72 |
| Thu 9-Mar-12 | 89.60 | 85.57 | 89.40 | 85.29 | 88.10 | 86.11 | 82.30 | 88.42 | 91.10 | 89.74 |
| Thu 05-Apr-12 | 91.80 | 85.57 | 91.00 | 86.50 | 90.90 | 88.65 | 83.50 | 86.17 | 88.00 | 86.61 |
| Thu 2-Apr-12 | 88.90 | 86.73 | 89.00 | 86.24 | 89.60 | 87.79 | 82.50 | 85.65 | 87.50 | 85.43 |
| Thu 19-Apr-12 | 85.80 | 82.15 | 85.40 | 81.69 | 86.00 | 83.66 | 80.10 | 80.61 | 85.20 | 84.31 |
| Thu 26-Apr-12 | 83.30 | 82.09 | 83.90 | 81.75 | 84.00 | 82.15 | 79.60 | 81.72 | 84.40 | 84.04 |
| Thu 03-May-12 | 81.50 | 82.57 | 84.00 | 79.72 | 83.80 | 80.81 | 79.90 | 78.77 | 86.00 | 88.50 |
| Thu 10-May-12 | 81.20 | 83.82 | 83.10 | 80.79 | 83.80 | 81.50 | 79.40 | 79.14 | 91.40 | 97.78 |
| Thu 17-May-12 | 79.10 | 85.05 | 80.60 | 78.79 | 81.50 | 81.63 | 78.50 | 77.97 | 89.20 | 95.59 |
| Thu 24-May-12 | 79.90 | 85.98 | 82.80 | 78.04 | 82.20 | 80.07 | 78.60 | 78.09 | 89.10 | 97.99 |
| Thu 31-May-12 | 79.30 | 86.07 | 80.90 | 76.24 | 80.80 | 79.07 | 80.80 | 76.64 | 91.60 | 94.29 |
| Thu 07-Jun-12 | 75.90 | 85.72 | 78.70 | 74.45 | 78.40 | 76.04 | 80.50 | 77.57 | 88.60 | 76.45 |
| Thu 14-Jun-12 | 75.00 | 75.71 | 76.30 | 74.07 | 77.10 | 74.98 | 80.80 | 82.24 | 87.00 | 69.43 |
| Thu 21-Jun-12 | 70.90 | 73.99 | 74.20 | 71.22 | 74.80 | 73.12 | 81.40 | 74.20 | 83.60 | 67.29 |
| Thu 28-Jun-12 | 71.10 | 73.37 | 74.30 | 70.57 | 76.80 | 71.79 | 79.20 | 70.40 | 83.30 | 70.25 |
| Thu 05-Jul-12 | 74.00 | 76.84 | 77.10 | 74.49 | 77.70 | 74.13 | 76.50 | 76.50 | 82.30 | 73.89 |
| Thu 12-Jul-12 | 77.00 | 79.06 | 79.90 | 75.64 | 79.70 | 77.17 | 78.90 | 77.33 | 82.00 | 75.98 |
| Thu 19-Jul-12 | 78.70 | 80.51 | 81.90 | 77.65 | 82.80 | 78.00 | 79.80 | 79.34 | 82.50 | 79.29 |
| Thu 26-Jul-12 | 74.10 | 78.00 | 78.20 | 75.33 | 79.30 | 73.91 | 79.50 | 75.41 | 79.70 | 74.08 |
| Thu 02-Aug-12 | 77.50 | 81.71 | 81.50 | 77.89 | 81.70 | 78.15 | 79.90 | 80.06 | 81.00 | 78.57 |
| Thu 09-Aug-12 | 81.80 | 82.28 | 85.00 | 80.00 | 85.20 | 80.22 | 81.90 | 80.55 | 82.50 | 84.38 |
| Thu 16-Aug-12 | 82.10 | 82.18 | 84.50 | 80.04 | 85.60 | 82.22 | 83.80 | 81.19 | 83.80 | 86.04 |
| Thu 23-Aug-12 | 82.50 | 82.70 | 85.10 | 80.56 | 84.90 | 82.09 | 82.40 | 83.57 | 82.50 | 83.89 |
| Thu 30-Aug-12 | 85.60 | 82.23 | 85.50 | 81.71 | 85.20 | 84.70 | 83.10 | 83.91 | 80.50 | 83.35 |
| Thu 06-Sep-12 | 86.00 | 82.67 | 84.60 | 81.65 | 84.30 | 84.61 | 82.40 | 86.24 | 79.70 | 83.15 |
| Thu 13-Sep-12 | 90.80 | 83.28 | 88.60 | 81.81 | 88.60 | 87.08 | 86.50 | 85.28 | 79.50 | 78.61 |
| Thu 20-Sep-12 | 82.80 | 84.03 | 80.80 | 79.82 | 80.50 | 81.33 | 83.60 | 85.93 | 77.30 | 79.04 |
| Thu 27-Sep-12 | 87.70 | 84.38 | 88.40 | 84.06 | 85.30 | 85.30 | 86.30 | 83.65 | 80.70 | 85.58 |
| Thu 04-Oct-12 | 87.30 | 84.45 | 85.40 |
83.55 | 84.20 | 88.22 | 85.00 |
81.73 | 85.90 | 88.43 |
| Thu 11-Oct-12 | 86.00 |
84.10 | 87.00 |
81.16 | 86.50 | 83.98 | 85.40 |
78.69 | 90.60 | 81.35 |
| Thu 18-Oct-12 | 77.80 | 84.33 | 77.70 | 76.05 | 77.20 | 79.28 | 76.60 | 73.80 | 78.50 | 71.33 |
| Thu 25-Oct-12 | 73.00 | 85.48 | 73.80 | 74.24 | 72.70 | 74.59 | 72.10 | 71.37 | 72.10 | 66.33 |
| Thu 01-Nov-12 | 76.30 | 85.75 | 78.10 | 76.16 | 77.40 | 79.83 | 72.60 | 71.19 | 71.60 | 65.42 |
| Thu 08-Nov-12 | 76.80 | 85.86 | 77.60 | 75.63 | 77.40 | 79.93 | 69.90 | 70.30 | 71.10 | 67.09 |
| Thu 15-Nov-12 | 80.10 | 78.06 | 81.20 | 76.45 | 80.60 | 87.66 | 70.90 | 71.58 | 72.80 | 67.68 |
| Thu 22-Nov-12 | 77.20 | 76.48 | 79.20 | 75.80 | 78.90 | 83.00 | 72.50 | 71.84 | 72.80 | 67.14 |
| Thu 29-Nov-12 | 76.70 | 76.01 | 78.30 | 76.51 | 77.50 | 82.63 | 72.10 | 70.37 | 71.30 | 68.68 |
| Thu 06-Dec-12 | 73.10 | 71.08 | 74.60 | 73.05 | 74.40 | 80.37 | 70.10 | 67.40 | 71.40 | 62.39 |
| Thu 13-Dec-12 | 72.10 | 70.22 | 74.90 | 71.94 | 73.90 | 77.52 | 67.70 | 64.43 | 70.50 | 65.70 |
| Thu 20-Dec-12 | 75.40 | 74.02 | 76.90 | 74.59 | 76.40 | 79.11 | 66.10 | 68.86 | 73.30 | 69.53 |
| Thu 27-Dec-12 | 75.80 | 76.29 | 77.10 | 76.52 | 76.80 | 78.58 | 66.70 | 67.97 | 74.00 | 71.30 |
| Thu 03-Jan-13 | 77.50 | 75.42 | 78.60 | 75.82 | 77.50 | 77.31 | 65.40 | 66.07 | 75.50 | 68.79 |
| Thu 10-Jan-13 | 76.70 | 74.48 | 77.40 | 75.49 | 76.90 | 77.88 | 63.40 | 66.67 | 72.40 | 65.77 |
| Thu 17-Jan-13 | 74.80 | 73.73 | 75.40 | 74.81 | 75.00 | 74.96 | 62.40 | 69.13 | 70.90 | 65.72 |
| Thu 13-Dec-12 | 72.10 | 70.22 | 74.90 | 71.94 | 73.90 | 77.52 | 67.70 | 64.43 | 70.50 | 65.70 |
| Thu 24-Jan-13 | 79.00 | 78.00 | 79.00 | 78.15 | 78.30 | 78.93 | 66.80 | 75.06 | 73.50 | 70.59 |
| Thu 31-Jan-13 | 84.10 | 81.70 | 84.70 | 81.81 | 83.50 | 80.51 | 72.50 | 78.85 | 83.40 | 79.19 |
| Thu 07-Feb-13 | 84.60 | 80.98 | 85.10 | 81.47 | 83.20 | 83.16 | 73.10 | 80.16 | 84.00 | 78.87 |
| Thu 14-Feb-13 | 84.50 | 83.61 | 84.20 | 84.35 | 83.20 | 83.55 | 78.10 | 86.03 | 83.30 | 79.18 |
| Thu 21-Feb-13 | 86.70 | 83.01 | 85.90 | 84.51 | 85.40 | 87.44 | 79.70 | 85.90 | 86.00 | 82.60 |
| Thu 28-Feb-13 | 82.80 | 80.41 | 81.90 | 83.34 | 81.90 | 83.14 | 80.50 | 83.70 | 86.20 | 81.99 |
| Thu 07-Mar-13 | 84.10 | 80.00 | 83.60 | 82.22 | 83.30 | 84.09 | 81.00 | 82.56 | 86.90 | 80.15 |
| Thu 14-Mar-13 | 84.60 | 81.52 | 84.00 | 83.10 | 83.90 | 85.12 | 81.70 | 82.24 | 85.40 | 78.61 |
| Thu 21-Mar-13 | 84.10 | 80.55 | 84.50 | 81.59 | 84.80 | 84.95 | 81.80 | 81.66 | 82.10 | 75.28 |
| Thu 28-Mar-13 | 82.00 | 79.08 | 81.50 | 80.79 | 82.60 | 84.24 | 80.20 | 82.51 | 83.80 | 79.62 |
| Thu 04-Apr-13 | 79.40 | 73.32 | 79.50 | 77.54 | 80.60 | 84.10 | 77.40 | 78.17 | 80.20 | 77.14 |
| Thu 11-Apr-13 | 77.30 | 73.36 | 78.90 | 75.92 | 79.80 | 83.84 | 75.90 | 75.52 | 81.50 | 76.23 |
| Thu 18-Apr-13 | 74.70 | 75.92 | 76.30 | 76.28 | 77.10 | 75.04 | 74.90 | 76.41 | 78.50 | 74.77 |
| Thu 25-Apr-13 | 74.80 | 77.01 | 75.90 | 76.42 | 76.70 | 75.40 | 76.80 | 78.08 | 79.00 | 77.56 |
| Thu 02-May-13 | 73.50 | 76.65 | 74.50 | 75.00 | 75.00 | 75.38 | 78.80 | 79.70 | 82.00 | 83.51 |
| Thu 09-May-13 | 75.10 | 76.22 | 77.60 | 77.03 | 78.50 | 77.88 | 83.90 | 87.57 | 90.80 | 87.15 |
| Thu 16-May-13 | 78.10 | 77.25 | 81.50 | 78.21 | 80.90 | 80.54 | 89.30 | 101.10 | 92.50 | 85.64 |
| Thu 23-May-13 | 78.60 | 78.37 | 80.50 | 78.09 | 81.30 | 79.53 | 94.20 | 86.80 | 90.30 | 78.24 |
Sources: NRCan, Bloomberg Oil Buyers Guide
Gasoline Refining and Marketing Margins
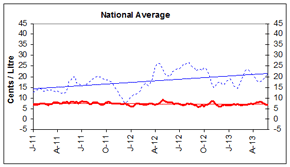
Four-week rolling averages are used for gasoline refining and marketing margins.
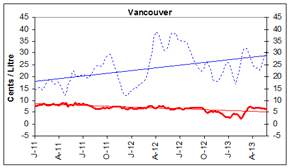
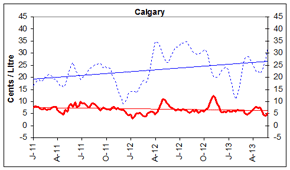
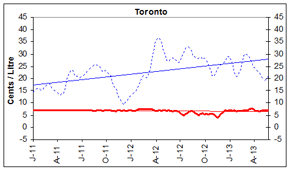
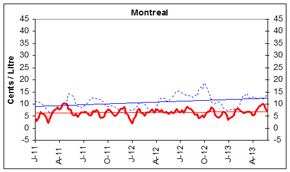
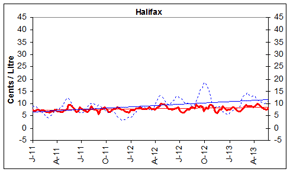
Refining margins for gasoline have fluctuated upward in the last five weeks. This is indicative of tightness in supply to meet the expected demand. These margins are the difference between the cost of the crude oil and the wholesale price at which a refiner can sell gasoline. The increase in wholesale gasoline prices was larger than the increase in crude oil prices, which pushed refining margins up nationally, particularly in Western centres.
Nationally, marketing margins fluctuated at 7 cents per litre. This margin can be fairly volatile as outlets compete for market share.
Although it represents a small portion of the total pump price, the marketing margin can vary significantly from city to city and region to region depending on the local market conditions in each area.
Figure 5: Gasoline Refining and Marketing Margins
Four-Week Rolling Average Ending May 28, 2013
_________ Refining Margin _______ Marketing Margin
 |
 |
|
 |
 |
|
 |
 |
Text version - Figure 5
These graphs show the trend in refining and marketing costs and margins for selected centres in Canada and the national average.
| 4-week rolling average | Canada | Vancouver | Calgary | Toronto | Montreal | Halifax | ||||||
|---|---|---|---|---|---|---|---|---|---|---|---|---|
| Marketing Margin | Refining Margin | Marketing Margin | Refining Margin | Marketing Margin | Refining Margin | Marketing Margin | Refining Margin | Marketing Margin | Refining Margin | Marketing Margin | Refining Margin | |
| 2011-01-04 | 6.8 | 12.7 | 8.0 | 14.4 | 7.5 | 16.6 | 7.1 | 14.4 | 4.1 | 11.0 | 7.4 | 9.0 |
| 2011-01-11 | 6.8 | 13.2 | 7.6 | 14.8 | 8.1 | 17.5 | 7.0 | 15.4 | 2.9 | 11.1 | 6.9 | 8.8 |
| 2011-01-18 | 6.6 | 13.7 | 7.9 | 15.1 | 7.7 | 18.7 | 7.1 | 16.0 | 4.3 | 11.1 | 7.2 | 8.7 |
| 2011-01-25 | 6.9 | 14.1 | 8.2 | 15.6 | 7.8 | 19.2 | 7.0 | 16.1 | 6.7 | 10.3 | 7.7 | 7.9 |
| 2011-02-01 | 7.6 | 14.0 | 8.3 | 14.5 | 6.9 | 18.2 | 7.0 | 15.0 | 6.0 | 9.7 | 7.1 | 7.2 |
| 2011-02-08 | 7.3 | 13.1 | 8.6 | 15.1 | 6.9 | 18.7 | 7.0 | 15.3 | 5.9 | 9.0 | 7.3 | 6.4 |
| 2011-02-15 | 7.4 | 13.1 | 8.3 | 17.0 | 7.1 | 19.9 | 7.0 | 16.7 | 4.5 | 8.2 | 7.2 | 5.9 |
| 2011-02-22 | 7.2 | 13.6 | 7.9 | 17.7 | 6.7 | 20.1 | 7.0 | 17.2 | 2.1 | 7.2 | 6.6 | 4.9 |
| 2011-03-01 | 6.5 | 13.5 | 8.1 | 18.9 | 6.8 | 21.3 | 7.0 | 18.3 | 4.1 | 6.3 | 6.7 | 4.3 |
| 2011-03-08 | 6.9 | 13.8 | 8.3 | 18.3 | 6.8 | 21.2 | 7.0 | 17.8 | 5.9 | 6.8 | 6.4 | 4.9 |
| 2011-03-15 | 7.2 | 13.8 | 8.6 | 17.3 | 7.6 | 20.4 | 7.0 | 16.1 | 7.7 | 6.9 | 6.9 | 5.3 |
| 2011-03-22 | 7.7 | 13.1 | 8.4 | 17.0 | 7.8 | 19.3 | 7.0 | 15.0 | 7.6 | 7.7 | 7.0 | 6.4 |
| 2011-03-29 | 7.7 | 12.8 | 8.3 | 17.9 | 7.7 | 19.2 | 7.0 | 14.8 | 8.4 | 8.7 | 7.5 | 7.5 |
| 2011-04-05 | 7.8 | 13.2 | 8.1 | 17.4 | 6.1 | 18.2 | 7.0 | 14.2 | 7.8 | 8.8 | 7.0 | 7.9 |
| 2011-04-12 | 7.4 | 12.8 | 8.5 | 15.5 | 5.7 | 16.7 | 7.1 | 12.8 | 8.1 | 8.9 | 6.9 | 8.0 |
| 2011-04-19 | 7.4 | 11.9 | 8.9 | 14.4 | 4.9 | 17.0 | 7.1 | 13.9 | 10.4 | 9.6 | 6.6 | 8.8 |
| 2011-04-26 | 7.7 | 12.6 | 8.6 | 12.2 | 4.6 | 15.9 | 7.1 | 13.9 | 10.2 | 10.1 | 6.6 | 9.2 |
| 2011-05-03 | 7.6 | 12.5 | 8.9 | 12.9 | 6.6 | 17.0 | 7.0 | 16.0 | 10.1 | 11.6 | 7.2 | 10.9 |
| 2011-05-10 | 8.0 | 14.2 | 7.5 | 16.6 | 5.8 | 20.5 | 7.0 | 20.5 | 7.8 | 14.2 | 7.6 | 12.5 |
| 2011-05-17 | 7.3 | 17.8 | 8.3 | 18.3 | 8.1 | 22.1 | 7.0 | 21.4 | 7.7 | 14.1 | 9.3 | 12.2 |
| 2011-05-24 | 8.0 | 18.5 | 8.3 | 21.5 | 9.1 | 25.0 | 6.9 | 23.3 | 5.8 | 13.4 | 9.5 | 10.9 |
| 2011-05-31 | 7.9 | 19.7 | 8.1 | 22.6 | 7.8 | 26.1 | 7.0 | 23.5 | 5.3 | 12.3 | 8.5 | 9.2 |
| 2011-06-07 | 7.6 | 19.7 | 9.3 | 20.3 | 9.6 | 23.1 | 7.0 | 21.0 | 5.8 | 9.6 | 8.2 | 6.9 |
| 2011-06-14 | 8.3 | 17.0 | 8.4 | 20.3 | 7.8 | 22.3 | 7.0 | 20.9 | 4.6 | 9.0 | 6.8 | 6.3 |
| 2011-06-21 | 7.5 | 16.5 | 8.6 | 20.3 | 8.2 | 20.9 | 7.1 | 20.7 | 5.9 | 9.4 | 7.0 | 7.0 |
| 2011-06-28 | 7.8 | 16.3 | 8.3 | 20.5 | 9.9 | 19.0 | 7.0 | 20.3 | 6.6 | 8.5 | 8.4 | 6.3 |
| 2011-07-05 | 8.4 | 15.5 | 8.5 | 20.8 | 9.4 | 19.6 | 7.1 | 21.0 | 6.7 | 8.7 | 7.9 | 6.1 |
| 2011-07-12 | 8.2 | 15.9 | 8.3 | 20.6 | 9.5 | 20.2 | 7.1 | 21.6 | 6.8 | 9.7 | 7.2 | 6.7 |
| 2011-07-19 | 8.1 | 16.4 | 8.2 | 19.8 | 8.8 | 21.0 | 7.0 | 22.2 | 6.1 | 10.3 | 6.9 | 7.3 |
| 2011-07-26 | 7.6 | 16.9 | 8.1 | 19.7 | 7.7 | 22.5 | 7.1 | 23.0 | 5.3 | 11.4 | 6.7 | 8.5 |
| 2011-08-02 | 7.2 | 17.8 | 7.7 | 20.5 | 7.7 | 23.9 | 6.9 | 24.1 | 5.4 | 12.7 | 7.2 | 10.1 |
| 2011-08-09 | 7.1 | 18.9 | 7.5 | 22.0 | 9.3 | 24.1 | 6.9 | 24.5 | 7.1 | 12.4 | 9.2 | 10.0 |
| 2011-08-16 | 7.8 | 19.1 | 6.8 | 23.4 | 9.4 | 24.4 | 6.8 | 25.3 | 7.3 | 12.5 | 7.9 | 10.0 |
| 2011-08-23 | 7.8 | 19.6 | 6.5 | 24.5 | 8.7 | 25.5 | 6.8 | 25.8 | 7.6 | 12.3 | 7.6 | 9.7 |
| 2011-08-30 | 7.7 | 20.1 | 6.6 | 24.8 | 8.3 | 25.3 | 6.9 | 25.2 | 6.6 | 11.9 | 7.2 | 9.1 |
| 2011-09-06 | 7.5 | 19.7 | 6.5 | 24.6 | 6.4 | 25.8 | 6.9 | 25.2 | 4.4 | 12.0 | 5.8 | 9.4 |
| 2011-09-13 | 6.7 | 19.9 | 6.8 | 24.4 | 6.2 | 25.5 | 7.0 | 24.0 | 4.4 | 11.2 | 7.8 | 8.9 |
| 2011-09-20 | 6.8 | 19.2 | 7.2 | 25.1 | 7.5 | 24.1 | 6.9 | 22.7 | 4.7 | 10.5 | 8.1 | 8.3 |
| 2011-09-27 | 7.3 | 18.2 | 6.8 | 27.8 | 7.2 | 24.7 | 6.9 | 23.4 | 6.5 | 9.4 | 8.5 | 7.4 |
| 2011-10-04 | 7.6 | 18.4 | 7.0 | 29.0 | 6.9 | 24.2 | 6.9 | 22.7 | 7.8 | 9.0 | 8.2 | 6.7 |
| 2011-10-11 | 8.0 | 17.9 | 6.7 | 29.5 | 6.8 | 24.0 | 6.9 | 21.9 | 7.4 | 8.9 | 6.6 | 6.5 |
| 2011-10-18 | 7.7 | 17.6 | 7.0 | 29.0 | 6.7 | 23.5 | 6.9 | 21.5 | 6.8 | 9.3 | 6.5 | 6.9 |
| 2011-10-25 | 7.5 | 17.4 | 7.2 | 26.5 | 7.4 | 21.1 | 6.8 | 18.6 | 5.6 | 9.1 | 7.1 | 7.0 |
| 2011-11-01 | 7.4 | 15.7 | 7.3 | 23.8 | 7.7 | 19.0 | 6.8 | 16.6 | 4.9 | 8.6 | 7.7 | 6.4 |
| 2011-11-08 | 7.4 | 14.2 | 7.2 | 22.4 | 7.0 | 17.8 | 6.4 | 15.8 | 5.6 | 8.3 | 7.9 | 6.0 |
| 2011-11-15 | 7.3 | 13.4 | 7.5 | 19.5 | 7.2 | 15.0 | 7.0 | 13.1 | 7.2 | 7.1 | 8.4 | 4.8 |
| 2011-11-22 | 7.4 | 11.2 | 7.4 | 16.7 | 6.9 | 12.8 | 6.9 | 11.8 | 8.2 | 6.5 | 8.3 | 3.8 |
| 2011-11-29 | 7.0 | 10.1 | 6.6 | 14.6 | 6.6 | 10.7 | 6.8 | 10.6 | 8.2 | 6.3 | 7.6 | 3.4 |
| 2011-12-06 | 7.1 | 8.9 | 6.9 | 12.3 | 6.7 | 9.2 | 7.2 | 9.3 | 8.8 | 6.1 | 7.5 | 3.3 |
| 2011-12-13 | 7.3 | 7.6 | 6.2 | 12.2 | 6.0 | 10.1 | 6.6 | 10.3 | 6.7 | 6.7 | 6.8 | 3.7 |
| 2011-12-20 | 6.8 | 8.0 | 6.2 | 12.4 | 4.6 | 11.5 | 6.8 | 11.0 | 5.3 | 6.7 | 6.7 | 4.0 |
| 2011-12-27 | 6.4 | 9.1 | 6.8 | 14.0 | 4.3 | 13.5 | 7.0 | 12.6 | 3.7 | 7.3 | 6.5 | 4.8 |
| 2012-01-03 | 6.1 | 10.4 | 6.9 | 14.1 | 4.6 | 13.9 | 6.9 | 13.0 | 1.9 | 7.1 | 7.3 | 4.4 |
| 2012-01-10 | 6.1 | 11.3 | 6.4 | 14.9 | 3.0 | 14.2 | 6.7 | 13.8 | 3.7 | 7.5 | 7.1 | 5.0 |
| 2012-01-17 | 6.5 | 11.8 | 6.4 | 15.4 | 4.0 | 14.1 | 6.9 | 14.5 | 5.1 | 8.7 | 7.2 | 6.0 |
| 2012-01-24 | 7.3 | 11.5 | 6.3 | 15.1 | 5.0 | 13.6 | 7.0 | 14.9 | 7.5 | 9.1 | 8.3 | 6.5 |
| 2012-01-31 | 7.6 | 12.3 | 6.7 | 16.6 | 5.0 | 15.0 | 7.4 | 17.3 | 8.0 | 10.6 | 8.2 | 8.1 |
| 2012-02-07 | 7.2 | 13.6 | 6.8 | 16.6 | 5.2 | 16.5 | 7.4 | 18.9 | 6.2 | 10.6 | 8.4 | 8.2 |
| 2012-02-14 | 7.0 | 15.2 | 6.8 | 17.4 | 4.8 | 17.9 | 7.3 | 20.8 | 6.1 | 10.3 | 7.8 | 8.4 |
| 2012-02-21 | 6.6 | 16.2 | 6.9 | 18.5 | 3.9 | 18.6 | 7.5 | 21.4 | 5.1 | 10.1 | 7.9 | 8.7 |
| 2012-02-28 | 6.8 | 16.9 | 6.8 | 19.3 | 3.9 | 17.7 | 7.3 | 20.3 | 6.5 | 8.8 | 8.0 | 8.2 |
| 2012-03-06 | 7.1 | 15.4 | 7.2 | 22.2 | 4.9 | 18.9 | 7.3 | 21.6 | 6.7 | 7.7 | 8.1 | 7.9 |
| 2012-03-13 | 7.3 | 16.2 | 7.5 | 26.6 | 5.6 | 22.4 | 7.4 | 23.8 | 6.9 | 6.9 | 8.4 | 7.6 |
| 2012-03-20 | 7.5 | 18.1 | 7.5 | 31.2 | 6.0 | 26.7 | 7.2 | 27.6 | 7.8 | 6.4 | 8.0 | 7.3 |
| 2012-03-27 | 6.9 | 20.1 | 7.1 | 36.2 | 5.6 | 31.9 | 6.9 | 32.5 | 6.3 | 6.9 | 8.0 | 7.7 |
| 2012-04-03 | 6.8 | 24.3 | 6.8 | 39.0 | 4.8 | 34.7 | 6.7 | 35.3 | 7.8 | 8.7 | 7.6 | 9.6 |
| 2012-04-10 | 7.1 | 25.8 | 7.1 | 38.3 | 5.8 | 34.4 | 6.8 | 36.2 | 7.4 | 10.4 | 8.4 | 11.4 |
| 2012-04-17 | 7.5 | 26.2 | 7.5 | 37.4 | 7.2 | 33.9 | 7.0 | 36.6 | 6.9 | 12.1 | 8.8 | 13.1 |
| 2012-04-24 | 8.0 | 25.7 | 7.4 | 34.4 | 9.0 | 31.8 | 6.7 | 34.9 | 7.6 | 12.4 | 10.0 | 13.3 |
| 2012-05-01 | 9.3 | 23.3 | 7.8 | 31.6 | 11.0 | 28.9 | 7.0 | 32.0 | 6.5 | 12.6 | 9.8 | 12.6 |
| 2012-05-08 | 8.7 | 21.7 | 7.2 | 31.0 | 10.5 | 27.3 | 6.9 | 29.5 | 6.6 | 12.0 | 9.8 | 11.3 |
| 2012-05-15 | 8.4 | 20.7 | 6.8 | 32.0 | 9.7 | 26.3 | 6.6 | 27.5 | 6.8 | 11.2 | 9.2 | 10.1 |
| 2012-05-22 | 8.0 | 20.6 | 7.0 | 33.2 | 8.6 | 26.3 | 7.0 | 27.0 | 5.9 | 11.4 | 7.8 | 9.7 |
| 2012-05-29 | 8.1 | 20.5 | 6.2 | 37.0 | 7.4 | 28.4 | 6.8 | 28.0 | 7.0 | 12.0 | 7.8 | 10.1 |
| 2012-06-05 | 8.0 | 21.8 | 6.1 | 38.6 | 7.1 | 30.0 | 6.5 | 28.5 | 6.3 | 13.2 | 7.6 | 10.9 |
| 2012-06-12 | 7.5 | 22.8 | 6.2 | 37.9 | 7.0 | 30.9 | 6.7 | 27.8 | 6.2 | 14.0 | 7.9 | 11.5 |
| 2012-06-19 | 7.8 | 23.3 | 6.7 | 38.0 | 6.3 | 32.5 | 6.7 | 27.5 | 8.0 | 15.3 | 8.3 | 12.9 |
| 2012-06-26 | 7.6 | 23.7 | 6.8 | 35.7 | 6.8 | 32.5 | 6.6 | 26.5 | 6.9 | 15.2 | 8.4 | 12.9 |
| 2012-07-03 | 7.3 | 23.7 | 7.0 | 34.9 | 6.5 | 33.0 | 6.1 | 27.0 | 6.6 | 14.8 | 7.3 | 12.1 |
| 2012-07-10 | 7.0 | 24.5 | 6.6 | 35.3 | 6.3 | 34.4 | 5.3 | 29.0 | 7.4 | 14.7 | 6.4 | 11.8 |
| 2012-07-17 | 6.6 | 25.8 | 5.9 | 34.9 | 7.0 | 34.0 | 4.9 | 30.9 | 6.3 | 14.0 | 6.2 | 10.7 |
| 2012-07-24 | 7.1 | 25.9 | 6.7 | 35.0 | 6.6 | 34.6 | 5.4 | 32.5 | 7.7 | 13.6 | 6.9 | 10.3 |
| 2012-07-31 | 7.6 | 26.1 | 6.6 | 34.3 | 6.2 | 34.6 | 5.8 | 33.3 | 9.0 | 13.4 | 7.5 | 10.4 |
| 2012-08-07 | 7.5 | 26.6 | 6.8 | 32.0 | 5.3 | 33.2 | 6.3 | 32.7 | 8.1 | 13.5 | 7.6 | 9.9 |
| 2012-08-14 | 7.6 | 25.4 | 7.1 | 30.2 | 5.5 | 32.4 | 6.7 | 31.2 | 8.2 | 13.0 | 8.4 | 9.3 |
| 2012-08-21 | 7.2 | 24.5 | 7.1 | 27.9 | 6.1 | 30.7 | 6.3 | 29.3 | 6.9 | 12.8 | 8.4 | 8.8 |
| 2012-08-28 | 6.5 | 23.9 | 7.1 | 26.4 | 6.0 | 30.0 | 5.8 | 28.8 | 5.8 | 13.6 | 8.2 | 9.9 |
| 2012-09-04 | 6.5 | 22.7 | 7.1 | 25.2 | 6.5 | 29.7 | 5.5 | 27.9 | 6.1 | 13.4 | 9.6 | 10.9 |
| 2012-09-11 | 5.6 | 23.3 | 7.0 | 23.6 | 5.3 | 29.3 | 4.8 | 28.3 | 4.2 | 15.9 | 8.4 | 13.5 |
| 2012-09-18 | 6.1 | 23.3 | 7.2 | 22.8 | 5.9 | 30.1 | 5.4 | 28.8 | 4.8 | 17.3 | 9.0 | 15.8 |
| 2012-09-25 | 6.5 | 22.9 | 7.0 | 22.3 | 6.2 | 30.4 | 5.7 | 27.6 | 5.4 | 16.4 | 8.8 | 16.4 |
| 2012-10-02 | 5.9 | 24.2 | 6.3 | 23.3 | 6.0 | 31.2 | 5.3 | 28.3 | 4.3 | 18.7 | 7.0 | 18.5 |
| 2012-10-09 | 6.6 | 23.8 | 5.7 | 25.6 | 6.9 | 31.1 | 5.4 | 27.5 | 6.1 | 17.4 | 8.4 | 17.9 |
| 2012-10-16 | 6.7 | 22.9 | 4.7 | 26.6 | 7.3 | 29.3 | 5.2 | 26.3 | 6.8 | 15.7 | 8.0 | 16.6 |
| 2012-10-23 | 7.5 | 20.4 | 5.1 | 24.4 | 9.1 | 25.9 | 5.5 | 23.7 | 7.2 | 14.0 | 9.3 | 14.3 |
| 2012-10-30 | 8.5 | 17.2 | 5.5 | 21.6 | 11.4 | 22.0 | 5.5 | 20.9 | 8.6 | 10.3 | 9.3 | 10.3 |
| 2012-11-06 | 8.3 | 14.8 | 5.1 | 18.7 | 12.4 | 20.3 | 5.1 | 20.8 | 7.9 | 9.6 | 8.5 | 8.6 |
| 2012-11-13 | 7.3 | 15.1 | 5.4 | 17.2 | 11.5 | 19.3 | 4.6 | 21.7 | 5.2 | 10.4 | 6.7 | 8.7 |
| 2012-11-20 | 6.3 | 16.8 | 5.1 | 18.2 | 9.4 | 20.0 | 4.1 | 24.4 | 4.7 | 10.8 | 6.1 | 8.9 |
| 2012-11-27 | 6.0 | 17.2 | 5.0 | 18.7 | 7.3 | 21.2 | 4.9 | 25.5 | 4.4 | 10.8 | 7.4 | 8.9 |
| 2012-12-04 | 6.2 | 17.2 | 4.8 | 20.1 | 5.8 | 21.8 | 5.8 | 25.7 | 5.5 | 9.9 | 7.5 | 8.6 |
| 2012-12-11 | 6.5 | 16.3 | 4.3 | 19.3 | 5.5 | 21.0 | 6.1 | 24.0 | 6.9 | 7.9 | 9.1 | 6.3 |
| 2012-12-18 | 6.7 | 16.6 | 3.6 | 23.2 | 5.8 | 24.0 | 7.1 | 27.1 | 6.5 | 7.8 | 8.0 | 6.0 |
| 2012-12-25 | 6.4 | 17.7 | 3.0 | 25.6 | 5.8 | 24.4 | 6.8 | 28.8 | 5.4 | 7.5 | 7.4 | 5.8 |
| 2013-01-01 | 6.2 | 18.6 | 2.8 | 25.9 | 6.1 | 23.1 | 7.1 | 28.9 | 3.6 | 7.3 | 7.7 | 5.6 |
| 2013-01-08 | 6.4 | 19.0 | 2.7 | 24.5 | 6.0 | 19.8 | 7.1 | 27.6 | 4.4 | 8.0 | 7.5 | 6.6 |
| 2013-01-15 | 6.5 | 17.5 | 3.5 | 22.2 | 5.9 | 16.3 | 6.8 | 25.5 | 4.6 | 8.2 | 8.5 | 7.2 |
| 2013-01-22 | 6.9 | 15.6 | 4.4 | 20.2 | 6.3 | 14.3 | 7.0 | 23.9 | 5.5 | 8.3 | 8.5 | 7.6 |
| 2013-01-29 | 6.9 | 15.0 | 4.2 | 16.8 | 5.8 | 11.0 | 6.5 | 20.7 | 7.7 | 8.4 | 7.6 | 7.9 |
| 2013-02-05 | 7.0 | 14.6 | 4.2 | 18.2 | 6.4 | 12.3 | 6.8 | 21.1 | 8.1 | 9.5 | 7.1 | 9.2 |
| 2013-02-12 | 6.8 | 16.2 | 3.4 | 22.2 | 6.4 | 16.1 | 6.9 | 23.6 | 7.8 | 9.4 | 7.1 | 9.1 |
| 2013-02-19 | 6.4 | 18.5 | 2.4 | 25.6 | 6.2 | 19.9 | 6.8 | 25.7 | 7.0 | 11.0 | 7.4 | 10.8 |
| 2013-02-26 | 6.6 | 20.8 | 3.4 | 31.1 | 6.3 | 26.0 | 7.0 | 30.0 | 6.3 | 13.7 | 8.6 | 13.6 |
| 2013-03-05 | 6.7 | 22.7 | 4.7 | 32.0 | 5.2 | 27.8 | 7.0 | 30.1 | 6.7 | 13.9 | 9.3 | 14.0 |
| 2013-03-12 | 6.8 | 23.3 | 5.8 | 32.1 | 4.7 | 28.9 | 7.1 | 29.7 | 6.8 | 14.3 | 9.0 | 14.6 |
| 2013-03-19 | 7.2 | 23.1 | 7.0 | 31.5 | 5.1 | 29.1 | 7.4 | 29.4 | 6.8 | 12.3 | 9.1 | 12.8 |
| 2013-03-26 | 7.5 | 21.7 | 7.3 | 27.8 | 6.0 | 26.5 | 7.8 | 26.4 | 6.7 | 12.3 | 9.0 | 12.9 |
| 2013-04-02 | 7.1 | 20.9 | 6.9 | 26.5 | 6.4 | 25.8 | 7.5 | 25.6 | 5.2 | 12.6 | 8.4 | 12.9 |
| 2013-04-09 | 7.3 | 19.4 | 6.8 | 24.2 | 7.4 | 23.6 | 6.8 | 24.1 | 5.7 | 13.2 | 9.2 | 12.6 |
| 2013-04-16 | 7.8 | 17.9 | 6.9 | 22.7 | 7.7 | 21.6 | 6.7 | 22.2 | 7.2 | 11.6 | 10.1 | 10.5 |
| 2013-04-23 | 7.9 | 17.6 | 7.0 | 23.6 | 7.3 | 22.4 | 6.6 | 22.5 | 8.4 | 12.6 | 9.5 | 11.1 |
| 2013-04-30 | 8.2 | 17.6 | 7.2 | 24.1 | 7.4 | 22.9 | 6.8 | 22.2 | 9.5 | 12.2 | 9.2 | 10.6 |
| 2013-05-07 | 7.8 | 17.9 | 6.8 | 24.4 | 5.6 | 23.0 | 6.9 | 20.1 | 9.9 | 12.1 | 8.3 | 10.3 |
| 2013-05-14 | 7.4 | 19.2 | 6.7 | 27.0 | 4.4 | 25.1 | 6.9 | 19.3 | 10.2 | 12.4 | 7.8 | 10.2 |
| 2013-05-21 | 6.6 | 20.7 | 6.3 | 29.2 | 4.1 | 28.2 | 7.0 | 19.6 | 7.7 | 13.4 | 7.6 | 10.7 |
| 2013-05-28 | 6.7 | 21.3 | 6.3 | 31.3 | 5.4 | 32.2 | 7.0 | 20.8 | 6.9 | 13.8 | 8.1 | 10.9 |
Source: NRCan
Crude Oil Overview
Modest Rise in Global Crude Oil Prices
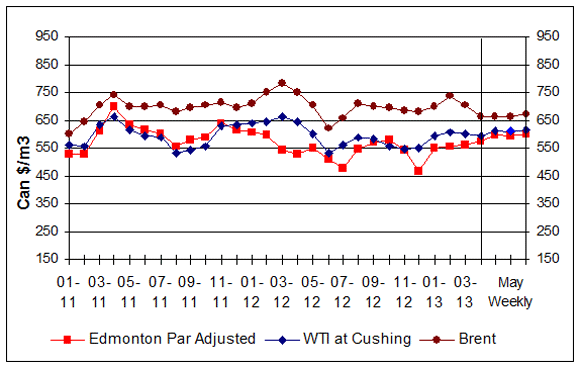
For the week ending May 24, 2013, prices for the three marker crudes averaged between $600/m3 and $669/m3 (US$93 to US$103 per barrel). This is a slight increase in the range of $8 to $9/m3 from the previous week.
The price differential between Brent and WTI stood at $53/m3 ($US8 per barrel). The Canadian Edmonton Par crude differential to WTI was $16/m3 ($US1 per barrel) during the same period. On average, prices for the three benchmarks moved in a narrow range in the last three weeks from $595/m3 to $664/m3 (US$93 to US$106 per barrel).
World crude oil prices fluctuated in a narrow range for the week ending May 24, 2013, as the U.S. economy, the largest oil consumer, continues to show signs of weakness despite modest economic growth. The U.S. unemployment rate is hovering at nearly 8%, or 12 million people, pulling down the demand for oil and products.
Furthermore, the latest economic indicators show slowing economic growth in China – the world’s second-largest energy consumer, which could lead to lower global oil consumption.
Figure 6: Crude Oil Price Comparisons
Text version - Figure 6
This graph shows crude oil prices for Edmonton Par, WTI and Brent. The average weekly prices for the period ending May 10, 2013, were $594/cubic metres, $609/cubic metres and $661/cubic metres for Edmonton Par, WTI and Brent, respectively.
| Dates | Edmonton Par Prices | WTI Prices | Brent Prices |
|---|---|---|---|
| 01/11 | 525.08 | 559.18 | 601.95 |
| 02/11 | 525.75 | 556.16 | 645.23 |
| 03/11 | 609.96 | 632.59 | 703.16 |
| 04/11 | 696.77 | 662.59 | 741.59 |
| 05/11 | 634.91 | 617.17 | 697.06 |
| 06/11 | 614.21 | 591.76 | 699.64 |
| 07/11 | 599.18 | 585.28 | 701.96 |
| 08/11 | 554.74 | 533.58 | 679.51 |
| 09/11 | 578.01 | 538.55 | 696.18 |
| 10/11 | 585.88 | 554.72 | 702.66 |
| 11/11 | 636.41 | 627.49 | 713.92 |
| 12/11 | 615.54 | 633.97 | 693.85 |
| 01/12 | 608.11 | 639.88 | 709.45 |
| 02/12 | 594.50 | 640.89 | 750.59 |
| 03/12 | 538.60 | 663.34 | 780.71 |
| 04/12 | 528.21 | 644.60 | 751.91 |
| 05/12 | 548.81 | 601.64 | 704.10 |
| 06/12 | 507.78 | 532.76 | 618.43 |
| 07/12 | 477.07 | 560.69 | 659.07 |
| 08/12 | 544.82 | 587.49 | 707.75 |
| 09/12 | 570.15 | 582.08 | 697.56 |
| 10/12 | 578.61 | 555.66 | 694.60 |
| 11/12 | 539.87 | 543.52 | 686.30 |
| 12/12 | 467.14 | 549.56 | 680.33 |
| 01/13 | 549.97 | 592.14 | 699.83 |
| 02/13 | 553.76 | 605.29 | 736.06 |
| 03/13 | 560.66 | 598.93 | 705.36 |
| 04/13 | 571.20 | 590.06 | 663.78 |
| May 10, 2013 | 594.37 | 608.52 | 661.36 |
| May 17, 2013 | 590.97 | 607.67 | 661.06 |
| May 24, 2013 | 600.44 | 616.34 | 669.25 |
| Crude Oil Types | Week Ending: 2013-05-24 |
Change From: | ||||
|---|---|---|---|---|---|---|
| Previous Week | Last Year | |||||
| $Can/m3 | $US/bbl | $Can/m3 | $US/bbl | $Can/m3 | $US/bbl | |
| Edmonton Par | 600.44 | 92.65 | +9.47 | +0.29 | +67.90 | +10.03 |
| WTI | 616.34 | 95.11 | +8.67 | +0.14 | +30.28 | +4.18 |
| Brent | 669.25 | 103.28 | +8.19 | -0.04 | -30.24 | -5.25 |
Source: NRCan
Summer Outlook Oil Market 2013
WTI is expected to continue trading at a discount to Brent over the outlook period. However, significant new pipeline capacity from the Cushing, Oklahoma area and from the Permian Basin (in West Texas and southeastern New Mexico) to the U.S. Gulf Coast is expected to lead to reduced inventories at the Cushing hub and the narrowing of the WTI-Brent differential in the area of US$8 by mid-summer.
Global oil markets remain well supplied with inventories of crude oil and petroleum products in the three main OECD markets (U.S., Japan and Europe) near the middle of the five-year range.
Geopolitical risks in the Middle East continue to influence global oil markets. These risks to supply regions are supportive of prices and further deterioration of the situation in any of these regions may lead to higher global crude oil prices.
Concerns about slowing global economic growth continue to influence expectations for crude oil demand. Crude oil prices over the summer are expected to average between US$90 and US$100 per barrel for WTI and between US$100 and US$110 per barrel for Brent.
Source: National Energy Board
Download the report
Fuel Focus - Printable Version [PDF, 296 KB]
To read Adobe Acrobat® files, you will need to download and install the free Acrobat Reader® software available from Adobe Systems Incorporated.
Page details
- Date modified: