
Fuel Focus, October 4, 2013
Table of Contents
- National Overview
- Recent Developments
- Retail Gasoline Overview
- Wholesale Gasoline Prices
- Refining and Marketing Margins
- Crude Oil Overview
- Download the report
National Overview
National Retail Gasoline Prices Decreased 2 Cents per Litre from Last Week
The Canadian retail gasoline price declined for the fourth straight week, by 2 cents to $1.24 per litre—an eight-month low. This represents a decrease of almost 9 cents per litre from last year at the same period.
Pump prices were driven down by lower wholesale gasoline prices across North America, which in turn weakened with lower crude oil prices. In addition, the decline in U.S. crude oil and gasoline inventories continue to put downward pressure on prices.
Diesel fuel prices declined by nearly 1 cent to $1.27 per litre, up 1 cent from the same period last year. Furnace oil prices declined by 2 cents per litre from last week, ending at $1.19 per litre, an increase of 3 cents from a year ago.
Figure 1: Crude Oil and Regular Gasoline Price Comparison
(National Average)
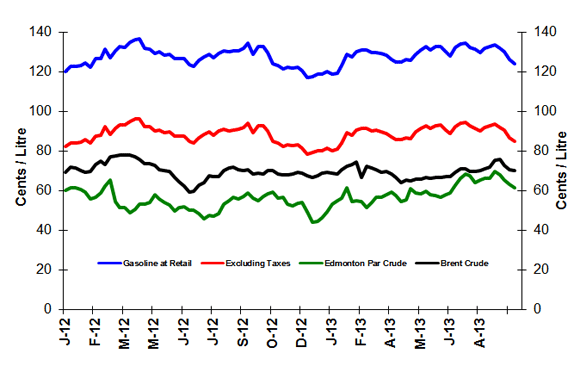
text version - Figure 1
The graph shows prices in cents per litre for gasoline at retail, gasoline excluding taxes, and Edmonton Par and Brent crude oil prices. Gasoline prices ended the period of October 1, 2013 at 124.3 cents per litre, excluding taxes at 85.2 cents per litre, Edmonton Par at 61.9 cents per litre and Brent at 70.3 cents per litre.
| Dates | Gasoline at retail | Excluding Taxes | Edmonton Par crude | Brent crude |
|---|---|---|---|---|
| 03/01/2012 | 120.6 | 82.7 | 60.5 | 69.6 |
| 10/01/2012 | 122.9 | 84.4 | 61.7 | 72.1 |
| 17/01/2012 | 123.0 | 84.4 | 61.8 | 71.8 |
| 24/01/2012 | 123.3 | 84.8 | 61.0 | 70.4 |
| 31/01/2012 | 124.7 | 86.0 | 59.7 | 69.7 |
| 07/02/2012 | 122.7 | 84.2 | 56.1 | 70.2 |
| 14/02/2012 | 126.7 | 87.8 | 57.1 | 73.6 |
| 21/02/2012 | 127.0 | 88.1 | 58.9 | 75.1 |
| 28/02/2012 | 131.7 | 92.4 | 62.6 | 73.4 |
| 06/03/2012 | 127.3 | 88.5 | 65.6 | 77.5 |
| 13/03/2012 | 131.0 | 91.8 | 54.9 | 77.9 |
| 20/03/2012 | 132.8 | 93.4 | 51.6 | 78.2 |
| 27/03/2012 | 132.7 | 93.3 | 51.7 | 78.1 |
| 03/04/2012 | 135.1 | 95.2 | 48.9 | 78.3 |
| 10/04/2012 | 136.4 | 96.4 | 50.8 | 77.5 |
| 17/04/2012 | 136.7 | 96.7 | 52.9 | 76.2 |
| 24/04/2012 | 132.0 | 92.6 | 53.4 | 73.9 |
| 01/05/2012 | 131.9 | 92.4 | 54.4 | 73.9 |
| 08/05/2012 | 129.5 | 90.3 | 58.1 | 73.0 |
| 15/05/2012 | 130.3 | 91.0 | 56.2 | 70.7 |
| 22/05/2012 | 128.5 | 89.4 | 54.2 | 70.2 |
| 29/05/2012 | 129.3 | 90.1 | 53.0 | 69.9 |
| 05/06/2012 | 126.8 | 88.0 | 50.0 | 66.8 |
| 12/06/2012 | 126.7 | 87.9 | 51.9 | 64.7 |
| 19/06/2012 | 126.8 | 87.9 | 52.1 | 62.6 |
| 26/06/2012 | 123.7 | 85.2 | 50.3 | 59.5 |
| 03/07/2012 | 123.1 | 84.5 | 50.3 | 60.0 |
| 10/07/2012 | 126.0 | 87.1 | 48.8 | 63.1 |
| 17/07/2012 | 128.0 | 88.8 | 46.0 | 64.3 |
| 24/07/2012 | 129.2 | 89.9 | 48.0 | 67.7 |
| 31/07/2012 | 127.3 | 88.2 | 47.6 | 67.4 |
| 07/08/2012 | 129.7 | 90.3 | 48.5 | 67.5 |
| 14/08/2012 | 131.0 | 91.2 | 53.6 | 70.3 |
| 21/08/2012 | 130.3 | 90.5 | 55.1 | 71.8 |
| 28/08/2012 | 130.7 | 90.9 | 56.9 | 72.1 |
| 04/09/2012 | 130.9 | 91.1 | 55.9 | 70.8 |
| 11/09/2012 | 132.2 | 92.2 | 57.3 | 70.4 |
| 18/09/2012 | 134.6 | 94.4 | 59.0 | 71.0 |
| 25/09/2012 | 128.9 | 89.4 | 56.7 | 68.6 |
| 02/10/2012 | 132.8 | 92.8 | 55.3 | 69.1 |
| 09/10/2012 | 133.0 | 93.0 | 57.2 | 68.6 |
| 16/10/2012 | 130.1 | 90.4 | 58.7 | 70.3 |
| 23/10/2012 | 124.3 | 85.3 | 59.6 | 70.5 |
| 30/10/2012 | 123.5 | 84.5 | 56.6 | 68.5 |
| 06/11/2012 | 121.6 | 82.7 | 57.0 | 68.3 |
| 13/11/2012 | 122.5 | 83.5 | 53.5 | 68.0 |
| 20/11/2012 | 122.2 | 83.2 | 52.7 | 68.6 |
| 27/11/2012 | 122.6 | 83.5 | 53.8 | 69.7 |
| 04/12/2012 | 120.9 | 81.9 | 54.2 | 69.0 |
| 11/12/2012 | 117.3 | 78.7 | 49.4 | 67.8 |
| 18/12/2012 | 117.7 | 79.5 | 44.1 | 67.1 |
| 25/12/2012 | 119.0 | 80.3 | 44.8 | 67.7 |
| 01/01/2013 | 118.9 | 80.4 | 46.6 | 69.3 |
| 08/01/2013 | 120.6 | 81.9 | 49.4 | 69.5 |
| 15/01/2013 | 118.9 | 80.3 | 53.7 | 69.2 |
| 22/01/2013 | 119.7 | 81.1 | 55.2 | 68.7 |
| 29/01/2013 | 123.3 | 84.3 | 56.6 | 70.7 |
| 05/02/2013 | 129.2 | 89.7 | 61.9 | 72.5 |
| 12/02/2013 | 127.7 | 88.4 | 54.8 | 73.5 |
| 19/02/2013 | 130.5 | 90.9 | 55.3 | 74.6 |
| 26/02/2013 | 131.2 | 91.6 | 54.7 | 67.1 |
| 05/03/2013 | 131.2 | 91.6 | 51.8 | 72.5 |
| 12/03/2013 | 129.9 | 90.4 | 54.2 | 71.8 |
| 19/03/2013 | 130.1 | 90.7 | 56.7 | 70.6 |
| 23/04/2013 | 125.1 | 85.9 | 54.8 | 64.4 |
| 30/04/2013 | 126.3 | 87.0 | 55.8 | 65.5 |
| 07/05/2013 | 126.0 | 86.7 | 61.4 | 65.1 |
| 14/05/2013 | 129.3 | 89.8 | 59.1 | 66.1 |
| 21/05/2013 | 131.4 | 91.8 | 58.8 | 66.1 |
| 28/05/2013 | 132.9 | 93.2 | 60.0 | 66.9 |
| 04/06/2013 | 131.1 | 91.5 | 58.1 | 66.6 |
| 11/06/2013 | 132.9 | 93.2 | 57.8 | 66.8 |
| 18/06/2013 | 133.1 | 93.3 | 57.0 | 66.8 |
| 25/06/2013 | 130.5 | 91.0 | 58.0 | 67.4 |
| 02/07/2013 | 128.3 | 88.9 | 59.0 | 67.2 |
| 09/07/2013 | 132.4 | 92.6 | 63.1 | 69.6 |
| 16/07/2013 | 134.4 | 94.3 | 66.6 | 71.2 |
| 23/07/2013 | 134.7 | 94.6 | 68.7 | 71.1 |
| 30/07/2013 | 132.7 | 92.8 | 67.9 | 69.8 |
| 06/08/2013 | 131.5 | 91.7 | 64.1 | 70.1 |
| 13/08/2013 | 130.0 | 90.3 | 65.6 | 70.3 |
| 20/08/2013 | 132.0 | 92.2 | 66.4 | 71.3 |
| 27/08/2013 | 133.0 | 93.0 | 66.4 | 72.3 |
| 03/09/2013 | 133.9 | 93.8 | 70.2 | 75.5 |
| 10/09/2013 | 132.1 | 92.2 | 68.1 | 76.1 |
| 17/09/2013 | 130.6 | 90.8 | 65.8 | 73.0 |
| 24/09/2013 | 126.4 | 87.1 | 63.7 | 70.8 |
| 01/10/2013 | 124.3 | 85.2 | 61.9 | 70.3 |
Figure 2: Weekly Regular Gasoline Prices
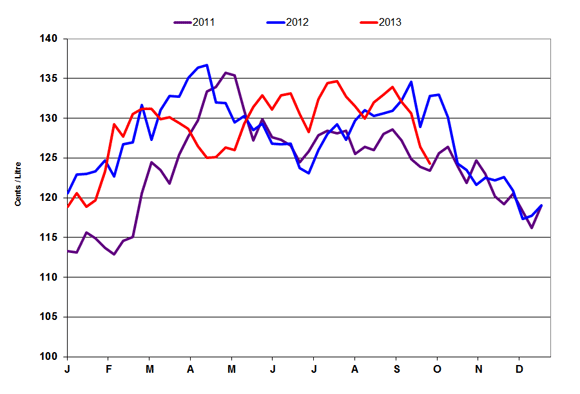
text version - Figure 2
This graph shows the gasoline price trends from 2011 to 2013.
| 2011 | 2012 | 2013 | |||
|---|---|---|---|---|---|
| Gasoline at Retail | Gasoline at Retail | Gasoline at Retail | |||
| 11-01-04 | 113.30 | 12-01-03 | 120.60 | 13-01-01 | 118.90 |
| 11-01-11 | 113.10 | 12-01-10 | 122.90 | 13-01-08 | 120.60 |
| 11-01-18 | 115.60 | 12-01-17 | 123.00 | 13-01-15 | 118.90 |
| 11-01-25 | 114.90 | 12-01-24 | 123.30 | 13-01-22 | 119.70 |
| 11-02-01 | 113.70 | 12-01-31 | 124.70 | 13-01-29 | 123.30 |
| 11-02-08 | 112.90 | 12-02-07 | 122.70 | 13-02-05 | 129.20 |
| 11-02-15 | 114.60 | 12-02-14 | 126.70 | 13-02-12 | 127.70 |
| 11-02-22 | 115.10 | 12-02-21 | 127.00 | 13-02-19 | 130.50 |
| 11-03-01 | 120.60 | 12-02-28 | 131.70 | 13-02-26 | 131.20 |
| 11-03-08 | 124.50 | 12-03-06 | 127.30 | 13-03-05 | 131.20 |
| 11-03-15 | 123.50 | 12-03-13 | 131.00 | 13-03-12 | 129.90 |
| 11-03-22 | 121.80 | 12-03-20 | 132.80 | 13-03-19 | 130.10 |
| 11-03-29 | 125.40 | 12-03-27 | 132.70 | 13-03-26 | 129.40 |
| 11-04-05 | 127.70 | 12-04-03 | 135.10 | 13-04-02 | 128.70 |
| 11-04-12 | 129.70 | 12-04-10 | 136.40 | 13-04-09 | 126.50 |
| 11-04-19 | 133.40 | 12-04-17 | 136.70 | 13-04-16 | 125.00 |
| 11-04-26 | 133.90 | 12-04-24 | 132.00 | 13-04-23 | 125.10 |
| 11-05-03 | 135.70 | 12-05-01 | 131.90 | 13-04-30 | 126.30 |
| 11-05-10 | 135.40 | 12-05-08 | 129.50 | 13-05-07 | 126.00 |
| 11-05-17 | 130.90 | 12-05-15 | 130.30 | 13-05-14 | 129.30 |
| 11-05-24 | 127.20 | 12-05-22 | 128.50 | 13-05-21 | 131.40 |
| 11-05-31 | 129.90 | 12-05-29 | 129.30 | 13-05-28 | 132.90 |
| 11-06-07 | 127.60 | 12-06-05 | 126.80 | 13-06-04 | 131.10 |
| 11-06-14 | 127.30 | 12-06-12 | 126.70 | 13-06-11 | 132.90 |
| 11-06-21 | 126.60 | 12-06-19 | 126.80 | 13-06-18 | 133.10 |
| 11-06-28 | 124.50 | 12-06-26 | 123.70 | 13-06-25 | 130.50 |
| 11-07-05 | 125.80 | 12-07-03 | 123.10 | 13-07-02 | 128.30 |
| 11-07-12 | 127.90 | 12-07-10 | 126.00 | 13-07-09 | 132.40 |
| 11-07-19 | 128.40 | 12-07-17 | 128.00 | 13-07-16 | 134.40 |
| 11-07-26 | 128.10 | 12-07-24 | 129.20 | 13-07-23 | 134.70 |
| 11-08-02 | 128.40 | 12-07-31 | 127.30 | 13-07-30 | 132.70 |
| 11-08-09 | 125.50 | 12-08-07 | 129.70 | 13-08-06 | 131.50 |
| 11-08-16 | 126.40 | 12-08-14 | 131.00 | 13-08-13 | 130.00 |
| 11-08-23 | 126.00 | 12-08-21 | 130.30 | 13-08-20 | 132.00 |
| 11-08-30 | 128.00 | 12-08-28 | 130.60 | 13-08-27 | 133.00 |
| 11-09-06 | 128.60 | 12-09-04 | 130.90 | 13-09-03 | 133.90 |
| 11-09-13 | 127.20 | 12-09-11 | 132.20 | 13-09-10 | 132.10 |
| 11-09-20 | 124.90 | 12-09-18 | 134.60 | 13-09-17 | 130.60 |
| 11-09-27 | 123.90 | 12-09-25 | 128.90 | 13-09-24 | 126.40 |
| 11-10-04 | 123.40 | 12-10-02 | 132.80 | 13-10-01 | 124.30 |
| 11-10-11 | 125.60 | 12-10-09 | 133.00 | 13-10-08 | |
| 11-10-18 | 126.40 | 12-10-16 | 130.10 | 13-10-15 | |
| 11-10-25 | 124.00 | 12-10-23 | 124.30 | 13-10-22 | |
| 11-11-01 | 121.90 | 12-10-30 | 123.50 | 13-10-29 | |
| 11-11-08 | 124.70 | 12-11-06 | 121.60 | 13-11-05 | |
| 11-11-15 | 123.00 | 12-11-13 | 122.50 | 13-11-12 | |
| 11-11-22 | 120.20 | 12-11-20 | 122.20 | 13-11-19 | |
| 11-11-29 | 119.20 | 12-11-27 | 122.60 | 13-11-26 | |
| 11-12-06 | 120.50 | 12-12-04 | 120.90 | 13-12-03 | |
| 11-12-13 | 118.30 | 12-12-11 | 117.30 | 13-12-10 | |
| 11-12-20 | 116.20 | 12-12-18 | 117.70 | 13-12-17 | |
| 11-12-27 | 119.00 | 12-12-25 | 119.00 | 13-12-24 | |
| 13-12-31 |
| ¢/L |
Week of: 2013-10-01 |
Change from: Previous Week |
Change from: Last Year |
|---|---|---|---|
| Gasoline | 124.3 | -2.0 | -8.5 |
| Diesel | 126.7 | -0.5 | +1.2 |
| Furnace Oil | 119.4 | -2.1 | +3.4 |
Source: NRCan
| 2013-10-01 | ¢/kilogram | ¢/L gasoline equivalent |
¢/L diesel equivalent |
|---|---|---|---|
| Vancouver | 119.4 | 78.8 | 81.7 |
| Edmonton | 115.1 | 75.9 | 78.7 |
| Toronto | 110.6 | 73.0 | 75.6 |
Source: ¢/kg Kent Marketing Services Limited
Recent Developments
-
Canadian Crude by Rail to the West Coast: The West Coast, including California and the Pacific Northwest, offers new opportunities for Canadian producers moving crude by rail where pipeline capacity is tight or non-existent. In the last two years, rail imports into the United States PADD V (West Coast, Alaska and Hawaii) have been rising. PADD V has another 19.6 percent or 579,500 bbls a day of coking capacity, including 496,000 bbls per day in California, which has limited pipeline capacity from Canada. (Source: The Daily Oil Bulletin)
-
Domestic Crude Oil Production: Canadian production of crude oil and equivalent hydrocarbons increased by 5% to 15.6 million cubic meters in June 2013 compared to the same period last year. Exports increased less than 1% to 11 million cubic meters. About 72% of Canada's total domestic production went to the export market compared to 76% a year earlier. Imports decreased 2% to 3 million cubic meters. (Statistics Canada, The Daily )
- Canadian Oil Discovery: Norway's Statoil ASA, in a venture with Husky Energy Inc., has made its biggest oil discovery outside Norway estimated between 300 million and 600 million barrels of recoverable oil about 500 kilometres off the coast of Newfoundland and Labrador. While the latest Statoil find is a significant discovery for offshore Canada, it pales in comparison with output from the country's oil sands in Alberta, where production is forecast to hit 5.2 million barrels a day by 2030. (Source: Reuters, September 26, 2013)
Retail Gasoline Overview
For the period ending October 1, 2013, the four-week average regular gasoline pump price in selected cities across Canada was $1.28 per litre. Compared to the same period in 2012, the average Canadian pump price is 4 cents per litre lower.
The four-week average crude component was 68 cents per litre, a dip of 2 cents compared to two weeks ago. However, the crude oil price component of gasoline has increased by nearly 6 cents per litre over this same period in 2012.
Retail gasoline prices in most Western centres declined, on average, by 3 cents per litre when compared to the previous report, ranging from $1.13 to $1.38 per litre. Prices in Eastern cities decreased on average by 5 cents per litre, and ranged from $1.29 to $1.36 cents per litre.
At the national level, industry margins have decreased by 1 cent per litre since the last report. Refining margins are lower by 9 cents per litre compared to last year at this time, which more than offsets the higher crude oil prices and moderates the rise in retail pump prices.
Figure 3: Regular Gasoline Pump Prices in Selected Cities
Four-Week Average (September 10 to October 1, 2013)
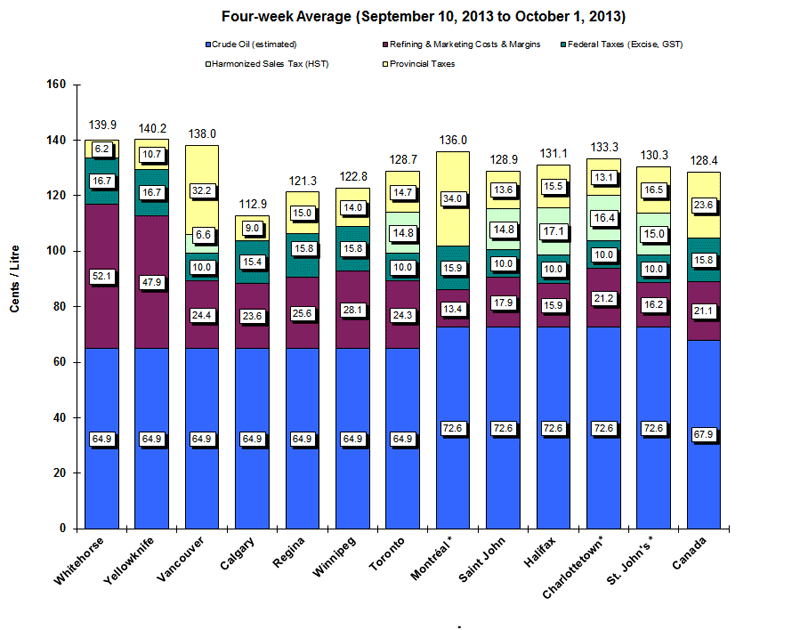
text version - Figure 3
This graph shows the gasoline price components for 2 territories and 10 cities plus the national average,
| Whitehorse | Yellowknife | Vancouver | Calgary | Regina | Winnipeg | Toronto | Montreal* | Saint John* | Halifax* | Charlottetown* | St, John's* | Canada | |
|---|---|---|---|---|---|---|---|---|---|---|---|---|---|
| Pump Price | 139.9 | 140.2 | 138.0 | 112.9 | 121.3 | 122.8 | 128.7 | 136.0 | 128.9 | 131.1 | 133.3 | 130.3 | 128.4 |
| Crude (est,) | 64.9 | 64.9 | 64.9 | 64.9 | 64.9 | 64.9 | 64.9 | 72.6 | 72.6 | 72.6 | 72.6 | 72.6 | 67.9 |
| Federal Taxes | 16.7 | 16.7 | 10.0 | 15.4 | 15.8 | 15.8 | 10.0 | 15.9 | 10.0 | 10.0 | 10.0 | 10.0 | 15.8 |
| Provincial Tax | 6.2 | 10.7 | 32.2 | 9.0 | 15.0 | 14.0 | 14.7 | 34.0 | 13.6 | 15.5 | 13.1 | 16.5 | 23.6 |
| HST | 6.6 | 14.8 | 14.8 | 17.1 | 16.4 | 15.0 | |||||||
| Refining & Marketing Costs & Margins | 52.1 | 47.9 | 24.4 | 23.6 | 25.6 | 28.1 | 24.3 | 13.4 | 17.9 | 15.9 | 21.2 | 16.2 | 21.1 |
Source: NRCan
* Regulated Markets
Wholesale Petroleum Product Prices
Natural Resources Canada’s Fuel Focus website posts weekly wholesale petroleum product prices.
Wholesale (rack) prices are available for 21 Canadian centres for regular, mid-grade and premium gasoline as well as diesel and furnace oil.
The prices are the daily prices (posted weekly) as reported by the refiners at the terminals for each of the selected centres and do not include taxes. For the daily wholesale prices, only those of the last 60 days are posted. The weekly prices are five-day averages and the monthly prices are averages of the daily prices for the month. Prices are for specific urban centres and do not represent provincial averages.
Wholesale Gasoline Prices
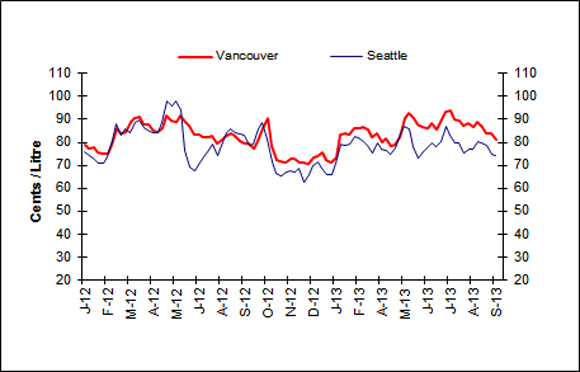
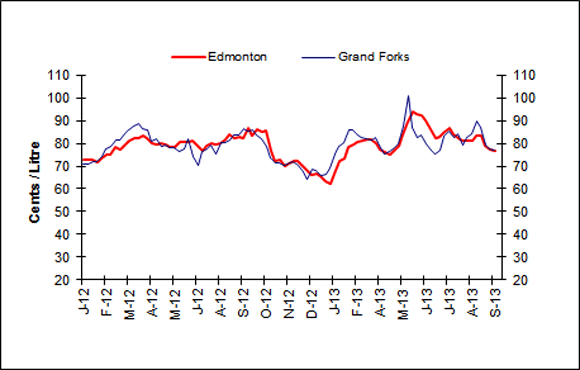
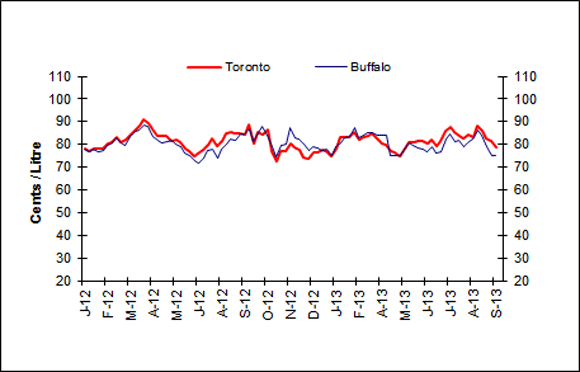
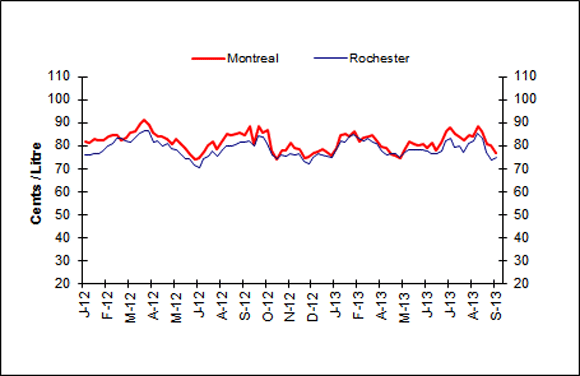
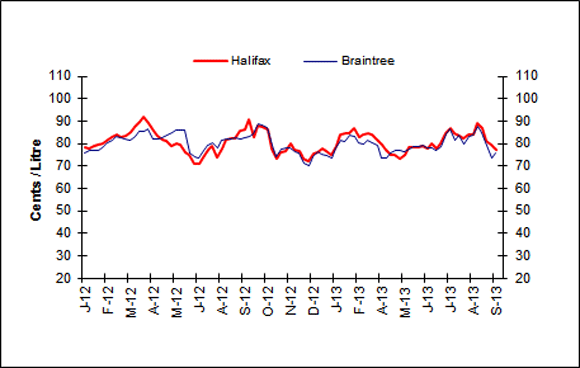
For the week ending September 26, 2013, wholesale gasoline prices decreased in most of the selected Canadian and American centres compared to the previous week.
Overall, wholesale prices fluctuated between a decrease of 3 cents per litre to an increase of 2 cents per litre. Prices ended the period in the 74 to 81 cent-per-litre range.
Wholesale gasoline prices in the Eastern centres for both Canada and the U.S. ranged from an increase of 2 cents per litre to a decrease of 3 cents per litre, ending the period in the 75 to 79 cent-per-litre range.
In the Western centres, price changes ranged from a decrease of less than 1 cent per litre to a decrease of nearly 3 cents per litre, closing at 74 to 81 cents per litre.
 |
 |
|
 |
 |
|
 |
text version - Figure 4
This graph shows the trend in wholesale gasoline prices for selected centres in Canada and the U.S.
| DATE | Halifax | Braintree | Montreal | Rochester | Toronto | Buffalo | Edmonton | Grand Forks | Vancouver | Seattle |
|---|---|---|---|---|---|---|---|---|---|---|
| Thu 05-Jan-12 | 78.30 | 75.98 | 81.60 | 75.96 | 78.50 | 78.12 | 72.80 | 70.73 | 78.90 | 76.05 |
| Thu 12-Jan-12 | 78.00 | 76.93 | 81.40 | 76.17 | 77.20 | 76.78 | 73.00 | 70.78 | 77.30 | 74.34 |
| Thu 19-Jan-12 | 79.00 | 77.11 | 82.60 | 76.67 | 78.40 | 77.87 | 72.70 | 71.87 | 77.90 | 72.89 |
| Thu 26-Jan-12 | 79.40 | 76.87 | 82.30 | 76.65 | 78.20 | 76.77 | 71.50 | 72.13 | 75.70 | 70.92 |
| Thu 02-Feb-12 | 80.10 | 78.57 | 82.50 | 77.46 | 78.50 | 77.55 | 73.20 | 74.13 | 75.00 | 71.02 |
| Thu 09-Feb-12 | 81.80 | 80.57 | 83.80 | 80.07 | 80.40 | 79.83 | 74.80 | 77.38 | 75.20 | 73.88 |
| hu 16-Feb-12 | 82.70 | 81.17 | 84.60 | 80.70 | 81.10 | 80.53 | 75.20 | 78.68 | 79.10 | 80.62 |
| Thu 23-Feb-12 | 84.20 | 83.12 | 84.50 | 83.26 | 83.30 | 82.83 | 78.30 | 81.53 | 86.30 | 87.84 |
| Thu 01-Mar-12 | 83.00 | 82.67 | 82.10 | 83.10 | 81.20 | 80.92 | 77.20 | 81.51 | 83.70 | 83.24 |
| Thu 08-Mar-12 | 83.20 | 81.93 | 83.40 | 82.01 | 82.20 | 79.67 | 79.00 | 84.37 | 84.20 | 86.03 |
| Thu 15-Mar-12 | 85.30 | 81.51 | 85.40 | 81.64 | 84.60 | 83.41 | 81.40 | 85.85 | 89.10 | 84.33 |
| Thu 22-Mar-12 | 87.30 | 83.23 | 86.30 | 83.69 | 86.10 | 85.62 | 82.00 | 87.65 | 90.50 | 88.72 |
| Thu 9-Mar-12 | 89.60 | 85.57 | 89.40 | 85.29 | 88.10 | 86.11 | 82.30 | 88.42 | 91.10 | 89.74 |
| Thu 05-Apr-12 | 91.80 | 85.57 | 91.00 | 86.50 | 90.90 | 88.65 | 83.50 | 86.17 | 88.00 | 86.61 |
| Thu 2-Apr-12 | 88.90 | 86.73 | 89.00 | 86.24 | 89.60 | 87.79 | 82.50 | 85.65 | 87.50 | 85.43 |
| Thu 19-Apr-12 | 85.80 | 82.15 | 85.40 | 81.69 | 86.00 | 83.66 | 80.10 | 80.61 | 85.20 | 84.31 |
| Thu 26-Apr-12 | 83.30 | 82.09 | 83.90 | 81.75 | 84.00 | 82.15 | 79.60 | 81.72 | 84.40 | 84.04 |
| Thu 03-May-12 | 81.50 | 82.57 | 84.00 | 79.72 | 83.80 | 80.81 | 79.90 | 78.77 | 86.00 | 88.50 |
| Thu 10-May-12 | 81.20 | 83.82 | 83.10 | 80.79 | 83.80 | 81.50 | 79.40 | 79.14 | 91.40 | 97.78 |
| Thu 17-May-12 | 79.10 | 85.05 | 80.60 | 78.79 | 81.50 | 81.63 | 78.50 | 77.97 | 89.20 | 95.59 |
| Thu 24-May-12 | 79.90 | 85.98 | 82.80 | 78.04 | 82.20 | 80.07 | 78.60 | 78.09 | 89.10 | 97.99 |
| Thu 31-May-12 | 79.30 | 86.07 | 80.90 | 76.24 | 80.80 | 79.07 | 80.80 | 76.64 | 91.60 | 94.29 |
| Thu 07-Jun-12 | 75.90 | 85.72 | 78.70 | 74.45 | 78.40 | 76.04 | 80.50 | 77.57 | 88.60 | 76.45 |
| Thu 14-Jun-12 | 75.00 | 75.71 | 76.30 | 74.07 | 77.10 | 74.98 | 80.80 | 82.24 | 87.00 | 69.43 |
| Thu 21-Jun-12 | 70.90 | 73.99 | 74.20 | 71.22 | 74.80 | 73.12 | 81.40 | 74.20 | 83.60 | 67.29 |
| Thu 28-Jun-12 | 71.10 | 73.37 | 74.30 | 70.57 | 76.80 | 71.79 | 79.20 | 70.40 | 83.30 | 70.25 |
| Thu 05-Jul-12 | 74.00 | 76.84 | 77.10 | 74.49 | 77.70 | 74.13 | 76.50 | 76.50 | 82.30 | 73.89 |
| Thu 12-Jul-12 | 77.00 | 79.06 | 79.90 | 75.64 | 79.70 | 77.17 | 78.90 | 77.33 | 82.00 | 75.98 |
| Thu 19-Jul-12 | 78.70 | 80.51 | 81.90 | 77.65 | 82.80 | 78.00 | 79.80 | 79.34 | 82.50 | 79.29 |
| Thu 26-Jul-12 | 74.10 | 78.00 | 78.20 | 75.33 | 79.30 | 73.91 | 79.50 | 75.41 | 79.70 | 74.08 |
| Thu 02-Aug-12 | 77.50 | 81.71 | 81.50 | 77.89 | 81.70 | 78.15 | 79.90 | 80.06 | 81.00 | 78.57 |
| Thu 09-Aug-12 | 81.80 | 82.28 | 85.00 | 80.00 | 85.20 | 80.22 | 81.90 | 80.55 | 82.50 | 84.38 |
| Thu 16-Aug-12 | 82.10 | 82.18 | 84.50 | 80.04 | 85.60 | 82.22 | 83.80 | 81.19 | 83.80 | 86.04 |
| Thu 23-Aug-12 | 82.50 | 82.70 | 85.10 | 80.56 | 84.90 | 82.09 | 82.40 | 83.57 | 82.50 | 83.89 |
| Thu 30-Aug-12 | 85.60 | 82.23 | 85.50 | 81.71 | 85.20 | 84.70 | 83.10 | 83.91 | 80.50 | 83.35 |
| Thu 06-Sep-12 | 86.00 | 82.67 | 84.60 | 81.65 | 84.30 | 84.61 | 82.40 | 86.24 | 79.70 | 83.15 |
| Thu 13-Sep-12 | 90.80 | 83.28 | 88.60 | 81.81 | 88.60 | 87.08 | 86.50 | 85.28 | 79.50 | 78.61 |
| Thu 20-Sep-12 | 82.80 | 84.03 | 80.80 | 79.82 | 80.50 | 81.33 | 83.60 | 85.93 | 77.30 | 79.04 |
| Thu 27-Sep-12 | 87.70 | 84.38 | 88.40 | 84.06 | 85.30 | 85.30 | 86.30 | 83.65 | 80.70 | 85.58 |
| Thu 04-Oct-12 | 87.30 | 84.45 | 85.40 |
83.55 | 84.20 | 88.22 | 85.00 |
81.73 | 85.90 | 88.43 |
| Thu 11-Oct-12 | 86.00 |
84.10 | 87.00 |
81.16 | 86.50 | 83.98 | 85.40 |
78.69 | 90.60 | 81.35 |
| Thu 18-Oct-12 | 77.80 | 84.33 | 77.70 | 76.05 | 77.20 | 79.28 | 76.60 | 73.80 | 78.50 | 71.33 |
| Thu 25-Oct-12 | 73.00 | 85.48 | 73.80 | 74.24 | 72.70 | 74.59 | 72.10 | 71.37 | 72.10 | 66.33 |
| Thu 01-Nov-12 | 76.30 | 85.75 | 78.10 | 76.16 | 77.40 | 79.83 | 72.60 | 71.19 | 71.60 | 65.42 |
| Thu 08-Nov-12 | 76.80 | 85.86 | 77.60 | 75.63 | 77.40 | 79.93 | 69.90 | 70.30 | 71.10 | 67.09 |
| Thu 15-Nov-12 | 80.10 | 78.06 | 81.20 | 76.45 | 80.60 | 87.66 | 70.90 | 71.58 | 72.80 | 67.68 |
| Thu 22-Nov-12 | 77.20 | 76.48 | 79.20 | 75.80 | 78.90 | 83.00 | 72.50 | 71.84 | 72.80 | 67.14 |
| Thu 29-Nov-12 | 76.70 | 76.01 | 78.30 | 76.51 | 77.50 | 82.63 | 72.10 | 70.37 | 71.30 | 68.68 |
| Thu 06-Dec-12 | 73.10 | 71.08 | 74.60 | 73.05 | 74.40 | 80.37 | 70.10 | 67.40 | 71.40 | 62.39 |
| Thu 13-Dec-12 | 72.10 | 70.22 | 74.90 | 71.94 | 73.90 | 77.52 | 67.70 | 64.43 | 70.50 | 65.70 |
| Thu 20-Dec-12 | 75.40 | 74.02 | 76.90 | 74.59 | 76.40 | 79.11 | 66.10 | 68.86 | 73.30 | 69.53 |
| Thu 27-Dec-12 | 75.80 | 76.29 | 77.10 | 76.52 | 76.80 | 78.58 | 66.70 | 67.97 | 74.00 | 71.30 |
| Thu 03-Jan-13 | 77.50 | 75.42 | 78.60 | 75.82 | 77.50 | 77.31 | 65.40 | 66.07 | 75.50 | 68.79 |
| Thu 10-Jan-13 | 76.70 | 74.48 | 77.40 | 75.49 | 76.90 | 77.88 | 63.40 | 66.67 | 72.40 | 65.77 |
| Thu 17-Jan-13 | 74.80 | 73.73 | 75.40 | 74.81 | 75.00 | 74.96 | 62.40 | 69.13 | 70.90 | 65.72 |
| Thu 13-Dec-12 | 72.10 | 70.22 | 74.90 | 71.94 | 73.90 | 77.52 | 67.70 | 64.43 | 70.50 | 65.70 |
| Thu 24-Jan-13 | 79.00 | 78.00 | 79.00 | 78.15 | 78.30 | 78.93 | 66.80 | 75.06 | 73.50 | 70.59 |
| Thu 31-Jan-13 | 84.10 | 81.70 | 84.70 | 81.81 | 83.50 | 80.51 | 72.50 | 78.85 | 83.40 | 79.19 |
| Thu 07-Feb-13 | 84.60 | 80.98 | 85.10 | 81.47 | 83.20 | 83.16 | 73.10 | 80.16 | 84.00 | 78.87 |
| Thu 14-Feb-13 | 84.50 | 83.61 | 84.20 | 84.35 | 83.20 | 83.55 | 78.10 | 86.03 | 83.30 | 79.18 |
| Thu 21-Feb-13 | 86.70 | 83.01 | 85.90 | 84.51 | 85.40 | 87.44 | 79.70 | 85.90 | 86.00 | 82.60 |
| Thu 28-Feb-13 | 82.80 | 80.41 | 81.90 | 83.34 | 81.90 | 83.14 | 80.50 | 83.70 | 86.20 | 81.99 |
| Thu 07-Mar-13 | 84.10 | 80.00 | 83.60 | 82.22 | 83.30 | 84.09 | 81.00 | 82.56 | 86.90 | 80.15 |
| Thu 14-Mar-13 | 84.60 | 81.52 | 84.00 | 83.10 | 83.90 | 85.12 | 81.70 | 82.24 | 85.40 | 78.61 |
| Thu 21-Mar-13 | 84.10 | 80.55 | 84.50 | 81.59 | 84.80 | 84.95 | 81.80 | 81.66 | 82.10 | 75.28 |
| Thu 28-Mar-13 | 82.00 | 79.08 | 81.50 | 80.79 | 82.60 | 84.24 | 80.20 | 82.51 | 83.80 | 79.62 |
| Thu 04-Apr-13 | 79.40 | 73.32 | 79.50 | 77.54 | 80.60 | 84.10 | 77.40 | 78.17 | 80.20 | 77.14 |
| Thu 11-Apr-13 | 77.30 | 73.36 | 78.90 | 75.92 | 79.80 | 83.84 | 75.90 | 75.52 | 81.50 | 76.23 |
| Thu 18-Apr-13 | 74.70 | 75.92 | 76.30 | 76.28 | 77.10 | 75.04 | 74.90 | 76.41 | 78.50 | 74.77 |
| Thu 25-Apr-13 | 74.80 | 77.01 | 75.90 | 76.42 | 76.70 | 75.40 | 76.80 | 78.08 | 79.00 | 77.56 |
| Thu 02-May-13 | 73.50 | 76.65 | 74.50 | 75.00 | 75.00 | 75.38 | 78.80 | 79.70 | 82.00 | 83.51 |
| Thu 09-May-13 | 75.10 | 76.22 | 77.60 | 77.03 | 78.50 | 77.88 | 83.90 | 87.57 | 90.80 | 87.15 |
| Thu 16-May-13 | 78.10 | 77.25 | 81.50 | 78.21 | 80.90 | 80.54 | 89.30 | 101.10 | 92.50 | 85.64 |
| Thu 23-May-13 | 78.60 | 78.37 | 80.50 | 78.09 | 81.30 | 79.53 | 94.20 | 86.80 | 90.30 | 78.24 |
| Thu 30-May-13 | 78.40 | 78.36 | 79.80 | 77.90 | 81.40 | 78.43 | 92.60 | 82.64 | 87.60 | 73.33 |
| Thu 06-Jun-13 | 78.70 | 78.91 | 80.50 | 78.17 | 81.60 | 78.16 | 92.40 | 83.64 | 86.60 | 76.00 |
| Thu 13-Jun-13 | 77.80 | 78.32 | 78.90 | 77.45 | 80.60 | 76.84 | 90.20 | 79.79 | 86.00 | 77.78 |
| Thu 20-Jun-13 | 80.10 | 78.00 | 81.00 | 76.50 | 82.00 | 79.30 | 86.20 | 76.78 | 88.10 | 79.78 |
| Thu 27-Jun-13 | 77.80 | 76.96 | 78.10 | 76.22 | 79.40 | 76.41 | 82.40 | 75.29 | 85.70 | 77.93 |
| Thu 04-Jul-13 | 79.80 | 78.53 | 81.30 | 77.56 | 81.80 | 76.93 | 82.70 | 77.19 | 88.70 | 80.47 |
| Thu 11-Jul-13 | 84.60 | 84.52 | 86.30 | 82.08 | 85.80 | 82.51 | 85.00 | 83.36 | 93.40 | 87.07 |
| Thu 18-Jul-13 | 87.10 | 86.48 | 87.80 | 82.88 | 87.80 | 84.45 | 86.70 | 85.15 | 93.90 | 82.94 |
| Thu 25-Jul-15 | 84.40 | 81.63 | 84.80 | 79.09 | 85.40 | 81.21 | 84.10 | 82.55 | 89.90 | 79.53 |
| Thu 01-Aug-13 | 83.20 | 83.68 | 84.00 | 80.06 | 84.10 | 81.93 | 82.00 | 84.32 | 89.50 | 79.81 |
| Thu 08-Aug-13 | 82.30 | 79.58 | 82.20 | 76.89 | 82.60 | 78.85 | 81.10 | 78.95 | 87.00 | 75.45 |
| Thu 15-Aug-13 | 84.20 | 83.01 | 84.40 | 80.94 | 84.20 | 81.32 | 81.20 | 82.30 | 88.50 | 76.76 |
| Thu 22-Aug-13 | 83.90 | 83.75 | 84.00 | 82.03 | 83.50 | 82.16 | 80.90 | 84.32 | 86.40 | 76.73 |
| Thu 29-Aug-13 | 88.90 | 87.42 | 88.30 | 85.55 | 88.10 | 86.41 | 83.40 | 89.62 | 88.90 | 80.31 |
| Thu 05-Sep-13 | 86.70 | 84.77 | 86.20 | 83.13 | 85.90 | 84.03 | 83.20 | 86.81 | 86.50 | 79.97 |
| Thu 12-Sep-13 | 81.00 | 79.52 | 80.90 | 77.16 | 82.90 | 78.97 | 79.20 | 79.37 | 84.00 | 78.65 |
| Thu 19-Sep-13 | 79.70 | 73.77 | 80.20 | 73.60 | 81.60 | 75.45 | 77.10 | 77.32 | 83.70 | 74.59 |
| Thu 26-Sep-13 | 77.40 | 75.99 | 77.00 | 74.69 | 78.70 | 75.25 | 76.50 | 76.96 | 80.90 | 74.43 |
Sources: NRCan, Bloomberg Oil Buyers Guide
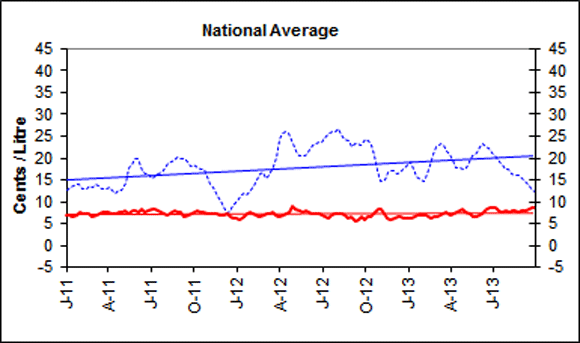
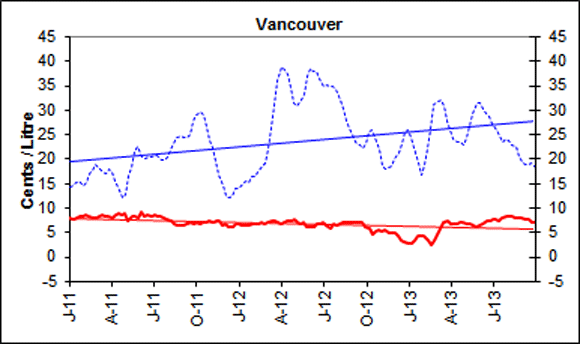
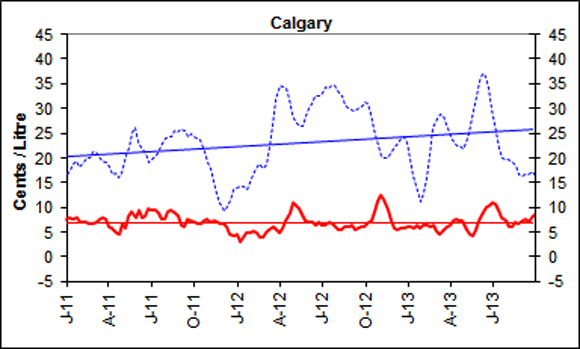
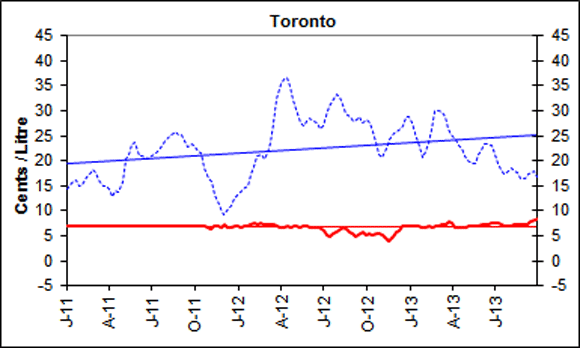
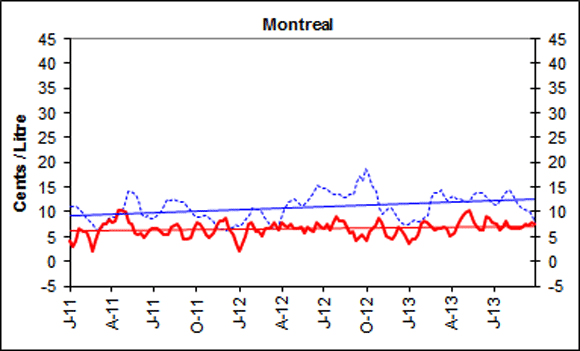
Gasoline Refining and Marketing Margins
Four-week rolling averages are used for gasoline refining and marketing margins.
Refining margins have been moving downward, reaching 12 cents per litre for the week ending October 1, 2013. This represents a 12 cent-per-litre drop from last year at the same time. These margins have trended lower, reflecting the decrease in wholesale gasoline prices, while average Canadian crude oil prices have not fallen as quickly causing refining margins to contract.
Nationally, marketing margins continue to hover around 9 cents per litre. Marketing margins continue to fluctuate in specific centres as these movements are influenced by local market conditions.
Some individual centres, however, show more fluctuations depending on the region, volume sold and availability of other product offerings such as convenience stores and car washes.
 |
 |
|
 |
 |
|
 |
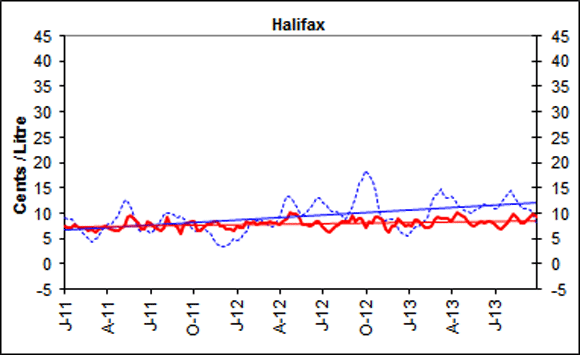 |
text version - Figure 5
These graphs show the trend in refining and marketing costs and margins for selected centres in Canada and the national average.
| 4-week rolling average | Canada | Vancouver | Calgary | Toronto | Montreal | Halifax | ||||||
|---|---|---|---|---|---|---|---|---|---|---|---|---|
| Marketing Margin | Refining Margin | Marketing Margin | Refining Margin | Marketing Margin | Refining Margin | Marketing Margin | Refining Margin | Marketing Margin | Refining Margin | Marketing Margin | Refining Margin | |
| 2011-01-04 | 6.8 | 12.7 | 8.0 | 14.4 | 7.5 | 16.6 | 7.1 | 14.4 | 4.1 | 11.0 | 7.4 | 9.0 |
| 2011-01-11 | 6.8 | 13.2 | 7.6 | 14.8 | 8.1 | 17.5 | 7.0 | 15.4 | 2.9 | 11.1 | 6.9 | 8.8 |
| 2011-01-18 | 6.6 | 13.7 | 7.9 | 15.1 | 7.7 | 18.7 | 7.1 | 16.0 | 4.3 | 11.1 | 7.2 | 8.7 |
| 2011-01-25 | 6.9 | 14.1 | 8.2 | 15.6 | 7.8 | 19.2 | 7.0 | 16.1 | 6.7 | 10.3 | 7.7 | 7.9 |
| 2011-02-01 | 7.6 | 14.0 | 8.3 | 14.5 | 6.9 | 18.2 | 7.0 | 15.0 | 6.0 | 9.7 | 7.1 | 7.2 |
| 2011-02-08 | 7.3 | 13.1 | 8.6 | 15.1 | 6.9 | 18.7 | 7.0 | 15.3 | 5.9 | 9.0 | 7.3 | 6.4 |
| 2011-02-15 | 7.4 | 13.1 | 8.3 | 17.0 | 7.1 | 19.9 | 7.0 | 16.7 | 4.5 | 8.2 | 7.2 | 5.9 |
| 2011-02-22 | 7.2 | 13.6 | 7.9 | 17.7 | 6.7 | 20.1 | 7.0 | 17.2 | 2.1 | 7.2 | 6.6 | 4.9 |
| 2011-03-01 | 6.5 | 13.5 | 8.1 | 18.9 | 6.8 | 21.3 | 7.0 | 18.3 | 4.1 | 6.3 | 6.7 | 4.3 |
| 2011-03-08 | 6.9 | 13.8 | 8.3 | 18.3 | 6.8 | 21.2 | 7.0 | 17.8 | 5.9 | 6.8 | 6.4 | 4.9 |
| 2011-03-15 | 7.2 | 13.8 | 8.6 | 17.3 | 7.6 | 20.4 | 7.0 | 16.1 | 7.7 | 6.9 | 6.9 | 5.3 |
| 2011-03-22 | 7.7 | 13.1 | 8.4 | 17.0 | 7.8 | 19.3 | 7.0 | 15.0 | 7.6 | 7.7 | 7.0 | 6.4 |
| 2011-03-29 | 7.7 | 12.8 | 8.3 | 17.9 | 7.7 | 19.2 | 7.0 | 14.8 | 8.4 | 8.7 | 7.5 | 7.5 |
| 2011-04-05 | 7.8 | 13.2 | 8.1 | 17.4 | 6.1 | 18.2 | 7.0 | 14.2 | 7.8 | 8.8 | 7.0 | 7.9 |
| 2011-04-12 | 7.4 | 12.8 | 8.5 | 15.5 | 5.7 | 16.7 | 7.1 | 12.8 | 8.1 | 8.9 | 6.9 | 8.0 |
| 2011-04-19 | 7.4 | 11.9 | 8.9 | 14.4 | 4.9 | 17.0 | 7.1 | 13.9 | 10.4 | 9.6 | 6.6 | 8.8 |
| 2011-04-26 | 7.7 | 12.6 | 8.6 | 12.2 | 4.6 | 15.9 | 7.1 | 13.9 | 10.2 | 10.1 | 6.6 | 9.2 |
| 2011-05-03 | 7.6 | 12.5 | 8.9 | 12.9 | 6.6 | 17.0 | 7.0 | 16.0 | 10.1 | 11.6 | 7.2 | 10.9 |
| 2011-05-10 | 8.0 | 14.2 | 7.5 | 16.6 | 5.8 | 20.5 | 7.0 | 20.5 | 7.8 | 14.2 | 7.6 | 12.5 |
| 2011-05-17 | 7.3 | 17.8 | 8.3 | 18.3 | 8.1 | 22.1 | 7.0 | 21.4 | 7.7 | 14.1 | 9.3 | 12.2 |
| 2011-05-24 | 8.0 | 18.5 | 8.3 | 21.5 | 9.1 | 25.0 | 6.9 | 23.3 | 5.8 | 13.4 | 9.5 | 10.9 |
| 2011-05-31 | 7.9 | 19.7 | 8.1 | 22.6 | 7.8 | 26.1 | 7.0 | 23.5 | 5.3 | 12.3 | 8.5 | 9.2 |
| 2011-06-07 | 7.6 | 19.7 | 9.3 | 20.3 | 9.6 | 23.1 | 7.0 | 21.0 | 5.8 | 9.6 | 8.2 | 6.9 |
| 2011-06-14 | 8.3 | 17.0 | 8.4 | 20.3 | 7.8 | 22.3 | 7.0 | 20.9 | 4.6 | 9.0 | 6.8 | 6.3 |
| 2011-06-21 | 7.5 | 16.5 | 8.6 | 20.3 | 8.2 | 20.9 | 7.1 | 20.7 | 5.9 | 9.4 | 7.0 | 7.0 |
| 2011-06-28 | 7.8 | 16.3 | 8.3 | 20.5 | 9.9 | 19.0 | 7.0 | 20.3 | 6.6 | 8.5 | 8.4 | 6.3 |
| 2011-07-05 | 8.4 | 15.5 | 8.5 | 20.8 | 9.4 | 19.6 | 7.1 | 21.0 | 6.7 | 8.7 | 7.9 | 6.1 |
| 2011-07-12 | 8.2 | 15.9 | 8.3 | 20.6 | 9.5 | 20.2 | 7.1 | 21.6 | 6.8 | 9.7 | 7.2 | 6.7 |
| 2011-07-19 | 8.1 | 16.4 | 8.2 | 19.8 | 8.8 | 21.0 | 7.0 | 22.2 | 6.1 | 10.3 | 6.9 | 7.3 |
| 2011-07-26 | 7.6 | 16.9 | 8.1 | 19.7 | 7.7 | 22.5 | 7.1 | 23.0 | 5.3 | 11.4 | 6.7 | 8.5 |
| 2011-08-02 | 7.2 | 17.8 | 7.7 | 20.5 | 7.7 | 23.9 | 6.9 | 24.1 | 5.4 | 12.7 | 7.2 | 10.1 |
| 2011-08-09 | 7.1 | 18.9 | 7.5 | 22.0 | 9.3 | 24.1 | 6.9 | 24.5 | 7.1 | 12.4 | 9.2 | 10.0 |
| 2011-08-16 | 7.8 | 19.1 | 6.8 | 23.4 | 9.4 | 24.4 | 6.8 | 25.3 | 7.3 | 12.5 | 7.9 | 10.0 |
| 2011-08-23 | 7.8 | 19.6 | 6.5 | 24.5 | 8.7 | 25.5 | 6.8 | 25.8 | 7.6 | 12.3 | 7.6 | 9.7 |
| 2011-08-30 | 7.7 | 20.1 | 6.6 | 24.8 | 8.3 | 25.3 | 6.9 | 25.2 | 6.6 | 11.9 | 7.2 | 9.1 |
| 2011-09-06 | 7.5 | 19.7 | 6.5 | 24.6 | 6.4 | 25.8 | 6.9 | 25.2 | 4.4 | 12.0 | 5.8 | 9.4 |
| 2011-09-13 | 6.7 | 19.9 | 6.8 | 24.4 | 6.2 | 25.5 | 7.0 | 24.0 | 4.4 | 11.2 | 7.8 | 8.9 |
| 2011-09-20 | 6.8 | 19.2 | 7.2 | 25.1 | 7.5 | 24.1 | 6.9 | 22.7 | 4.7 | 10.5 | 8.1 | 8.3 |
| 2011-09-27 | 7.3 | 18.2 | 6.8 | 27.8 | 7.2 | 24.7 | 6.9 | 23.4 | 6.5 | 9.4 | 8.5 | 7.4 |
| 2011-10-04 | 7.6 | 18.4 | 7.0 | 29.0 | 6.9 | 24.2 | 6.9 | 22.7 | 7.8 | 9.0 | 8.2 | 6.7 |
| 2011-10-11 | 8.0 | 17.9 | 6.7 | 29.5 | 6.8 | 24.0 | 6.9 | 21.9 | 7.4 | 8.9 | 6.6 | 6.5 |
| 2011-10-18 | 7.7 | 17.6 | 7.0 | 29.0 | 6.7 | 23.5 | 6.9 | 21.5 | 6.8 | 9.3 | 6.5 | 6.9 |
| 2011-10-25 | 7.5 | 17.4 | 7.2 | 26.5 | 7.4 | 21.1 | 6.8 | 18.6 | 5.6 | 9.1 | 7.1 | 7.0 |
| 2011-11-01 | 7.4 | 15.7 | 7.3 | 23.8 | 7.7 | 19.0 | 6.8 | 16.6 | 4.9 | 8.6 | 7.7 | 6.4 |
| 2011-11-08 | 7.4 | 14.2 | 7.2 | 22.4 | 7.0 | 17.8 | 6.4 | 15.8 | 5.6 | 8.3 | 7.9 | 6.0 |
| 2011-11-15 | 7.3 | 13.4 | 7.5 | 19.5 | 7.2 | 15.0 | 7.0 | 13.1 | 7.2 | 7.1 | 8.4 | 4.8 |
| 2011-11-22 | 7.4 | 11.2 | 7.4 | 16.7 | 6.9 | 12.8 | 6.9 | 11.8 | 8.2 | 6.5 | 8.3 | 3.8 |
| 2011-11-29 | 7.0 | 10.1 | 6.6 | 14.6 | 6.6 | 10.7 | 6.8 | 10.6 | 8.2 | 6.3 | 7.6 | 3.4 |
| 2011-12-06 | 7.1 | 8.9 | 6.9 | 12.3 | 6.7 | 9.2 | 7.2 | 9.3 | 8.8 | 6.1 | 7.5 | 3.3 |
| 2011-12-13 | 7.3 | 7.6 | 6.2 | 12.2 | 6.0 | 10.1 | 6.6 | 10.3 | 6.7 | 6.7 | 6.8 | 3.7 |
| 2011-12-20 | 6.8 | 8.0 | 6.2 | 12.4 | 4.6 | 11.5 | 6.8 | 11.0 | 5.3 | 6.7 | 6.7 | 4.0 |
| 2011-12-27 | 6.4 | 9.1 | 6.8 | 14.0 | 4.3 | 13.5 | 7.0 | 12.6 | 3.7 | 7.3 | 6.5 | 4.8 |
| 2012-01-03 | 6.1 | 10.4 | 6.9 | 14.1 | 4.6 | 13.9 | 6.9 | 13.0 | 1.9 | 7.1 | 7.3 | 4.4 |
| 2012-01-10 | 6.1 | 11.3 | 6.4 | 14.9 | 3.0 | 14.2 | 6.7 | 13.8 | 3.7 | 7.5 | 7.1 | 5.0 |
| 2012-01-17 | 6.5 | 11.8 | 6.4 | 15.4 | 4.0 | 14.1 | 6.9 | 14.5 | 5.1 | 8.7 | 7.2 | 6.0 |
| 2012-01-24 | 7.3 | 11.5 | 6.3 | 15.1 | 5.0 | 13.6 | 7.0 | 14.9 | 7.5 | 9.1 | 8.3 | 6.5 |
| 2012-01-31 | 7.6 | 12.3 | 6.7 | 16.6 | 5.0 | 15.0 | 7.4 | 17.3 | 8.0 | 10.6 | 8.2 | 8.1 |
| 2012-02-07 | 7.2 | 13.6 | 6.8 | 16.6 | 5.2 | 16.5 | 7.4 | 18.9 | 6.2 | 10.6 | 8.4 | 8.2 |
| 2012-02-14 | 7.0 | 15.2 | 6.8 | 17.4 | 4.8 | 17.9 | 7.3 | 20.8 | 6.1 | 10.3 | 7.8 | 8.4 |
| 2012-02-21 | 6.6 | 16.2 | 6.9 | 18.5 | 3.9 | 18.6 | 7.5 | 21.4 | 5.1 | 10.1 | 7.9 | 8.7 |
| 2012-02-28 | 6.8 | 16.9 | 6.8 | 19.3 | 3.9 | 17.7 | 7.3 | 20.3 | 6.5 | 8.8 | 8.0 | 8.2 |
| 2012-03-06 | 7.1 | 15.4 | 7.2 | 22.2 | 4.9 | 18.9 | 7.3 | 21.6 | 6.7 | 7.7 | 8.1 | 7.9 |
| 2012-03-13 | 7.3 | 16.2 | 7.5 | 26.6 | 5.6 | 22.4 | 7.4 | 23.8 | 6.9 | 6.9 | 8.4 | 7.6 |
| 2012-03-20 | 7.5 | 18.1 | 7.5 | 31.2 | 6.0 | 26.7 | 7.2 | 27.6 | 7.8 | 6.4 | 8.0 | 7.3 |
| 2012-03-27 | 6.9 | 20.1 | 7.1 | 36.2 | 5.6 | 31.9 | 6.9 | 32.5 | 6.3 | 6.9 | 8.0 | 7.7 |
| 2012-04-03 | 6.8 | 24.3 | 6.8 | 39.0 | 4.8 | 34.7 | 6.7 | 35.3 | 7.8 | 8.7 | 7.6 | 9.6 |
| 2012-04-10 | 7.1 | 25.8 | 7.1 | 38.3 | 5.8 | 34.4 | 6.8 | 36.2 | 7.4 | 10.4 | 8.4 | 11.4 |
| 2012-04-17 | 7.5 | 26.2 | 7.5 | 37.4 | 7.2 | 33.9 | 7.0 | 36.6 | 6.9 | 12.1 | 8.8 | 13.1 |
| 2012-04-24 | 8.0 | 25.7 | 7.4 | 34.4 | 9.0 | 31.8 | 6.7 | 34.9 | 7.6 | 12.4 | 10.0 | 13.3 |
| 2012-05-01 | 9.3 | 23.3 | 7.8 | 31.6 | 11.0 | 28.9 | 7.0 | 32.0 | 6.5 | 12.6 | 9.8 | 12.6 |
| 2012-05-08 | 8.7 | 21.7 | 7.2 | 31.0 | 10.5 | 27.3 | 6.9 | 29.5 | 6.6 | 12.0 | 9.8 | 11.3 |
| 2012-05-15 | 8.4 | 20.7 | 6.8 | 32.0 | 9.7 | 26.3 | 6.6 | 27.5 | 6.8 | 11.2 | 9.2 | 10.1 |
| 2012-05-22 | 8.0 | 20.6 | 7.0 | 33.2 | 8.6 | 26.3 | 7.0 | 27.0 | 5.9 | 11.4 | 7.8 | 9.7 |
| 2012-05-29 | 8.1 | 20.5 | 6.2 | 37.0 | 7.4 | 28.4 | 6.8 | 28.0 | 7.0 | 12.0 | 7.8 | 10.1 |
| 2012-06-05 | 8.0 | 21.8 | 6.1 | 38.6 | 7.1 | 30.0 | 6.5 | 28.5 | 6.3 | 13.2 | 7.6 | 10.9 |
| 2012-06-12 | 7.5 | 22.8 | 6.2 | 37.9 | 7.0 | 30.9 | 6.7 | 27.8 | 6.2 | 14.0 | 7.9 | 11.5 |
| 2012-06-19 | 7.8 | 23.3 | 6.7 | 38.0 | 6.3 | 32.5 | 6.7 | 27.5 | 8.0 | 15.3 | 8.3 | 12.9 |
| 2012-06-26 | 7.6 | 23.7 | 6.8 | 35.7 | 6.8 | 32.5 | 6.6 | 26.5 | 6.9 | 15.2 | 8.4 | 12.9 |
| 2012-07-03 | 7.3 | 23.7 | 7.0 | 34.9 | 6.5 | 33.0 | 6.1 | 27.0 | 6.6 | 14.8 | 7.3 | 12.1 |
| 2012-07-10 | 7.0 | 24.5 | 6.6 | 35.3 | 6.3 | 34.4 | 5.3 | 29.0 | 7.4 | 14.7 | 6.4 | 11.8 |
| 2012-07-17 | 6.6 | 25.8 | 5.9 | 34.9 | 7.0 | 34.0 | 4.9 | 30.9 | 6.3 | 14.0 | 6.2 | 10.7 |
| 2012-07-24 | 7.1 | 25.9 | 6.7 | 35.0 | 6.6 | 34.6 | 5.4 | 32.5 | 7.7 | 13.6 | 6.9 | 10.3 |
| 2012-07-31 | 7.6 | 26.1 | 6.6 | 34.3 | 6.2 | 34.6 | 5.8 | 33.3 | 9.0 | 13.4 | 7.5 | 10.4 |
| 2012-08-07 | 7.5 | 26.6 | 6.8 | 32.0 | 5.3 | 33.2 | 6.3 | 32.7 | 8.1 | 13.5 | 7.6 | 9.9 |
| 2012-08-14 | 7.6 | 25.4 | 7.1 | 30.2 | 5.5 | 32.4 | 6.7 | 31.2 | 8.2 | 13.0 | 8.4 | 9.3 |
| 2012-08-21 | 7.2 | 24.5 | 7.1 | 27.9 | 6.1 | 30.7 | 6.3 | 29.3 | 6.9 | 12.8 | 8.4 | 8.8 |
| 2012-08-28 | 6.5 | 23.9 | 7.1 | 26.4 | 6.0 | 30.0 | 5.8 | 28.8 | 5.8 | 13.6 | 8.2 | 9.9 |
| 2012-09-04 | 6.5 | 22.7 | 7.1 | 25.2 | 6.5 | 29.7 | 5.5 | 27.9 | 6.1 | 13.4 | 9.6 | 10.9 |
| 2012-09-11 | 5.6 | 23.3 | 7.0 | 23.6 | 5.3 | 29.3 | 4.8 | 28.3 | 4.2 | 15.9 | 8.4 | 13.5 |
| 2012-09-18 | 6.1 | 23.3 | 7.2 | 22.8 | 5.9 | 30.1 | 5.4 | 28.8 | 4.8 | 17.3 | 9.0 | 15.8 |
| 2012-09-25 | 6.5 | 22.9 | 7.0 | 22.3 | 6.2 | 30.4 | 5.7 | 27.6 | 5.4 | 16.4 | 8.8 | 16.4 |
| 2012-10-02 | 5.9 | 24.2 | 6.3 | 23.3 | 6.0 | 31.2 | 5.3 | 28.3 | 4.3 | 18.7 | 7.0 | 18.5 |
| 2012-10-09 | 6.6 | 23.8 | 5.7 | 25.6 | 6.9 | 31.1 | 5.4 | 27.5 | 6.1 | 17.4 | 8.4 | 17.9 |
| 2012-10-16 | 6.7 | 22.9 | 4.7 | 26.6 | 7.3 | 29.3 | 5.2 | 26.3 | 6.8 | 15.7 | 8.0 | 16.6 |
| 2012-10-23 | 7.5 | 20.4 | 5.1 | 24.4 | 9.1 | 25.9 | 5.5 | 23.7 | 7.2 | 14.0 | 9.3 | 14.3 |
| 2012-10-30 | 8.5 | 17.2 | 5.5 | 21.6 | 11.4 | 22.0 | 5.5 | 20.9 | 8.6 | 10.3 | 9.3 | 10.3 |
| 2012-11-06 | 8.3 | 14.8 | 5.1 | 18.7 | 12.4 | 20.3 | 5.1 | 20.8 | 7.9 | 9.6 | 8.5 | 8.6 |
| 2012-11-13 | 7.3 | 15.1 | 5.4 | 17.2 | 11.5 | 19.3 | 4.6 | 21.7 | 5.2 | 10.4 | 6.7 | 8.7 |
| 2012-11-20 | 6.3 | 16.8 | 5.1 | 18.2 | 9.4 | 20.0 | 4.1 | 24.4 | 4.7 | 10.8 | 6.1 | 8.9 |
| 2012-11-27 | 6.0 | 17.2 | 5.0 | 18.7 | 7.3 | 21.2 | 4.9 | 25.5 | 4.4 | 10.8 | 7.4 | 8.9 |
| 2012-12-04 | 6.2 | 17.2 | 4.8 | 20.1 | 5.8 | 21.8 | 5.8 | 25.7 | 5.5 | 9.9 | 7.5 | 8.6 |
| 2012-12-11 | 6.5 | 16.3 | 4.3 | 19.3 | 5.5 | 21.0 | 6.1 | 24.0 | 6.9 | 7.9 | 9.1 | 6.3 |
| 2012-12-18 | 6.7 | 16.6 | 3.6 | 23.2 | 5.8 | 24.0 | 7.1 | 27.1 | 6.5 | 7.8 | 8.0 | 6.0 |
| 2012-12-25 | 6.4 | 17.7 | 3.0 | 25.6 | 5.8 | 24.4 | 6.8 | 28.8 | 5.4 | 7.5 | 7.4 | 5.8 |
| 2013-01-01 | 6.2 | 18.6 | 2.8 | 25.9 | 6.1 | 23.1 | 7.1 | 28.9 | 3.6 | 7.3 | 7.7 | 5.6 |
| 2013-01-08 | 6.4 | 19.0 | 2.7 | 24.5 | 6.0 | 19.8 | 7.1 | 27.6 | 4.4 | 8.0 | 7.5 | 6.6 |
| 2013-01-15 | 6.5 | 17.5 | 3.5 | 22.2 | 5.9 | 16.3 | 6.8 | 25.5 | 4.6 | 8.2 | 8.5 | 7.2 |
| 2013-01-22 | 6.9 | 15.6 | 4.4 | 20.2 | 6.3 | 14.3 | 7.0 | 23.9 | 5.5 | 8.3 | 8.5 | 7.6 |
| 2013-01-29 | 6.9 | 15.0 | 4.2 | 16.8 | 5.8 | 11.0 | 6.5 | 20.7 | 7.7 | 8.4 | 7.6 | 7.9 |
| 2013-02-05 | 7.0 | 14.6 | 4.2 | 18.2 | 6.4 | 12.3 | 6.8 | 21.1 | 8.1 | 9.5 | 7.1 | 9.2 |
| 2013-02-12 | 6.8 | 16.2 | 3.4 | 22.2 | 6.4 | 16.1 | 6.9 | 23.6 | 7.8 | 9.4 | 7.1 | 9.1 |
| 2013-02-19 | 6.4 | 18.5 | 2.4 | 25.6 | 6.2 | 19.9 | 6.8 | 25.7 | 7.0 | 11.0 | 7.4 | 10.8 |
| 2013-02-26 | 6.6 | 20.8 | 3.4 | 31.1 | 6.3 | 26.0 | 7.0 | 30.0 | 6.3 | 13.7 | 8.6 | 13.6 |
| 2013-03-05 | 6.7 | 22.7 | 4.7 | 32.0 | 5.2 | 27.8 | 7.0 | 30.1 | 6.7 | 13.9 | 9.3 | 14.0 |
| 2013-03-12 | 6.8 | 23.3 | 5.8 | 32.1 | 4.7 | 28.9 | 7.1 | 29.7 | 6.8 | 14.3 | 9.0 | 14.6 |
| 2013-03-19 | 7.2 | 23.1 | 7.0 | 31.5 | 5.1 | 29.1 | 7.4 | 29.4 | 6.8 | 12.3 | 9.1 | 12.8 |
| 2013-03-26 | 7.5 | 21.7 | 7.3 | 27.8 | 6.0 | 26.5 | 7.8 | 26.4 | 6.7 | 12.3 | 9.0 | 12.9 |
| 2013-04-02 | 7.1 | 20.9 | 6.9 | 26.5 | 6.4 | 25.8 | 7.5 | 25.6 | 5.2 | 12.6 | 8.4 | 12.9 |
| 2013-04-09 | 7.3 | 19.4 | 6.8 | 24.2 | 7.4 | 23.6 | 6.8 | 24.1 | 5.7 | 13.2 | 9.2 | 12.6 |
| 2013-04-16 | 7.8 | 17.9 | 6.9 | 22.7 | 7.7 | 21.6 | 6.7 | 22.2 | 7.2 | 11.6 | 10.1 | 10.5 |
| 2013-04-23 | 7.9 | 17.6 | 7.0 | 23.6 | 7.3 | 22.4 | 6.6 | 22.5 | 8.4 | 12.6 | 9.5 | 11.1 |
| 2013-04-30 | 8.2 | 17.6 | 7.2 | 24.1 | 7.4 | 22.9 | 6.8 | 22.2 | 9.5 | 12.2 | 9.2 | 10.6 |
| 2013-05-07 | 7.8 | 17.9 | 6.8 | 24.4 | 5.6 | 23.0 | 6.9 | 20.1 | 9.9 | 12.1 | 8.3 | 10.3 |
| 2013-05-14 | 7.4 | 19.2 | 6.7 | 27.0 | 4.4 | 25.1 | 6.9 | 19.3 | 10.2 | 12.4 | 7.8 | 10.2 |
| 2013-05-21 | 6.6 | 20.7 | 6.3 | 29.2 | 4.1 | 28.2 | 7.0 | 19.6 | 7.7 | 13.4 | 7.6 | 10.7 |
| 2013-05-28 | 6.7 | 21.3 | 6.3 | 31.3 | 5.4 | 32.2 | 7.0 | 20.8 | 6.9 | 13.8 | 8.1 | 10.9 |
| 2013-06-04 | 7.0 | 22.6 | 6.6 | 31.4 | 7.2 | 35.6 | 7.2 | 22.0 | 6.3 | 13.7 | 8.4 | 11.2 |
| 2013-06-11 | 7.3 | 23.3 | 6.8 | 29.9 | 8.5 | 36.8 | 7.2 | 22.9 | 6.4 | 13.9 | 8.1 | 11.8 |
| 2013-06-04 | 7.0 | 22.6 | 6.6 | 31.4 | 7.2 | 35.6 | 7.2 | 22.0 | 6.3 | 13.7 | 8.4 | 11.2 |
| 2013-06-11 | 7.3 | 23.3 | 6.8 | 29.9 | 8.5 | 36.8 | 7.2 | 22.9 | 6.4 | 13.9 | 8.1 | 11.8 |
| 2013-06-18 | 8.5 | 22.7 | 7.5 | 29.4 | 9.9 | 36.5 | 7.4 | 23.5 | 9.0 | 13.0 | 8.2 | 11.5 |
| 2013-06-25 | 8.7 | 22.2 | 7.5 | 29.0 | 10.4 | 34.3 | 7.6 | 23.4 | 8.8 | 12.4 | 8.3 | 11.5 |
| 2013-07-02 | 8.8 | 21.4 | 7.8 | 27.3 | 10.9 | 29.8 | 7.7 | 21.4 | 7.7 | 11.7 | 8.1 | 11.0 |
| 2013-07-09 | 8.6 | 21.3 | 7.6 | 27.5 | 10.8 | 26.9 | 7.5 | 21.2 | 7.5 | 12.1 | 7.2 | 11.7 |
| 2013-07-16 | 7.9 | 19.3 | 7.3 | 24.9 | 9.3 | 21.9 | 7.2 | 18.2 | 6.3 | 12.1 | 6.9 | 11.9 |
| 2013-07-23 | 7.8 | 18.3 | 8.0 | 23.9 | 8.0 | 20.3 | 7.0 | 17.8 | 7.0 | 12.7 | 7.4 | 12.5 |
| 2013-07-30 | 7.9 | 17.5 | 8.2 | 24.0 | 7.4 | 19.6 | 7.1 | 18.0 | 8.0 | 14.0 | 8.0 | 13.8 |
| 2013-08-06 | 7.6 | 17.4 | 8.2 | 23.6 | 6.2 | 19.4 | 6.9 | 18.2 | 7.1 | 14.5 | 9.0 | 14.4 |
| 2013-08-13 | 7.8 | 16.4 | 8.4 | 22.8 | 6.2 | 18.9 | 7.2 | 17.9 | 6.8 | 13.4 | 9.7 | 13.2 |
| 2013-08-20 | 7.9 | 16.1 | 8.0 | 23.0 | 6.9 | 18.6 | 7.3 | 17.8 | 6.6 | 12.7 | 8.8 | 12.7 |
| 2013-08-27 | 7.8 | 16.2 | 8.0 | 20.5 | 6.8 | 16.7 | 7.4 | 16.4 | 6.6 | 11.3 | 8.0 | 11.5 |
| 2013-09-03 | 7.9 | 15.2 | 8.1 | 19.5 | 7.2 | 16.4 | 7.3 | 16.5 | 6.9 | 11.4 | 8.1 | 11.7 |
| 2013-09-10 | 8.0 | 14.6 | 7.8 | 18.9 | 7.6 | 16.7 | 7.3 | 17.3 | 7.5 | 10.4 | 8.8 | 10.8 |
| 2013-09-17 | 8.2 | 14.0 | 7.6 | 17.7 | 7.1 | 15.6 | 7.9 | 16.7 | 7.2 | 9.1 | 9.1 | 9.4 |
| 2013-09-24 | 8.6 | 12.7 | 7.2 | 19.3 | 7.8 | 17.1 | 8.1 | 18.0 | 7.8 | 9.1 | 9.7 | 9.4 |
| 2013-10-01 | 8.8 | 12.1 | 7.0 | 18.4 | 8.4 | 16.3 | 8.6 | 16.8 | 7.4 | 7.3 | 9.2 | 7.9 |
Source: NRCan
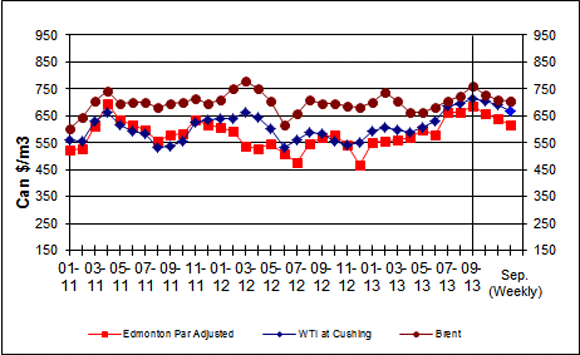
Crude Oil Overview
Drop in Global Crude Oil Prices
For the week ending September 27, 2013, prices for the three marker crudes averaged between $617/m3 and $703/m3 (US$95 to US$109 per barrel). All crude prices trended downward since the last report two weeks ago. WTI and Edmonton Par closed the week at levels experienced in June 2013.
This is a decrease for WTI and Edmonton Par of $24/m3 and $20/m3 (US$3 and US$4 per barrel), respectively. Brent declined marginally by $4/m3 (US$1 per barrel) compared to the previous week.
Increased U.S. crude oil inventories contributed to lower WTI crude oil prices. However, Brent crude oil prices have been affected by certain risk factors, the so-called oil premium, which causes market uncertainty as negotiations between the international community and Syria continue and the Egyptian conflict remains volatile.
Partially offsetting the risk premium on oil prices is the Organization of Petroleum Exporting Countries’ (OPEC) high oil spare capacity. Some analysts estimate that OPEC’s spare oil capacity, an indicator of long-term crude oil prices, is nearing August 2008 levels when prices peaked above $140 per barrel. OPEC’s target for oil production remains at 30 million barrels per day.
Figure 6: Crude Oil Price Comparisons
text version - Figure 6
This graph shows crude oil prices for Edmonton Par, WTI and Brent. The average weekly prices for the period ending September 27, 2013, were $617/cubic metres, $668/cubic metres and $703/cubic metres for Edmonton Par, WTI and Brent, respectively.
| Dates | Edmonton Par Prices | WTI Prices | Brent Prices |
|---|---|---|---|
| 01/11 | 525.08 | 559.18 | 601.95 |
| 02/11 | 525.75 | 556.16 | 645.23 |
| 03/11 | 609.96 | 632.59 | 703.16 |
| 04/11 | 696.77 | 662.59 | 741.59 |
| 05/11 | 634.91 | 617.17 | 697.06 |
| 06/11 | 614.21 | 591.76 | 699.64 |
| 07/11 | 599.18 | 585.28 | 701.96 |
| 08/11 | 554.74 | 533.58 | 679.51 |
| 09/11 | 578.01 | 538.55 | 696.18 |
| 10/11 | 585.88 | 554.72 | 702.66 |
| 11/11 | 636.41 | 627.49 | 713.92 |
| 12/11 | 615.54 | 633.97 | 693.85 |
| 01/12 | 608.11 | 639.88 | 709.45 |
| 02/12 | 594.50 | 640.89 | 750.59 |
| 03/12 | 538.60 | 663.34 | 780.71 |
| 04/12 | 528.21 | 644.60 | 751.91 |
| 05/12 | 548.81 | 601.64 | 704.10 |
| 06/12 | 507.78 | 532.76 | 618.43 |
| 07/12 | 477.07 | 560.69 | 659.07 |
| 08/12 | 544.82 | 587.49 | 707.75 |
| 09/12 | 570.15 | 582.08 | 697.56 |
| 10/12 | 578.61 | 555.66 | 694.60 |
| 11/12 | 539.87 | 543.52 | 686.30 |
| 12/12 | 467.14 | 549.56 | 680.33 |
| 01/13 | 549.97 | 592.14 | 699.83 |
| 02/13 | 553.76 | 605.29 | 736.06 |
| 03/13 | 560.66 | 598.93 | 705.36 |
| 04/13 | 571.20 | 590.06 | 663.78 |
| 05/13 | 598.81 | 608.31 | 662.59 |
| 06/13 | 577.25 | 630.51 | 680.52 |
| 07/13 | 664.03 | 685.36 | 703.73 |
| 08/13 | 665.21 | 697.44 | 722.47 |
| September 6, 2013 | 685.34 | 716.04 | 761.04 |
| September 13, 2013 | 660.64 | 704.37 | 729.77 |
| September 20, 2013 | 637.44 | 692.08 | 707.79 |
| September 27, 2013 | 617.37 | 667.59 | 703.46 |
| Crude Oil Types | Week Ending: 2013-09-27 | Change From: | ||||
|---|---|---|---|---|---|---|
| Previous Week | Last Year | |||||
| $Can/m3 | $US/bbl | $Can/m3 | $US/bbl | $Can/m3 | $US/bbl | |
| Edmonton Par | 617.37 | 95.31 | -20.07 | -3.19 | +65.07 | +5.82 |
| WTI | 667.59 | 103.06 | -24.49 | -3.88 | +102.66 | +11.53 |
| Brent | 703.46 | 108.59 | -4.33 | -0.78 | +12.70 | -3.32 |
Source: NRCan
Petroleum Refining
Petroleum molecules come in a wide variety of sizes and shapes. The methane in natural gas is the simplest and smallest. By comparison, the molecules in lubricants, heavy fuel oil and asphalt are large and complex. These molecules are sorted, split apart, reassembled and blended at refineries and petrochemical plants. There, they become part of a multitude of products, from gasoline to synthetic rubber. This is accomplished by physical separation and chemical reactions.
As a raw product, crude oil is of limited use. Refineries must separate and process the mix of hydrocarbons that make up crude oil before they can be transformed into hundreds of useful products such as gasoline, diesel and jet fuel. The synthetic crude oil from Canada’s oil sands is partially processed hydrocarbon blends suitable for processing in crude refinery units.
About three-quarters of the volume of crude oil processed at Canadian refineries are converted into transportation fuels. There are both technological and economic challenges in reformulating fuels to meet ever-more-stringent environmental requirements. So far, there do not appear to be any perfect solutions. For example, ethanol reduces hydrocarbon and carbon monoxide emissions, but it has lower energy content per litre, and may increase emissions of nitrogen oxides and other substances.
Source: The Canadian Centre for Energy Information, Our Petroleum Challenge, pp. 97-100, and NRCan.
Download the report
Fuel Focus - Printable Version [PDF, 689 KB]
To read Adobe Acrobat® files, you will need to download and install the free Acrobat Reader® software available from Adobe Systems Incorporated.
Page details
- Date modified: