Fuel Focus, January 25, 2013
Table of Contents
- National Overview
- Recent Developments
- Retail Gasoline Overview
- Wholesale Gasoline Prices
- Gasoline Refining and Marketing Margins
- Crude Oil Overview
- Download the report
National Overview
Canadian Retail Gasoline Prices Increased 1 Cent per Litre from Last Week
For the week ending January 22, 2013, the Canadian average retail gasoline price was $1.20 per litre, up 1 cent per litre from the previous week. This represents a 1 cent-per-litre increase since the beginning of the year. However, compared to last year at this time, average retail pump prices are nearly 4 cents per litre lower.
Diesel fuel prices declined slightly to $1.27 per litre compared to the previous week. This is a decrease of almost 3 cents per litre from the same period last year. Furnace oil prices rose by 2 cents per litre from the previous week to an average of $1.21 per litre.
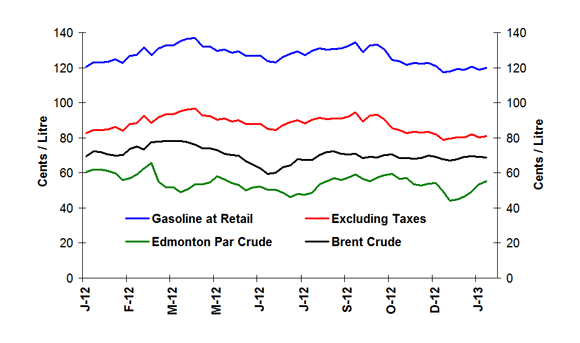
Figure 1: Crude Oil and Regular Gasoline Price Comparison
(National Average)
Text version - Figure 1
The graph shows prices in cents per litre for gasoline at retail, gasoline excluding taxes, and Edmonton Par and Brent crude oil prices. Gasoline prices ended the period of Jan 22, 2013 at 119.7 cents per litre, excluding taxes at 81.1 cents per litre, Edmonton Par at 55.2 cents per litre and Brent at 68.7 cents per litre.
| Dates | Gasoline at retail | Excluding Taxes | Edmonton Par crude | Brent crude |
|---|---|---|---|---|
| 03/01/2012 | 120.6 | 82.7 | 60.5 | 69.6 |
| 10/01/2012 | 122.9 | 84.4 | 61.7 | 72.1 |
| 17/01/2012 | 123.0 | 84.4 | 61.8 | 71.8 |
| 24/01/2012 | 123.3 | 84.8 | 61.0 | 70.4 |
| 31/01/2012 | 124.7 | 86.0 | 59.7 | 69.7 |
| 07/02/2012 | 122.7 | 84.2 | 56.1 | 70.2 |
| 14/02/2012 | 126.7 | 87.8 | 57.1 | 73.6 |
| 21/02/2012 | 127.0 | 88.1 | 58.9 | 75.1 |
| 28/02/2012 | 131.7 | 92.4 | 62.6 | 73.4 |
| 06/03/2012 | 127.3 | 88.5 | 65.6 | 77.5 |
| 13/03/2012 | 131.0 | 91.8 | 54.9 | 77.9 |
| 20/03/2012 | 132.8 | 93.4 | 51.6 | 78.2 |
| 27/03/2012 | 132.7 | 93.3 | 51.7 | 78.1 |
| 03/04/2012 | 135.1 | 95.2 | 48.9 | 78.3 |
| 10/04/2012 | 136.4 | 96.4 | 50.8 | 77.5 |
| 17/04/2012 | 136.7 | 96.7 | 52.9 | 76.2 |
| 24/04/2012 | 132.0 | 92.6 | 53.4 | 73.9 |
| 01/05/2012 | 131.9 | 92.4 | 54.4 | 73.9 |
| 08/05/2012 | 129.5 | 90.3 | 58.1 | 73.0 |
| 15/05/2012 | 130.3 | 91.0 | 56.2 | 70.7 |
| 22/05/2012 | 128.5 | 89.4 | 54.2 | 70.2 |
| 29/05/2012 | 129.3 | 90.1 | 53.0 | 69.9 |
| 05/06/2012 | 126.8 | 88.0 | 50.0 | 66.8 |
| 12/06/2012 | 126.7 | 87.9 | 51.9 | 64.7 |
| 19/06/2012 | 126.8 | 87.9 | 52.1 | 62.6 |
| 26/06/2012 | 123.7 | 85.2 | 50.3 | 59.5 |
| 03/07/2012 | 123.1 | 84.5 | 50.3 | 60.0 |
| 10/07/2012 | 126.0 | 87.1 | 48.8 | 63.1 |
| 17/07/2012 | 128.0 | 88.8 | 46.0 | 64.3 |
| 24/07/2012 | 129.2 | 89.9 | 48.0 | 67.7 |
| 31/07/2012 | 127.3 | 88.2 | 47.6 | 67.4 |
| 07/08/2012 | 129.7 | 90.3 | 48.5 | 67.5 |
| 14/08/2012 | 131.0 | 91.2 | 53.6 | 70.3 |
| 21/08/2012 | 130.3 | 90.5 | 55.1 | 71.8 |
| 28/08/2012 | 130.7 | 90.9 | 56.9 | 72.1 |
| 04/09/2012 | 130.9 | 91.1 | 55.9 | 70.8 |
| 11/09/2012 | 132.2 | 92.2 | 57.3 | 70.4 |
| 18/09/2012 | 134.6 | 94.4 | 59.0 | 71.0 |
| 25/09/2012 | 128.9 | 89.4 | 56.7 | 68.6 |
| 02/10/2012 | 132.8 | 92.8 | 55.3 | 69.1 |
| 09/10/2012 | 133.0 | 93.0 | 57.2 | 68.6 |
| 16/10/2012 | 130.1 | 90.4 | 58.7 | 70.3 |
| 23/10/2012 | 124.3 | 85.3 | 59.6 | 70.5 |
| 30/10/2012 | 123.5 | 84.5 | 56.6 | 68.5 |
| 06/11/2012 | 121.6 | 82.7 | 57.0 | 68.3 |
| 13/11/2012 | 122.5 | 83.5 | 53.5 | 68.0 |
| 20/11/2012 | 122.2 | 83.2 | 52.7 | 68.6 |
| 27/11/2012 | 122.6 | 83.5 | 53.8 | 69.7 |
| 04/12/2012 | 120.9 | 81.9 | 54.2 | 69.0 |
| 11/12/2012 | 117.3 | 78.7 | 49.4 | 67.8 |
| 18/12/2012 | 117.7 | 79.5 | 44.1 | 67.1 |
| 25/12/2012 | 119.0 | 80.3 | 44.8 | 67.7 |
| 01/01/2013 | 118.9 | 80.4 | 46.6 | 69.3 |
| 08/01/2013 | 120.6 | 81.9 | 49.4 | 69.5 |
| 15/01/2013 | 118.9 | 80.3 | 53.7 | 69.2 |
| 22/01/2013 | 119.7 | 81.1 | 55.2 | 68.7 |
Figure 2: Weekly Regular Gasoline Prices

Text version - Figure 2
This graph shows the gasoline price trends from 2011 to 2013.
| 2011 | 2012 | 2013 | |||
|---|---|---|---|---|---|
| Gasoline at Retail | Gasoline at Retail | Gasoline at Retail | |||
| 11-01-04 | 113.30 | 12-01-03 | 120.60 | 13-01-01 | 118.90 |
| 11-01-11 | 113.10 | 12-01-10 | 122.90 | 13-01-08 | 120.60 |
| 11-01-18 | 115.60 | 12-01-17 | 123.00 | 13-01-15 | 118.90 |
| 11-01-25 | 114.90 | 12-01-24 | 123.30 | 13-01-22 | 119.70 |
| 11-02-01 | 113.70 | 12-01-31 | 124.70 | 13-01-29 | |
| 11-02-08 | 112.90 | 12-02-07 | 122.70 | 13-02-05 | |
| 11-02-15 | 114.60 | 12-02-14 | 126.70 | 13-02-12 | |
| 11-02-22 | 115.10 | 12-02-21 | 127.00 | 13-02-19 | |
| 11-03-01 | 120.60 | 12-02-28 | 131.70 | 13-02-26 | |
| 11-03-08 | 124.50 | 12-03-06 | 127.30 | 13-03-05 | |
| 11-03-15 | 123.50 | 12-03-13 | 131.00 | 13-03-12 | |
| 11-03-22 | 121.80 | 12-03-20 | 132.80 | 13-03-19 | |
| 11-03-29 | 125.40 | 12-03-27 | 132.70 | 13-03-26 | |
| 11-04-05 | 127.70 | 12-04-03 | 135.10 | 13-04-02 | |
| 11-04-12 | 129.70 | 12-04-10 | 136.40 | 13-04-09 | |
| 11-04-19 | 133.40 | 12-04-17 | 136.70 | 13-04-16 | |
| 11-04-26 | 133.90 | 12-04-24 | 132.00 | 13-04-23 | |
| 11-05-03 | 135.70 | 12-05-01 | 131.90 | 13-04-30 | |
| 11-05-10 | 135.40 | 12-05-08 | 129.50 | 13-05-07 | |
| 11-05-17 | 130.90 | 12-05-15 | 130.30 | 13-05-14 | |
| 11-05-24 | 127.20 | 12-05-22 | 128.50 | 13-05-21 | |
| 11-05-31 | 129.90 | 12-05-29 | 129.30 | 13-05-28 | |
| 11-06-07 | 127.60 | 12-06-05 | 126.80 | 13-06-04 | |
| 11-06-14 | 127.30 | 12-06-12 | 126.70 | 13-06-11 | |
| 11-06-21 | 126.60 | 12-06-19 | 126.80 | 13-06-18 | |
| 11-06-28 | 124.50 | 12-06-26 | 123.70 | 13-06-25 | |
| 11-07-05 | 125.80 | 12-07-03 | 123.10 | 13-07-02 | |
| 11-07-12 | 127.90 | 12-07-10 | 126.00 | 13-07-09 | |
| 11-07-19 | 128.40 | 12-07-17 | 128.00 | 13-07-16 | |
| 11-07-26 | 128.10 | 12-07-24 | 129.20 | 13-07-23 | |
| 11-08-02 | 128.40 | 12-07-31 | 127.30 | 13-07-30 | |
| 11-08-09 | 125.50 | 12-08-07 | 129.70 | 13-08-06 | |
| 11-08-16 | 126.40 | 12-08-14 | 131.00 | 13-08-13 | |
| 11-08-23 | 126.00 | 12-08-21 | 130.30 | 13-08-20 | |
| 11-08-30 | 128.00 | 12-08-28 | 130.60 | 13-08-27 | |
| 11-09-06 | 128.60 | 12-09-04 | 130.90 | 13-09-03 | |
| 11-09-13 | 127.20 | 12-09-11 | 132.20 | 13-09-10 | |
| 11-09-20 | 124.90 | 12-09-18 | 134.60 | 13-09-17 | |
| 11-09-27 | 123.90 | 12-09-25 | 128.90 | 13-09-24 | |
| 11-10-04 | 123.40 | 12-10-02 | 132.80 | 13-10-01 | |
| 11-10-11 | 125.60 | 12-10-09 | 133.00 | 13-10-08 | |
| 11-10-18 | 126.40 | 12-10-16 | 130.10 | 13-10-15 | |
| 11-10-25 | 124.00 | 12-10-23 | 124.30 | 13-10-22 | |
| 11-11-01 | 121.90 | 12-10-30 | 123.50 | 13-10-29 | |
| 11-11-08 | 124.70 | 12-11-06 | 121.60 | 13-11-05 | |
| 11-11-15 | 123.00 | 12-11-13 | 122.50 | 13-11-12 | |
| 11-11-22 | 120.20 | 12-11-20 | 122.20 | 13-11-19 | |
| 11-11-29 | 119.20 | 12-11-27 | 122.60 | 13-11-26 | |
| 11-12-06 | 120.50 | 12-12-04 | 120.90 | 13-12-03 | |
| 11-12-13 | 118.30 | 12-12-11 | 117.30 | 13-12-10 | |
| 11-12-20 | 116.20 | 12-12-18 | 117.70 | 13-12-17 | |
| 11-12-27 | 119.00 | 12-12-25 | 119.00 | 13-12-24 | |
| 13-12-31 |
| Week of: | Change from: | ||
|---|---|---|---|
| ¢/L | 2013-01-22 | Previous Week | Last Year |
| Gasoline | 119.7 | +0.9 | -3.6 |
| Diesel | 126.8 | -0.2 | -2.5 |
| Furnace Oil | 120.5 | +1.6 | +0.6 |
Source: NRCan
Recent Developments
-
Global Refinery Capacity to Grow Despite Recession: According to a Hart Energy study, major refining capacity expansion projects scheduled for completion within three to five years, totaling 9 million barrels per day (b/d), will add to the global refining distillation capacity surplus. The growth will occur despite recession-related drops in demand for finished fuels in some markets. The capacity surplus narrows when it is defined by refined-product finishing capacity (such as diesel production and desulfurization capacity for 10 part-per-million sulphur for gasoline and distillate fuels). This narrow balance of refining-finishing capacity will keep global refining margins high. (Source: Hart Energy, Global Crude, Refining & Clean Transportation Fuels Outlook to 2035 )
-
Domestic Sales of Refined Products: January to October 2012 sales of petroleum products in Canada were up 1.6 million m3 (+1.8 %) compared to the same ten month period in 2011. Motor gasoline sales totaled 38.6 million m3 from January to October 2012, 1.6 million m3 (+4.5 %) higher than during the same period in 2011. Diesel fuel oil sales totaled 25.3 million m3 in the first ten months of 2012, 338 thousand m3 (+1.4 %) higher than for the same period last year. (Source: NRCan and Statistics Canada)
- Seaway Crude Oil Pipeline: The 500-mile, 30-inch diameter pipeline between Cushing, Oklahoma and the Gulf Coast is now in service, with approximately 400,000 barrels per day of capacity now available to shippers. In addition to the pipeline that transports crude oil from Cushing to the Gulf Coast, the Seaway system is comprised of a terminal and distribution network originating in Texas City, Texas, which serves refineries locally and in the Houston area. (Source: Seaway Crude Pipeline Company LLC )
Retail Gasoline Overview
The four-week average Canadian pump price in selected cities across Canada was $1.19 per litre for the period ending January 22, 2013. This represents an 3 cent-per-litre decrease compared to the same period in 2012.
For the period ending January 22, 2013, the overall four-week average crude oil price increased by 3 cents per litre to 58 cents per litre compared to two weeks ago.
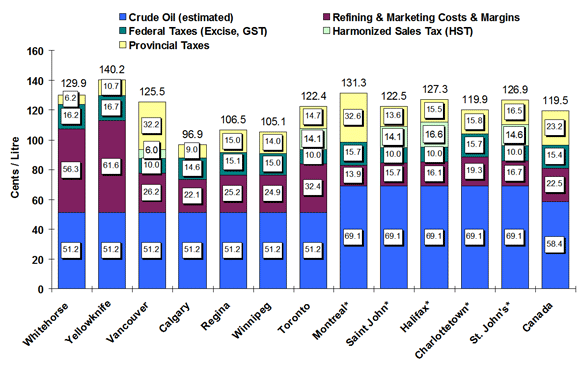
Retail gasoline prices in Western centres (Vancouver to Winnipeg) ranged from 97 cents per litre to $1.26 per litre while prices in Eastern centres (Toronto to St. John’s) ranged from $1.20 to $1.31 per litre.
Refining and marketing costs and margins registered 23 cents per litre, a decrease of 3 cents per litre from two weeks ago. Margins are 4 cents per litre higher than last year at this time.
Figure 3: Regular Gasoline Pump Prices in Selected Cities
Four-Week Average (January 1 to 22, 2013)
Text version - Figure 3
This graph shows the gasoline price components for 2 territories and 10 cities plus the national average.
| ENG | Whitehorse | Yellowknife | Vancouver | Calgary | Regina | Winnipeg | Toronto | Montreal* | Saint John* | Halifax* | Charlottetown* | St. John's* | Canada |
|---|---|---|---|---|---|---|---|---|---|---|---|---|---|
| Pump Price | 129.9 | 140.2 | 125.5 | 96.9 | 106.5 | 105.1 | 122.4 | 131.3 | 122.5 | 127.3 | 119.9 | 126.9 | 119.5 |
| Crude (est.) | 51.2 | 51.2 | 51.2 | 51.2 | 51.2 | 51.2 | 51.2 | 69.1 | 69.1 | 69.1 | 69.1 | 69.1 | 58.4 |
| Federal Taxes | 16.2 | 16.7 | 10.0 | 14.6 | 15.1 | 15.0 | 10.0 | 15.7 | 10.0 | 10.0 | 15.7 | 10.0 | 15.4 |
| Provincial Tax | 6.2 | 10.7 | 32.2 | 9.0 | 15.0 | 14.0 | 14.7 | 32.6 | 13.6 | 15.5 | 15.8 | 16.5 | 23.2 |
| HST | 6.0 | 14.1 | 14.1 | 16.6 | 14.6 | ||||||||
| Refining & Marketing Costs & Margins | 56.3 | 61.6 | 26.2 | 22.1 | 25.2 | 24.9 | 32.4 | 13.9 | 15.7 | 16.1 | 19.3 | 16.7 | 22.5 |
Source: NRCan
* Regulated Markets
Gasoline Prices Vary Across Canada
Many factors contribute to retail gasoline price movements, including crude oil price changes, changes in the cost to transform crude oil into gasoline (refining margins); changes in costs to operate the local gasoline outlet (marketing margins); and changes in taxes to provincial, federal and sometimes to municipal governments.
Natural Resources Canada collects data on retail gasoline (regular, mid-grade and premium as well as the average Canadian pump price) for 60 selected centres (cities) in ten provinces and two territories, every Tuesday across the country and publishes this data the same day it is collected.
We also publish wholesale gasoline prices on a daily basis for 23 centres across Canada. In addition, we provide weekly diesel prices in 45 Canadian cities, furnace oil prices in 30 Canadian cities and auto propane prices in 20 Canadian cities.Wholesale Gasoline Prices
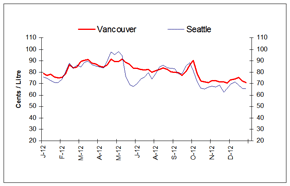
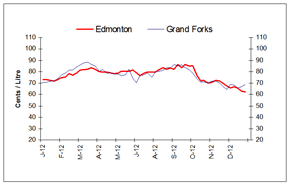
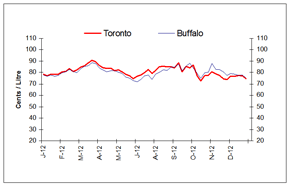
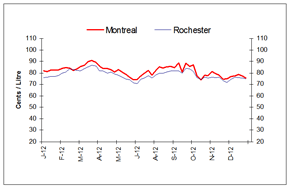
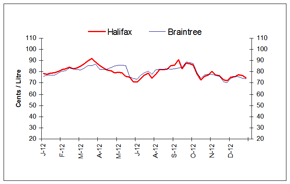
Wholesale gasoline prices ranged from 62 to 75 cents per litre in selected centres for the week of January 17, 2013. Overall, compared to the previous week, Canadian and American centres recorded price changes ranging from a decrease of 3 cents per litre to an increase of more than 2 cents per litre.
In the Western centres, price changes ranged between a decrease of less than 1 cent per litre to an increase of more than 2 cents per litre compared to the previous week, and ended at 62 to 71 cents per litre.
Prices in Eastern centres decreased in the range of 1 to nearly 3 cents per litre and ended at 74 to 75 cents per litre.
In the last four weeks, wholesale prices in most Canadian and American selected centres have decreased in the range of less than 1 cent per litre to 4 cents per litre.
Overall, compared to the same period last year, wholesale prices in all selected centres are below last year’s level with decreases ranging from 2 to 10 cents per litre.
|
|
|
|
|
|
|
Text version - Figure 4
This graph shows the trend in wholesale gasoline prices for selected centres in Canada and the U.S.
| DATE | Halifax | Braintree | Montreal | Rochester | Toronto | Buffalo | Edmonton | Grand Forks | Vancouver | Seattle |
|---|---|---|---|---|---|---|---|---|---|---|
| Thu 05-Jan-12 | 78.30 | 75.98 | 81.60 | 75.96 | 78.50 | 78.12 | 72.80 | 70.73 | 78.90 | 76.05 |
| Thu 12-Jan-12 | 78.00 | 76.93 | 81.40 | 76.17 | 77.20 | 76.78 | 73.00 | 70.78 | 77.30 | 74.34 |
| Thu 19-Jan-12 | 79.00 | 77.11 | 82.60 | 76.67 | 78.40 | 77.87 | 72.70 | 71.87 | 77.90 | 72.89 |
| Thu 26-Jan-12 | 79.40 | 76.87 | 82.30 | 76.65 | 78.20 | 76.77 | 71.50 | 72.13 | 75.70 | 70.92 |
| Thu 02-Feb-12 | 80.10 | 78.57 | 82.50 | 77.46 | 78.50 | 77.55 | 73.20 | 74.13 | 75.00 | 71.02 |
| Thu 09-Feb-12 | 81.80 | 80.57 | 83.80 | 80.07 | 80.40 | 79.83 | 74.80 | 77.38 | 75.20 | 73.88 |
| hu 16-Feb-12 | 82.70 | 81.17 | 84.60 | 80.70 | 81.10 | 80.53 | 75.20 | 78.68 | 79.10 | 80.62 |
| Thu 23-Feb-12 | 84.20 | 83.12 | 84.50 | 83.26 | 83.30 | 82.83 | 78.30 | 81.53 | 86.30 | 87.84 |
| Thu 01-Mar-12 | 83.00 | 82.67 | 82.10 | 83.10 | 81.20 | 80.92 | 77.20 | 81.51 | 83.70 | 83.24 |
| Thu 08-Mar-12 | 83.20 | 81.93 | 83.40 | 82.01 | 82.20 | 79.67 | 79.00 | 84.37 | 84.20 | 86.03 |
| Thu 15-Mar-12 | 85.30 | 81.51 | 85.40 | 81.64 | 84.60 | 83.41 | 81.40 | 85.85 | 89.10 | 84.33 |
| Thu 22-Mar-12 | 87.30 | 83.23 | 86.30 | 83.69 | 86.10 | 85.62 | 82.00 | 87.65 | 90.50 | 88.72 |
| Thu 9-Mar-12 | 89.60 | 85.57 | 89.40 | 85.29 | 88.10 | 86.11 | 82.30 | 88.42 | 91.10 | 89.74 |
| Thu 05-Apr-12 | 91.80 | 85.57 | 91.00 | 86.50 | 90.90 | 88.65 | 83.50 | 86.17 | 88.00 | 86.61 |
| Thu 2-Apr-12 | 88.90 | 86.73 | 89.00 | 86.24 | 89.60 | 87.79 | 82.50 | 85.65 | 87.50 | 85.43 |
| Thu 19-Apr-12 | 85.80 | 82.15 | 85.40 | 81.69 | 86.00 | 83.66 | 80.10 | 80.61 | 85.20 | 84.31 |
| Thu 26-Apr-12 | 83.30 | 82.09 | 83.90 | 81.75 | 84.00 | 82.15 | 79.60 | 81.72 | 84.40 | 84.04 |
| Thu 03-May-12 | 81.50 | 82.57 | 84.00 | 79.72 | 83.80 | 80.81 | 79.90 | 78.77 | 86.00 | 88.50 |
| Thu 10-May-12 | 81.20 | 83.82 | 83.10 | 80.79 | 83.80 | 81.50 | 79.40 | 79.14 | 91.40 | 97.78 |
| Thu 17-May-12 | 79.10 | 85.05 | 80.60 | 78.79 | 81.50 | 81.63 | 78.50 | 77.97 | 89.20 | 95.59 |
| Thu 24-May-12 | 79.90 | 85.98 | 82.80 | 78.04 | 82.20 | 80.07 | 78.60 | 78.09 | 89.10 | 97.99 |
| Thu 31-May-12 | 79.30 | 86.07 | 80.90 | 76.24 | 80.80 | 79.07 | 80.80 | 76.64 | 91.60 | 94.29 |
| Thu 07-Jun-12 | 75.90 | 85.72 | 78.70 | 74.45 | 78.40 | 76.04 | 80.50 | 77.57 | 88.60 | 76.45 |
| Thu 14-Jun-12 | 75.00 | 75.71 | 76.30 | 74.07 | 77.10 | 74.98 | 80.80 | 82.24 | 87.00 | 69.43 |
| Thu 21-Jun-12 | 70.90 | 73.99 | 74.20 | 71.22 | 74.80 | 73.12 | 81.40 | 74.20 | 83.60 | 67.29 |
| Thu 28-Jun-12 | 71.10 | 73.37 | 74.30 | 70.57 | 76.80 | 71.79 | 79.20 | 70.40 | 83.30 | 70.25 |
| Thu 05-Jul-12 | 74.00 | 76.84 | 77.10 | 74.49 | 77.70 | 74.13 | 76.50 | 76.50 | 82.30 | 73.89 |
| Thu 12-Jul-12 | 77.00 | 79.06 | 79.90 | 75.64 | 79.70 | 77.17 | 78.90 | 77.33 | 82.00 | 75.98 |
| Thu 19-Jul-12 | 78.70 | 80.51 | 81.90 | 77.65 | 82.80 | 78.00 | 79.80 | 79.34 | 82.50 | 79.29 |
| Thu 26-Jul-12 | 74.10 | 78.00 | 78.20 | 75.33 | 79.30 | 73.91 | 79.50 | 75.41 | 79.70 | 74.08 |
| Thu 02-Aug-12 | 77.50 | 81.71 | 81.50 | 77.89 | 81.70 | 78.15 | 79.90 | 80.06 | 81.00 | 78.57 |
| Thu 09-Aug-12 | 81.80 | 82.28 | 85.00 | 80.00 | 85.20 | 80.22 | 81.90 | 80.55 | 82.50 | 84.38 |
| Thu 16-Aug-12 | 82.10 | 82.18 | 84.50 | 80.04 | 85.60 | 82.22 | 83.80 | 81.19 | 83.80 | 86.04 |
| Thu 23-Aug-12 | 82.50 | 82.70 | 85.10 | 80.56 | 84.90 | 82.09 | 82.40 | 83.57 | 82.50 | 83.89 |
| Thu 30-Aug-12 | 85.60 | 82.23 | 85.50 | 81.71 | 85.20 | 84.70 | 83.10 | 83.91 | 80.50 | 83.35 |
| Thu 06-Sep-12 | 86.00 | 82.67 | 84.60 | 81.65 | 84.30 | 84.61 | 82.40 | 86.24 | 79.70 | 83.15 |
| Thu 13-Sep-12 | 90.80 | 83.28 | 88.60 | 81.81 | 88.60 | 87.08 | 86.50 | 85.28 | 79.50 | 78.61 |
| Thu 20-Sep-12 | 82.80 | 84.03 | 80.80 | 79.82 | 80.50 | 81.33 | 83.60 | 85.93 | 77.30 | 79.04 |
| Thu 27-Sep-12 | 87.70 | 84.38 | 88.40 | 84.06 | 85.30 | 85.30 | 86.30 | 83.65 | 80.70 | 85.58 |
| Thu 04-Oct-12 | 87.30 | 84.45 | 85.40 |
83.55 | 84.20 | 88.22 | 85.00 |
81.73 | 85.90 | 88.43 |
| Thu 11-Oct-12 | 86.00 |
84.10 | 87.00 |
81.16 | 86.50 | 83.98 | 85.40 |
78.69 | 90.60 | 81.35 |
| Thu 18-Oct-12 | 77.80 | 84.33 | 77.70 | 76.05 | 77.20 | 79.28 | 76.60 | 73.80 | 78.50 | 71.33 |
| Thu 25-Oct-12 | 73.00 | 85.48 | 73.80 | 74.24 | 72.70 | 74.59 | 72.10 | 71.37 | 72.10 | 66.33 |
| Thu 01-Nov-12 | 76.30 | 85.75 | 78.10 | 76.16 | 77.40 | 79.83 | 72.60 | 71.19 | 71.60 | 65.42 |
| Thu 08-Nov-12 | 76.80 | 85.86 | 77.60 | 75.63 | 77.40 | 79.93 | 69.90 | 70.30 | 71.10 | 67.09 |
| Thu 15-Nov-12 | 80.10 | 78.06 | 81.20 | 76.45 | 80.60 | 87.66 | 70.90 | 71.58 | 72.80 | 67.68 |
| Thu 22-Nov-12 | 77.20 | 76.48 | 79.20 | 75.80 | 78.90 | 83.00 | 72.50 | 71.84 | 72.80 | 67.14 |
| Thu 29-Nov-12 | 76.70 | 76.01 | 78.30 | 76.51 | 77.50 | 82.63 | 72.10 | 70.37 | 71.30 | 68.68 |
| Thu 06-Dec-12 | 73.10 | 71.08 | 74.60 | 73.05 | 74.40 | 80.37 | 70.10 | 67.40 | 71.40 | 62.39 |
| Thu 13-Dec-12 | 72.10 | 70.22 | 74.90 | 71.94 | 73.90 | 77.52 | 67.70 | 64.43 | 70.50 | 65.70 |
| Thu 20-Dec-12 | 75.40 | 74.02 | 76.90 | 74.59 | 76.40 | 79.11 | 66.10 | 68.86 | 73.30 | 69.53 |
| Thu 27-Dec-12 | 75.80 | 76.29 | 77.10 | 76.52 | 76.80 | 78.58 | 66.70 | 67.97 | 74.00 | 71.30 |
| Thu 03-Jan-13 | 77.50 | 75.42 | 78.60 | 75.82 | 77.50 | 77.31 | 65.40 | 66.07 | 75.50 | 68.79 |
| Thu 10-Jan-13 | 76.70 | 74.48 | 77.40 | 75.49 | 76.90 | 77.88 | 63.40 | 66.67 | 72.40 | 65.77 |
| Thu 17-Jan-13 | 74.80 | 73.73 | 75.40 | 74.81 | 75.00 | 74.96 | 62.40 | 69.13 | 70.90 | 65.72 |
| Thu 13-Dec-12 | 72.10 | 70.22 | 74.90 | 71.94 | 73.90 | 77.52 | 67.70 | 64.43 | 70.50 | 65.70 |
Sources: NRCan, Bloomberg Oil Buyers Guide
Gasoline Refining and Marketing Margins
Four-week rolling averages are used for gasoline refining and marketing margins.
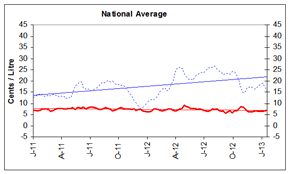
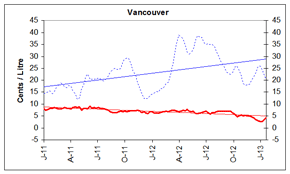
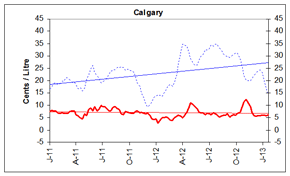
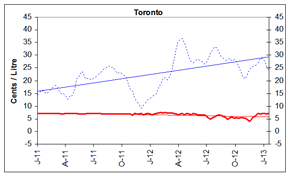
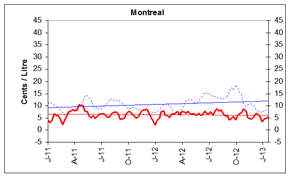
Refining margins for gasoline in Canada were on a downward slope in the latter part of 2012 and early 2013, reflecting the decrease in North American demand for gasoline and a well-supplied market. Refining margins have been declining gradually and are now hovering at 15.5 cents per litre nationally for the week ending January 22, 2013.
This is 1.5 cent per litre above last year’s level of 14 cents per litre.
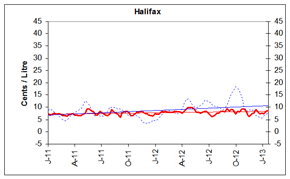
Nationally, marketing margins rose by nearly 1 cent per litre, unchanged compared to the same period last year. Marketing margins for the five centres ranged from 4 cents per litre in Vancouver to 8 cents per litre in Halifax.
|
|
|
|
|
|
|
|
Text version - Figure 5
These graphs show the trend in refining and marketing costs and margins for selected centres in Canada and the national average.
| 4-week rolling average | Canada | Vancouver | Calgary | Toronto | Montreal | Halifax | ||||||
|---|---|---|---|---|---|---|---|---|---|---|---|---|
| Marketing Margin | Refining Margin | Marketing Margin | Refining Margin | Marketing Margin | Refining Margin | Marketing Margin | Refining Margin | Marketing Margin | Refining Margin | Marketing Margin | Refining Margin | |
| 2011-01-04 | 6.8 | 12.7 | 8.0 | 14.4 | 7.5 | 16.6 | 7.1 | 14.4 | 4.1 | 11.0 | 7.4 | 9.0 |
| 2011-01-11 | 6.8 | 13.2 | 7.6 | 14.8 | 8.1 | 17.5 | 7.0 | 15.4 | 2.9 | 11.1 | 6.9 | 8.8 |
| 2011-01-18 | 6.6 | 13.7 | 7.9 | 15.1 | 7.7 | 18.7 | 7.1 | 16.0 | 4.3 | 11.1 | 7.2 | 8.7 |
| 2011-01-25 | 6.9 | 14.1 | 8.2 | 15.6 | 7.8 | 19.2 | 7.0 | 16.1 | 6.7 | 10.3 | 7.7 | 7.9 |
| 2011-02-01 | 7.6 | 14.0 | 8.3 | 14.5 | 6.9 | 18.2 | 7.0 | 15.0 | 6.0 | 9.7 | 7.1 | 7.2 |
| 2011-02-08 | 7.3 | 13.1 | 8.6 | 15.1 | 6.9 | 18.7 | 7.0 | 15.3 | 5.9 | 9.0 | 7.3 | 6.4 |
| 2011-02-15 | 7.4 | 13.1 | 8.3 | 17.0 | 7.1 | 19.9 | 7.0 | 16.7 | 4.5 | 8.2 | 7.2 | 5.9 |
| 2011-02-22 | 7.2 | 13.6 | 7.9 | 17.7 | 6.7 | 20.1 | 7.0 | 17.2 | 2.1 | 7.2 | 6.6 | 4.9 |
| 2011-03-01 | 6.5 | 13.5 | 8.1 | 18.9 | 6.8 | 21.3 | 7.0 | 18.3 | 4.1 | 6.3 | 6.7 | 4.3 |
| 2011-03-08 | 6.9 | 13.8 | 8.3 | 18.3 | 6.8 | 21.2 | 7.0 | 17.8 | 5.9 | 6.8 | 6.4 | 4.9 |
| 2011-03-15 | 7.2 | 13.8 | 8.6 | 17.3 | 7.6 | 20.4 | 7.0 | 16.1 | 7.7 | 6.9 | 6.9 | 5.3 |
| 2011-03-22 | 7.7 | 13.1 | 8.4 | 17.0 | 7.8 | 19.3 | 7.0 | 15.0 | 7.6 | 7.7 | 7.0 | 6.4 |
| 2011-03-29 | 7.7 | 12.8 | 8.3 | 17.9 | 7.7 | 19.2 | 7.0 | 14.8 | 8.4 | 8.7 | 7.5 | 7.5 |
| 2011-04-05 | 7.8 | 13.2 | 8.1 | 17.4 | 6.1 | 18.2 | 7.0 | 14.2 | 7.8 | 8.8 | 7.0 | 7.9 |
| 2011-04-12 | 7.4 | 12.8 | 8.5 | 15.5 | 5.7 | 16.7 | 7.1 | 12.8 | 8.1 | 8.9 | 6.9 | 8.0 |
| 2011-04-19 | 7.4 | 11.9 | 8.9 | 14.4 | 4.9 | 17.0 | 7.1 | 13.9 | 10.4 | 9.6 | 6.6 | 8.8 |
| 2011-04-26 | 7.7 | 12.6 | 8.6 | 12.2 | 4.6 | 15.9 | 7.1 | 13.9 | 10.2 | 10.1 | 6.6 | 9.2 |
| 2011-05-03 | 7.6 | 12.5 | 8.9 | 12.9 | 6.6 | 17.0 | 7.0 | 16.0 | 10.1 | 11.6 | 7.2 | 10.9 |
| 2011-05-10 | 8.0 | 14.2 | 7.5 | 16.6 | 5.8 | 20.5 | 7.0 | 20.5 | 7.8 | 14.2 | 7.6 | 12.5 |
| 2011-05-17 | 7.3 | 17.8 | 8.3 | 18.3 | 8.1 | 22.1 | 7.0 | 21.4 | 7.7 | 14.1 | 9.3 | 12.2 |
| 2011-05-24 | 8.0 | 18.5 | 8.3 | 21.5 | 9.1 | 25.0 | 6.9 | 23.3 | 5.8 | 13.4 | 9.5 | 10.9 |
| 2011-05-31 | 7.9 | 19.7 | 8.1 | 22.6 | 7.8 | 26.1 | 7.0 | 23.5 | 5.3 | 12.3 | 8.5 | 9.2 |
| 2011-06-07 | 7.6 | 19.7 | 9.3 | 20.3 | 9.6 | 23.1 | 7.0 | 21.0 | 5.8 | 9.6 | 8.2 | 6.9 |
| 2011-06-14 | 8.3 | 17.0 | 8.4 | 20.3 | 7.8 | 22.3 | 7.0 | 20.9 | 4.6 | 9.0 | 6.8 | 6.3 |
| 2011-06-21 | 7.5 | 16.5 | 8.6 | 20.3 | 8.2 | 20.9 | 7.1 | 20.7 | 5.9 | 9.4 | 7.0 | 7.0 |
| 2011-06-28 | 7.8 | 16.3 | 8.3 | 20.5 | 9.9 | 19.0 | 7.0 | 20.3 | 6.6 | 8.5 | 8.4 | 6.3 |
| 2011-07-05 | 8.4 | 15.5 | 8.5 | 20.8 | 9.4 | 19.6 | 7.1 | 21.0 | 6.7 | 8.7 | 7.9 | 6.1 |
| 2011-07-12 | 8.2 | 15.9 | 8.3 | 20.6 | 9.5 | 20.2 | 7.1 | 21.6 | 6.8 | 9.7 | 7.2 | 6.7 |
| 2011-07-19 | 8.1 | 16.4 | 8.2 | 19.8 | 8.8 | 21.0 | 7.0 | 22.2 | 6.1 | 10.3 | 6.9 | 7.3 |
| 2011-07-26 | 7.6 | 16.9 | 8.1 | 19.7 | 7.7 | 22.5 | 7.1 | 23.0 | 5.3 | 11.4 | 6.7 | 8.5 |
| 2011-08-02 | 7.2 | 17.8 | 7.7 | 20.5 | 7.7 | 23.9 | 6.9 | 24.1 | 5.4 | 12.7 | 7.2 | 10.1 |
| 2011-08-09 | 7.1 | 18.9 | 7.5 | 22.0 | 9.3 | 24.1 | 6.9 | 24.5 | 7.1 | 12.4 | 9.2 | 10.0 |
| 2011-08-16 | 7.8 | 19.1 | 6.8 | 23.4 | 9.4 | 24.4 | 6.8 | 25.3 | 7.3 | 12.5 | 7.9 | 10.0 |
| 2011-08-23 | 7.8 | 19.6 | 6.5 | 24.5 | 8.7 | 25.5 | 6.8 | 25.8 | 7.6 | 12.3 | 7.6 | 9.7 |
| 2011-08-30 | 7.7 | 20.1 | 6.6 | 24.8 | 8.3 | 25.3 | 6.9 | 25.2 | 6.6 | 11.9 | 7.2 | 9.1 |
| 2011-09-06 | 7.5 | 19.7 | 6.5 | 24.6 | 6.4 | 25.8 | 6.9 | 25.2 | 4.4 | 12.0 | 5.8 | 9.4 |
| 2011-09-13 | 6.7 | 19.9 | 6.8 | 24.4 | 6.2 | 25.5 | 7.0 | 24.0 | 4.4 | 11.2 | 7.8 | 8.9 |
| 2011-09-20 | 6.8 | 19.2 | 7.2 | 25.1 | 7.5 | 24.1 | 6.9 | 22.7 | 4.7 | 10.5 | 8.1 | 8.3 |
| 2011-09-27 | 7.3 | 18.2 | 6.8 | 27.8 | 7.2 | 24.7 | 6.9 | 23.4 | 6.5 | 9.4 | 8.5 | 7.4 |
| 2011-10-04 | 7.6 | 18.4 | 7.0 | 29.0 | 6.9 | 24.2 | 6.9 | 22.7 | 7.8 | 9.0 | 8.2 | 6.7 |
| 2011-10-11 | 8.0 | 17.9 | 6.7 | 29.5 | 6.8 | 24.0 | 6.9 | 21.9 | 7.4 | 8.9 | 6.6 | 6.5 |
| 2011-10-18 | 7.7 | 17.6 | 7.0 | 29.0 | 6.7 | 23.5 | 6.9 | 21.5 | 6.8 | 9.3 | 6.5 | 6.9 |
| 2011-10-25 | 7.5 | 17.4 | 7.2 | 26.5 | 7.4 | 21.1 | 6.8 | 18.6 | 5.6 | 9.1 | 7.1 | 7.0 |
| 2011-11-01 | 7.4 | 15.7 | 7.3 | 23.8 | 7.7 | 19.0 | 6.8 | 16.6 | 4.9 | 8.6 | 7.7 | 6.4 |
| 2011-11-08 | 7.4 | 14.2 | 7.2 | 22.4 | 7.0 | 17.8 | 6.4 | 15.8 | 5.6 | 8.3 | 7.9 | 6.0 |
| 2011-11-15 | 7.3 | 13.4 | 7.5 | 19.5 | 7.2 | 15.0 | 7.0 | 13.1 | 7.2 | 7.1 | 8.4 | 4.8 |
| 2011-11-22 | 7.4 | 11.2 | 7.4 | 16.7 | 6.9 | 12.8 | 6.9 | 11.8 | 8.2 | 6.5 | 8.3 | 3.8 |
| 2011-11-29 | 7.0 | 10.1 | 6.6 | 14.6 | 6.6 | 10.7 | 6.8 | 10.6 | 8.2 | 6.3 | 7.6 | 3.4 |
| 2011-12-06 | 7.1 | 8.9 | 6.9 | 12.3 | 6.7 | 9.2 | 7.2 | 9.3 | 8.8 | 6.1 | 7.5 | 3.3 |
| 2011-12-13 | 7.3 | 7.6 | 6.2 | 12.2 | 6.0 | 10.1 | 6.6 | 10.3 | 6.7 | 6.7 | 6.8 | 3.7 |
| 2011-12-20 | 6.8 | 8.0 | 6.2 | 12.4 | 4.6 | 11.5 | 6.8 | 11.0 | 5.3 | 6.7 | 6.7 | 4.0 |
| 2011-12-27 | 6.4 | 9.1 | 6.8 | 14.0 | 4.3 | 13.5 | 7.0 | 12.6 | 3.7 | 7.3 | 6.5 | 4.8 |
| 2012-01-03 | 6.1 | 10.4 | 6.9 | 14.1 | 4.6 | 13.9 | 6.9 | 13.0 | 1.9 | 7.1 | 7.3 | 4.4 |
| 2012-01-10 | 6.1 | 11.3 | 6.4 | 14.9 | 3.0 | 14.2 | 6.7 | 13.8 | 3.7 | 7.5 | 7.1 | 5.0 |
| 2012-01-17 | 6.5 | 11.8 | 6.4 | 15.4 | 4.0 | 14.1 | 6.9 | 14.5 | 5.1 | 8.7 | 7.2 | 6.0 |
| 2012-01-24 | 7.3 | 11.5 | 6.3 | 15.1 | 5.0 | 13.6 | 7.0 | 14.9 | 7.5 | 9.1 | 8.3 | 6.5 |
| 2012-01-31 | 7.6 | 12.3 | 6.7 | 16.6 | 5.0 | 15.0 | 7.4 | 17.3 | 8.0 | 10.6 | 8.2 | 8.1 |
| 2012-02-07 | 7.2 | 13.6 | 6.8 | 16.6 | 5.2 | 16.5 | 7.4 | 18.9 | 6.2 | 10.6 | 8.4 | 8.2 |
| 2012-02-14 | 7.0 | 15.2 | 6.8 | 17.4 | 4.8 | 17.9 | 7.3 | 20.8 | 6.1 | 10.3 | 7.8 | 8.4 |
| 2012-02-21 | 6.6 | 16.2 | 6.9 | 18.5 | 3.9 | 18.6 | 7.5 | 21.4 | 5.1 | 10.1 | 7.9 | 8.7 |
| 2012-02-28 | 6.8 | 16.9 | 6.8 | 19.3 | 3.9 | 17.7 | 7.3 | 20.3 | 6.5 | 8.8 | 8.0 | 8.2 |
| 2012-03-06 | 7.1 | 15.4 | 7.2 | 22.2 | 4.9 | 18.9 | 7.3 | 21.6 | 6.7 | 7.7 | 8.1 | 7.9 |
| 2012-03-13 | 7.3 | 16.2 | 7.5 | 26.6 | 5.6 | 22.4 | 7.4 | 23.8 | 6.9 | 6.9 | 8.4 | 7.6 |
| 2012-03-20 | 7.5 | 18.1 | 7.5 | 31.2 | 6.0 | 26.7 | 7.2 | 27.6 | 7.8 | 6.4 | 8.0 | 7.3 |
| 2012-03-27 | 6.9 | 20.1 | 7.1 | 36.2 | 5.6 | 31.9 | 6.9 | 32.5 | 6.3 | 6.9 | 8.0 | 7.7 |
| 2012-04-03 | 6.8 | 24.3 | 6.8 | 39.0 | 4.8 | 34.7 | 6.7 | 35.3 | 7.8 | 8.7 | 7.6 | 9.6 |
| 2012-04-10 | 7.1 | 25.8 | 7.1 | 38.3 | 5.8 | 34.4 | 6.8 | 36.2 | 7.4 | 10.4 | 8.4 | 11.4 |
| 2012-04-17 | 7.5 | 26.2 | 7.5 | 37.4 | 7.2 | 33.9 | 7.0 | 36.6 | 6.9 | 12.1 | 8.8 | 13.1 |
| 2012-04-24 | 8.0 | 25.7 | 7.4 | 34.4 | 9.0 | 31.8 | 6.7 | 34.9 | 7.6 | 12.4 | 10.0 | 13.3 |
| 2012-05-01 | 9.3 | 23.3 | 7.8 | 31.6 | 11.0 | 28.9 | 7.0 | 32.0 | 6.5 | 12.6 | 9.8 | 12.6 |
| 2012-05-08 | 8.7 | 21.7 | 7.2 | 31.0 | 10.5 | 27.3 | 6.9 | 29.5 | 6.6 | 12.0 | 9.8 | 11.3 |
| 2012-05-15 | 8.4 | 20.7 | 6.8 | 32.0 | 9.7 | 26.3 | 6.6 | 27.5 | 6.8 | 11.2 | 9.2 | 10.1 |
| 2012-05-22 | 8.0 | 20.6 | 7.0 | 33.2 | 8.6 | 26.3 | 7.0 | 27.0 | 5.9 | 11.4 | 7.8 | 9.7 |
| 2012-05-29 | 8.1 | 20.5 | 6.2 | 37.0 | 7.4 | 28.4 | 6.8 | 28.0 | 7.0 | 12.0 | 7.8 | 10.1 |
| 2012-06-05 | 8.0 | 21.8 | 6.1 | 38.6 | 7.1 | 30.0 | 6.5 | 28.5 | 6.3 | 13.2 | 7.6 | 10.9 |
| 2012-06-12 | 7.5 | 22.8 | 6.2 | 37.9 | 7.0 | 30.9 | 6.7 | 27.8 | 6.2 | 14.0 | 7.9 | 11.5 |
| 2012-06-19 | 7.8 | 23.3 | 6.7 | 38.0 | 6.3 | 32.5 | 6.7 | 27.5 | 8.0 | 15.3 | 8.3 | 12.9 |
| 2012-06-26 | 7.6 | 23.7 | 6.8 | 35.7 | 6.8 | 32.5 | 6.6 | 26.5 | 6.9 | 15.2 | 8.4 | 12.9 |
| 2012-07-03 | 7.3 | 23.7 | 7.0 | 34.9 | 6.5 | 33.0 | 6.1 | 27.0 | 6.6 | 14.8 | 7.3 | 12.1 |
| 2012-07-10 | 7.0 | 24.5 | 6.6 | 35.3 | 6.3 | 34.4 | 5.3 | 29.0 | 7.4 | 14.7 | 6.4 | 11.8 |
| 2012-07-17 | 6.6 | 25.8 | 5.9 | 34.9 | 7.0 | 34.0 | 4.9 | 30.9 | 6.3 | 14.0 | 6.2 | 10.7 |
| 2012-07-24 | 7.1 | 25.9 | 6.7 | 35.0 | 6.6 | 34.6 | 5.4 | 32.5 | 7.7 | 13.6 | 6.9 | 10.3 |
| 2012-07-31 | 7.6 | 26.1 | 6.6 | 34.3 | 6.2 | 34.6 | 5.8 | 33.3 | 9.0 | 13.4 | 7.5 | 10.4 |
| 2012-08-07 | 7.5 | 26.6 | 6.8 | 32.0 | 5.3 | 33.2 | 6.3 | 32.7 | 8.1 | 13.5 | 7.6 | 9.9 |
| 2012-08-14 | 7.6 | 25.4 | 7.1 | 30.2 | 5.5 | 32.4 | 6.7 | 31.2 | 8.2 | 13.0 | 8.4 | 9.3 |
| 2012-08-21 | 7.2 | 24.5 | 7.1 | 27.9 | 6.1 | 30.7 | 6.3 | 29.3 | 6.9 | 12.8 | 8.4 | 8.8 |
| 2012-08-28 | 6.5 | 23.9 | 7.1 | 26.4 | 6.0 | 30.0 | 5.8 | 28.8 | 5.8 | 13.6 | 8.2 | 9.9 |
| 2012-09-04 | 6.5 | 22.7 | 7.1 | 25.2 | 6.5 | 29.7 | 5.5 | 27.9 | 6.1 | 13.4 | 9.6 | 10.9 |
| 2012-09-11 | 5.6 | 23.3 | 7.0 | 23.6 | 5.3 | 29.3 | 4.8 | 28.3 | 4.2 | 15.9 | 8.4 | 13.5 |
| 2012-09-18 | 6.1 | 23.3 | 7.2 | 22.8 | 5.9 | 30.1 | 5.4 | 28.8 | 4.8 | 17.3 | 9.0 | 15.8 |
| 2012-09-25 | 6.5 | 22.9 | 7.0 | 22.3 | 6.2 | 30.4 | 5.7 | 27.6 | 5.4 | 16.4 | 8.8 | 16.4 |
| 2012-10-02 | 5.9 | 24.2 | 6.3 | 23.3 | 6.0 | 31.2 | 5.3 | 28.3 | 4.3 | 18.7 | 7.0 | 18.5 |
| 2012-10-09 | 6.6 | 23.8 | 5.7 | 25.6 | 6.9 | 31.1 | 5.4 | 27.5 | 6.1 | 17.4 | 8.4 | 17.9 |
| 2012-10-16 | 6.7 | 22.9 | 4.7 | 26.6 | 7.3 | 29.3 | 5.2 | 26.3 | 6.8 | 15.7 | 8.0 | 16.6 |
| 2012-10-23 | 7.5 | 20.4 | 5.1 | 24.4 | 9.1 | 25.9 | 5.5 | 23.7 | 7.2 | 14.0 | 9.3 | 14.3 |
| 2012-10-30 | 8.5 | 17.2 | 5.5 | 21.6 | 11.4 | 22.0 | 5.5 | 20.9 | 8.6 | 10.3 | 9.3 | 10.3 |
| 2012-11-06 | 8.3 | 14.8 | 5.1 | 18.7 | 12.4 | 20.3 | 5.1 | 20.8 | 7.9 | 9.6 | 8.5 | 8.6 |
| 2012-11-13 | 7.3 | 15.1 | 5.4 | 17.2 | 11.5 | 19.3 | 4.6 | 21.7 | 5.2 | 10.4 | 6.7 | 8.7 |
| 2012-11-20 | 6.3 | 16.8 | 5.1 | 18.2 | 9.4 | 20.0 | 4.1 | 24.4 | 4.7 | 10.8 | 6.1 | 8.9 |
| 2012-11-27 | 6.0 | 17.2 | 5.0 | 18.7 | 7.3 | 21.2 | 4.9 | 25.5 | 4.4 | 10.8 | 7.4 | 8.9 |
| 2012-12-04 | 6.2 | 17.2 | 4.8 | 20.1 | 5.8 | 21.8 | 5.8 | 25.7 | 5.5 | 9.9 | 7.5 | 8.6 |
| 2012-12-11 | 6.5 | 16.3 | 4.3 | 19.3 | 5.5 | 21.0 | 6.1 | 24.0 | 6.9 | 7.9 | 9.1 | 6.3 |
| 2012-12-18 | 6.7 | 16.6 | 3.6 | 23.2 | 5.8 | 24.0 | 7.1 | 27.1 | 6.5 | 7.8 | 8.0 | 6.0 |
| 2012-12-25 | 6.4 | 17.7 | 3.0 | 25.6 | 5.8 | 24.4 | 6.8 | 28.8 | 5.4 | 7.5 | 7.4 | 5.8 |
| 2013-01-01 | 6.2 | 18.6 | 2.8 | 25.9 | 6.1 | 23.1 | 7.1 | 28.9 | 3.6 | 7.3 | 7.7 | 5.6 |
| 2013-01-08 | 6.4 | 19.0 | 2.7 | 24.5 | 6.0 | 19.8 | 7.1 | 27.6 | 4.4 | 8.0 | 7.5 | 6.6 |
| 2013-01-15 | 6.5 | 17.5 | 3.5 | 22.2 | 5.9 | 16.3 | 6.8 | 25.5 | 4.6 | 8.2 | 8.5 | 7.2 |
| 2013-01-22 | 6.9 | 15.6 | 4.4 | 20.2 | 6.3 | 14.3 | 7.0 | 23.9 | 5.5 | 8.3 | 8.5 | 7.6 |
Source: NRCan
Crude Oil Overview
Edmonton Par Prices Rebound
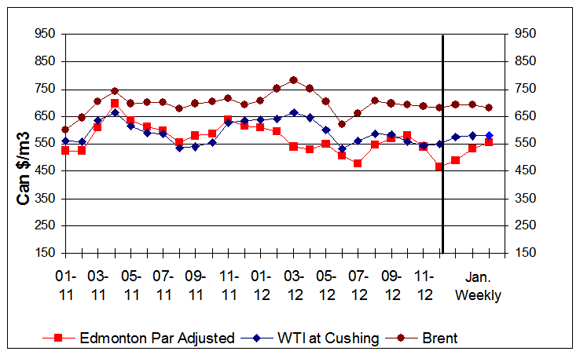
For the week ending January 18, 2013, prices for the three marker crudes averaged between $553/m3 and $683/m3 (US$89 to US$110 per barrel). This is an increase of $20/m3 (US$3 per barrel) for Edmonton Par, compared to the previous week, while West Texas Intermediate (WTI) and Brent declined $2/m3 and $9/m3, respectively. Of particular note was the relative strength of Edmonton Par prices, which rose to almost equal the WTI prices.
Brent and WTI crude oil price movements were fairly muted as economic indicators in Europe and the U.S. still point to a soft recovery. A noteworthy comment is the re-opening of the U.S. expanded Seaway pipeline carrying oil from Cushing, Oklahoma, to the Gulf of Mexico Coast refineries. Energy market analysts expect that the pipeline re-opening will change the dynamic between the WTI and Brent crude oil prices, but it may take months until the crude oil stockpile at Cushing diminishes sufficiently to have an impact on prices.
The Organization of Petroleum Exporting Countries (OPEC) forecast for world oil demand growth in 2013 remains unchanged at 0.8 mb/d, in line with the growth seen in the previous year. According to OPEC, the impact of economic turbulence on oil demand should be considerably milder than in previous years. The OECD region is expected to continue to contract this year by 0.2 mb/d, although at only half the rate seen in 2012. The non-OECD region is projected to consume about 1 mb/d more than last year. Transportation and industrial sectors are expected to provide most of the consumption this year and to be the source of most of the growth.
Figure 6: Crude Oil Price Comparisons
Text version - Figure 6
This graph shows crude oil prices for Edmonton Par, WTI and Brent. The average weekly prices for the period ending January 14, 2013, were $553/cubic metres, $578/cubic metres and $683/cubic metres for Edmonton Par, WTI and Brent, respectively.
| Dates | Edmonton Par Prices | WTI Prices | Brent Prices |
|---|---|---|---|
| 01/11 | 525.08 | 559.18 | 601.95 |
| 02/11 | 525.75 | 556.16 | 645.23 |
| 03/11 | 609.96 | 632.59 | 703.16 |
| 04/11 | 696.77 | 662.59 | 741.59 |
| 05/11 | 634.91 | 617.17 | 697.06 |
| 06/11 | 614.21 | 591.76 | 699.64 |
| 07/11 | 599.18 | 585.28 | 701.96 |
| 08/11 | 554.74 | 533.58 | 679.51 |
| 09/11 | 578.01 | 538.55 | 696.18 |
| 10/11 | 585.88 | 554.72 | 702.66 |
| 11/11 | 636.41 | 627.49 | 713.92 |
| 12/11 | 615.54 | 633.97 | 693.85 |
| 01/12 | 608.11 | 639.88 | 709.45 |
| 02/12 | 594.50 | 640.89 | 750.59 |
| 03/12 | 538.60 | 663.34 | 780.71 |
| 04/12 | 528.21 | 644.60 | 751.91 |
| 05/12 | 548.81 | 601.64 | 704.10 |
| 06/12 | 507.78 | 532.76 | 618.43 |
| 07/12 | 477.07 | 560.69 | 659.07 |
| 08/12 | 544.82 | 587.49 | 707.75 |
| 09/12 | 570.15 | 582.08 | 697.56 |
| 10/12 | 578.61 | 555.66 | 694.60 |
| 11/12 | 539.87 | 543.52 | 686.30 |
| 12/12 | 467.14 | 549.56 | 680.33 |
| December 31, 2012 | 485.84 | 576.03 | 694.53 |
| January 7, 2013 | 533.31 | 579.67 | 692.21 |
| January 14, 2013 | 553.24 | 577.97 | 683.04 |
Sources: NRCan
| Crude Oil Types |
Week Ending: 2013-01-18 |
Change From: | ||||
|---|---|---|---|---|---|---|
| Previous Week | Last Year | |||||
|
$Can/ m3 |
$US/ bbl |
$Can/ m3 |
$US/ bbl |
$Can/ m3 |
$US/ bbl |
|
| Edmonton Par | 553.24 | 89.17 | +19.93 | +3.25 | -56.43 | -6.46 |
| WTI | 557.97 | 93.16 | -1.70 | -0.22 | -59.28 | -6.87 |
| Brent | 683.04 | 110.09 | -9.17 | -1.42 | -21.22 | -0.46 |
Source: NRCan
U.S. Short-Term Energy Outlook
The U.S. Energy Information Administration (EIA) expects that the Brent crude oil spot price, which averaged $112 per barrel in 2012, will fall to an average of $105 per barrel in 2013 and $99 per barrel in 2014. The projected discount of West Texas Intermediate (WTI) crude oil to Brent, which averaged $18 per barrel in 2012, falls to an average of $16 per barrel in 2013 and $8 per barrel in 2014, as planned new pipeline capacity lowers the cost of moving Mid-continent crude oil to the Gulf Coast refining centers.
EIA expects that falling crude prices will help national average regular gasoline retail prices fall from an average $3.63 per gallon in 2012 to annual averages of $3.44 per gallon and $3.34 per gallon in 2013 and 2014, respectively. Diesel fuel retail prices averaged $3.97 per gallon during 2012 and are forecasted to fall to an average of $3.87 per gallon in 2013 and $3.78 per gallon in 2014.
EIA estimates U.S. total crude oil production averaged 6.4 million barrels per day (bbl/d) in 2012, an increase of 0.8 million bbl/d from the previous year. Projected domestic crude oil production continues to increase to 7.3 million bbl/d in 2013 and 7.9 million bbl/d in 2014, which would mark the highest annual average level of production since 1988.
Source: EIA, released January 8, 2013
Download the report
Fuel Focus - Printable Version PDF, 193 KB
To read Adobe Acrobat® files, you will need to download and install the free Acrobat Reader® software available from Adobe Systems Incorporated.
Page details
- Date modified: