
Fuel Focus, June 13, 2014
Table of Contents
- National Overview
- Recent Developments
- Retail Gasoline Overview
- Wholesale Gasoline Prices
- Gasoline Refining and Marketing Margins
- Crude Oil Overview
- Download the report
National Overview
Canadian Retail Gasoline Prices Increased 1 Cent per Litre from Last Week
Average Canadian retail gasoline prices for the week ending June 10, 2014 increased for the fourth straight week by 1 cent per litre to $1.38 per litre. This represents a six weeks high and prices are 5 cents per litre higher than last year at this time.
Diesel fuel prices decreased by 0.2 cents per litre to $1.36 per litre for the week of June 10, 2014. This is almost 12 cents per litre higher compared to last year during the same period. Furnace oil prices increased by 0.3 cent per litre from the previous week to $1.27 per litre.
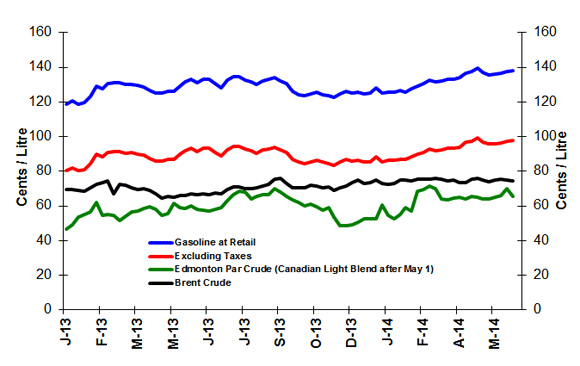
Figure 1: Crude Oil and Regular Gasoline Price Comparison
(National Average)
Text version
Figure 1
The graph shows prices in cents per litre for gasoline at retail, gasoline excluding taxes, and Edmonton Par and Brent crude oil prices. Gasoline prices ended the period of June 10, 2014, at 138.1 cents per litre, excluding taxes at 97.9 cents per litre, Edmonton Par at 65.5 cents per litre and Brent at 74.7 cents per litre.
| Dates | Gasoline at retail | Excluding Taxes | Edmonton Par crude | Brent crude |
|---|---|---|---|---|
| 01/01/2013 | 118.9 | 80.4 | 46.6 | 69.3 |
| 08/01/2013 | 120.6 | 81.9 | 49.4 | 69.5 |
| 15/01/2013 | 118.9 | 80.3 | 53.7 | 69.2 |
| 22/01/2013 | 119.7 | 81.1 | 55.2 | 68.7 |
| 29/01/2013 | 123.3 | 84.3 | 56.6 | 70.7 |
| 05/02/2013 | 129.2 | 89.7 | 61.9 | 72.5 |
| 12/02/2013 | 127.7 | 88.4 | 54.8 | 73.5 |
| 19/02/2013 | 130.5 | 90.9 | 55.3 | 74.6 |
| 26/02/2013 | 131.2 | 91.6 | 54.7 | 67.1 |
| 05/03/2013 | 131.2 | 91.6 | 51.8 | 72.5 |
| 12/03/2013 | 129.9 | 90.4 | 54.2 | 71.8 |
| 19/03/2013 | 130.1 | 90.7 | 56.7 | 70.6 |
| 26/03/2013 | 129.4 | 90.0 | 57.0 | 69.7 |
| 02/04/2013 | 128.7 | 89.3 | 58.4 | 69.9 |
| 09/04/2013 | 126.5 | 87.4 | 59.5 | 68.9 |
| 16/04/2013 | 125.0 | 86.0 | 58.0 | 67.0 |
| 23/04/2013 | 125.1 | 85.9 | 54.8 | 64.4 |
| 30/04/2013 | 126.3 | 87.0 | 55.8 | 65.5 |
| 07/05/2013 | 126.0 | 86.7 | 61.4 | 65.1 |
| 14/05/2013 | 129.3 | 89.8 | 59.1 | 66.1 |
| 21/05/2013 | 131.4 | 91.8 | 58.8 | 66.1 |
| 28/05/2013 | 132.9 | 93.2 | 60.0 | 66.9 |
| 04/06/2013 | 131.1 | 91.5 | 58.1 | 66.6 |
| 11/06/2013 | 132.9 | 93.2 | 57.8 | 66.8 |
| 18/06/2013 | 133.1 | 93.3 | 57.0 | 66.8 |
| 25/06/2013 | 130.5 | 91.0 | 58.0 | 67.4 |
| 02/07/2013 | 128.3 | 88.9 | 59.0 | 67.2 |
| 09/07/2013 | 132.4 | 92.6 | 63.1 | 69.6 |
| 16/07/2013 | 134.4 | 94.3 | 66.6 | 71.2 |
| 23/07/2013 | 134.7 | 94.6 | 68.7 | 71.1 |
| 30/07/2013 | 132.7 | 92.8 | 67.9 | 69.8 |
| 06/08/2013 | 131.5 | 91.7 | 64.1 | 70.1 |
| 13/08/2013 | 130.0 | 90.3 | 65.6 | 70.3 |
| 20/08/2013 | 132.0 | 92.2 | 66.4 | 71.3 |
| 27/08/2013 | 133.0 | 93.0 | 66.4 | 72.3 |
| 03/09/2013 | 133.9 | 93.8 | 70.2 | 75.5 |
| 10/09/2013 | 132.1 | 92.2 | 68.1 | 76.1 |
| 17/09/2013 | 130.6 | 90.8 | 65.8 | 73.0 |
| 24/09/2013 | 126.4 | 87.1 | 63.7 | 70.8 |
| 01/10/2013 | 124.3 | 85.2 | 61.9 | 70.3 |
| 08/10/2013 | 123.6 | 84.6 | 60.1 | 70.6 |
| 15/10/2013 | 124.8 | 85.6 | 60.9 | 71.9 |
| 22/10/2013 | 125.5 | 86.2 | 59.7 | 71.7 |
| 29/10/2013 | 124.4 | 85.2 | 57.4 | 70.6 |
| 05/11/2013 | 123.7 | 84.6 | 58.9 | 71.1 |
| 12/11/2013 | 122.6 | 83.6 | 53.5 | 69.0 |
| 19/11/2013 | 124.6 | 85.3 | 48.7 | 70.7 |
| 26/11/2013 | 126.4 | 86.9 | 48.6 | 71.8 |
| 03/12/2013 | 125.4 | 86.1 | 49.4 | 73.6 |
| 10/12/2013 | 125.9 | 86.5 | 50.9 | 74.9 |
| 17/12/2013 | 124.5 | 85.2 | 52.5 | 73.0 |
| 24/12/2013 | 125.0 | 85.6 | 52.6 | 73.5 |
| 31/12/2013 | 128.3 | 88.6 | 52.6 | 74.9 |
| 07/01/2014 | 125.0 | 85.6 | 60.6 | 73.0 |
| 14/01/2014 | 125.6 | 86.2 | 54.6 | 72.6 |
| 21/01/2014 | 125.7 | 86.3 | 52.8 | 73.2 |
| 28/01/2014 | 126.6 | 87.0 | 55.1 | 74.9 |
| 04/02/2014 | 125.9 | 86.7 | 59.0 | 75.1 |
| 11/02/2014 | 127.6 | 88.2 | 57.0 | 74.4 |
| 18/02/2014 | 129.3 | 89.8 | 68.5 | 75.3 |
| 25/02/2014 | 130.7 | 91.0 | 69.7 | 75.4 |
| 04/03/2014 | 132.5 | 92.7 | 71.5 | 75.4 |
| 11/03/2014 | 131.8 | 92.1 | 70.3 | 75.9 |
| 18/03/2014 | 132.0 | 92.3 | 64.3 | 75.4 |
| 25/03/2014 | 132.9 | 93.2 | 63.4 | 74.7 |
| 01/04/2014 | 132.9 | 93.2 | 64.4 | 75.2 |
| 08/04/2014 | 133.9 | 94.1 | 65.1 | 73.7 |
| 15/04/2014 | 136.8 | 96.7 | 64.2 | 73.8 |
| 22/04/2014 | 137.7 | 97.4 | 65.5 | 75.7 |
| 29/04/2014 | 139.8 | 99.4 | 65.0 | 76.1 |
| 06/05/2014 | 136.9 | 96.8 | 64.2 | 74.8 |
| 13/05/2014 | 135.7 | 95.8 | 64.2 | 73.9 |
| 20/05/2014 | 136.0 | 95.9 | 65.2 | 75.0 |
| 27/05/2014 | 136.8 | 96.6 | 66.2 | 75.5 |
| 03/06/2014 | 137.4 | 97.2 | 70.3 | 75.0 |
| 10/06/2014 | 138.1 | 97.9 | 65.5 | 74.7 |
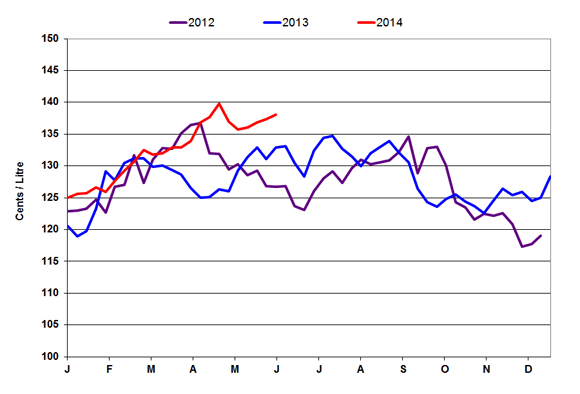
Figure 2: Weekly Regular Gasoline Prices
Note:
Edmonton Par prices are discontinued as of May 1, 2014, and replaced by the Canadian Light crude blend which is traded daily on the Net Energy Index.
Text version
Figure 2
This graph shows the gasoline price trends from 2012 to 2014.
| Date | 2012 Gasoline at Retail | Date | 2013 Gasoline at Retail | Date | 2014 Gasoline at Retail |
|---|---|---|---|---|---|
| 12-01-03 | 120.60 | 13-01-01 | 118.90 | 13-12-31 | 128.30 |
| 12-01-10 | 122.90 | 13-01-08 | 120.60 | 14-01-07 | 125.00 |
| 12-01-17 | 123.00 | 13-01-15 | 118.90 | 14-01-14 | 125.60 |
| 12-01-24 | 123.30 | 13-01-22 | 119.70 | 14-01-21 | 125.70 |
| 12-01-31 | 124.70 | 13-01-29 | 123.30 | 14-01-28 | 126.60 |
| 12-02-07 | 122.70 | 13-02-05 | 129.20 | 14-02-04 | 125.90 |
| 12-02-14 | 126.70 | 13-02-12 | 127.70 | 14-02-11 | 127.60 |
| 12-02-21 | 127.00 | 13-02-19 | 130.50 | 14-02-18 | 129.30 |
| 12-02-28 | 131.70 | 13-02-26 | 131.20 | 14-02-25 | 130.70 |
| 12-03-06 | 127.30 | 13-03-05 | 131.20 | 14-03-04 | 132.50 |
| 12-03-13 | 131.00 | 13-03-12 | 129.90 | 14-03-11 | 131.80 |
| 12-03-20 | 132.80 | 13-03-19 | 130.10 | 14-03-18 | 132.00 |
| 12-03-27 | 132.70 | 13-03-26 | 129.40 | 14-03-25 | 132.90 |
| 12-04-03 | 135.10 | 13-04-02 | 128.70 | 14-04-01 | 132.90 |
| 12-04-10 | 136.40 | 13-04-09 | 126.50 | 14-04-08 | 133.90 |
| 12-04-17 | 136.70 | 13-04-16 | 125.00 | 14-04-15 | 136.80 |
| 12-04-24 | 132.00 | 13-04-23 | 125.10 | 14-04-22 | 137.70 |
| 12-05-01 | 131.90 | 13-04-30 | 126.30 | 14-04-29 | 139.80 |
| 12-05-08 | 129.50 | 13-05-07 | 126.00 | 14-05-06 | 136.90 |
| 12-05-15 | 130.30 | 13-05-14 | 129.30 | 14-05-13 | 135.70 |
| 12-05-22 | 128.50 | 13-05-21 | 131.40 | 14-05-20 | 136.00 |
| 12-05-29 | 129.30 | 13-05-28 | 132.90 | 14-05-27 | 136.80 |
| 12-06-05 | 126.80 | 13-06-04 | 131.10 | 14-06-03 | 137.40 |
| 12-06-12 | 126.70 | 13-06-11 | 132.90 | 14-06-10 | 138.10 |
| 12-06-19 | 126.80 | 13-06-18 | 133.10 | 14-06-17 | |
| 12-06-26 | 123.70 | 13-06-25 | 130.50 | 14-06-24 | |
| 12-07-03 | 123.10 | 13-07-02 | 128.30 | 14-07-01 | |
| 12-07-10 | 126.00 | 13-07-09 | 132.40 | 14-07-08 | |
| 12-07-17 | 128.00 | 13-07-16 | 134.40 | 14-07-15 | |
| 12-07-24 | 129.20 | 13-07-23 | 134.70 | 14-07-22 | |
| 12-07-31 | 127.30 | 13-07-30 | 132.70 | 14-07-29 | |
| 12-08-07 | 129.70 | 13-08-06 | 131.50 | 14-08-05 | |
| 12-08-14 | 131.00 | 13-08-13 | 130.00 | 14-08-12 | |
| 12-08-21 | 130.30 | 13-08-20 | 132.00 | 14-08-19 | |
| 12-08-28 | 130.60 | 13-08-27 | 133.00 | 14-08-26 | |
| 12-09-04 | 130.90 | 13-09-03 | 133.90 | 14-09-02 | |
| 12-09-11 | 132.20 | 13-09-10 | 132.10 | 14-09-09 | |
| 12-09-18 | 134.60 | 13-09-17 | 130.60 | 14-09-16 | |
| 12-09-25 | 128.90 | 13-09-24 | 126.40 | 14-09-23 | |
| 12-10-02 | 132.80 | 13-10-01 | 124.30 | 14-09-30 | |
| 12-10-09 | 133.00 | 13-10-08 | 123.60 | 14-10-07 | |
| 12-10-16 | 130.10 | 13-10-15 | 124.80 | 14-10-14 | |
| 12-10-23 | 124.30 | 13-10-22 | 125.50 | 14-10-21 | |
| 12-10-30 | 123.50 | 13-10-29 | 124.40 | 14-10-28 | |
| 12-11-06 | 121.60 | 13-11-05 | 123.70 | 14-11-04 | |
| 12-11-13 | 122.50 | 13-11-12 | 122.60 | 14-11-11 | |
| 12-11-20 | 122.20 | 13-11-19 | 124.60 | 14-11-18 | |
| 12-11-27 | 122.60 | 13-11-26 | 126.40 | 14-11-25 | |
| 12-12-04 | 120.90 | 13-12-03 | 125.40 | 14-12-02 | |
| 12-12-11 | 117.30 | 13-12-10 | 125.90 | 14-12-09 | |
| 12-12-18 | 117.70 | 13-12-17 | 124.50 | 14-12-16 | |
| 12-12-25 | 119.00 | 13-12-24 | 125.00 | 14-12-23 | |
| 13-12-31 | 128.30 | 14-12-30 |
| ¢/L | Week of: 2014-06-10 | Change from: Previous Week | Change from: Last Year |
|---|---|---|---|
| Gasoline | 138.1 | +0.7 | +5.2 |
| Diesel | 135.6 | -0.2 | +11.6 |
| Furnace Oil | 127.4 | +0.3 | +9.0 |
Source: NRCan
| 2014-06-10 | ¢/kilogram | ¢/L gasoline equivalent | ¢/L diesel equivalent |
|---|---|---|---|
| Vancouver | 114.6 | 75.6 | 78.4 |
| Edmonton | 115.1 | 75.9 | 78.7 |
| Toronto | 128.3 | 84.6 | 87.8 |
Source: ¢/kg Kent Marketing Services Limited
Recent Developments
- Rising Energy Prices Squeeze Household Budgets: According to a Special Report released by Scotiabank Economics rising energy prices are eroding the purchasing power of Canadian households. Findings of the report illustrate that a discernible long-term upward trend in the cost of energy products is fuelling the growing household energy bill. The retail price of gasoline, fuel oil, electricity and water have all notably outpaced broad inflation since the 1980s, increasingly so since the new millennium. Gasoline accounts for slightly more than half (56%) of household energy expenditures. Its share of the average household budget has steadily increased over the past decade and a half, reversing the declining trend from the early 1980s through the mid-1990s. (Source: Scotiabank)
- Assessing Transportation Fuel Options: Making the right fuel mix choices to achieve real reductions in transportation GHG emissions is no easy task. All fuels have an environmental impact — there is no such thing as a perfectly “clean” fuel. Life Cycle Analysis (LCA) is a tool to systematically evaluate and compare the long and short-term environmental impacts of various fuel options and estimate the environmental consequences of a product through all stages of its life cycle — from its creation to consumption. In Canada, the most widely used LCA model is GHGenius, developed for Natural Resources Canada. (Source: Canadian Fuels Association)
Retail Gasoline Overview
The average Canadian pump price in selected cities for the four-week average ending June 10, 2014, was $1.37 per litre, an increase of nearly 1 cent per litre from the last report on May 30, 2014. This represents a 5 cent-per-litre increase compared to the same period in 2013.
The four-week average crude oil price increased by more than 1 cent per litre to 74 cents per litre compared to two weeks ago.
Retail gasoline prices in most Western centres increased by 0.3 cents per litre when compared to the previous report, and ranged from $1.23 per litre to $1.50 per litre. Prices in Eastern cities declined by 0.6 cents per litre, and ranged from $1.33 per litre to $1.45 per litre.
At the national level, refining and marketing costs and margins registered a decrease of 1 cent per litre to 23 cents per litre. This represents a decrease of 8 cents per litre compared to the same time last year.
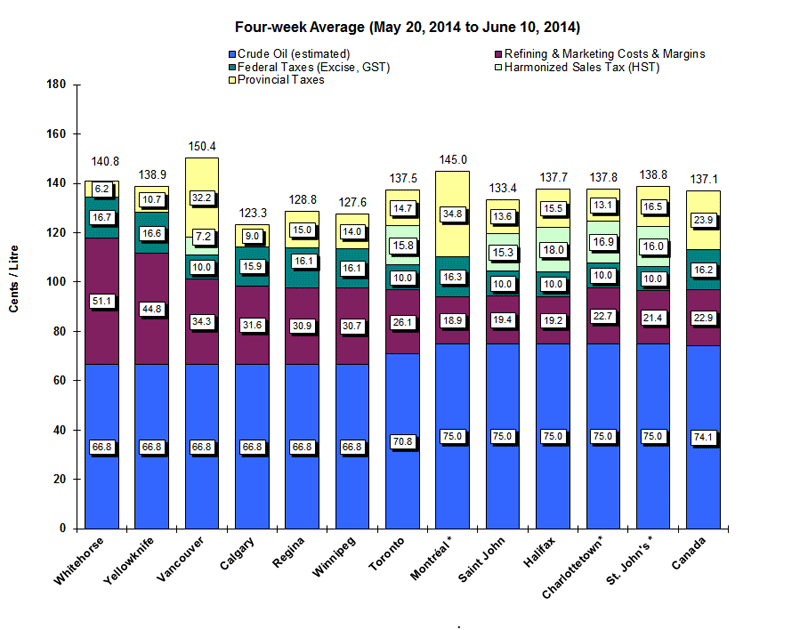
Figure 3: Regular Gasoline Pump Prices in Selected Cities Four-Week Average (May 20 to June 10, 2014)
Text version
Figure 3
This graph shows the gasoline price components for 2 territories and 10 cities plus the national average.
| Whitehorse | Yellowknife | Vancouver | Calgary | Regina | Winnipeg | Toronto | Montreal* | Saint John* | Halifax* | Charlottetown* | St. John's* | Canada | |
|---|---|---|---|---|---|---|---|---|---|---|---|---|---|
| Pump Price | 140.8 | 138.9 | 150.4 | 123.3 | 128.8 | 127.6 | 137.5 | 145.0 | 133.4 | 137.7 | 137.8 | 138.8 | 137.1 |
| Crude (est.) | 66.8 | 66.8 | 66.8 | 66.8 | 66.8 | 66.8 | 70.8 | 75.0 | 75.0 | 75.0 | 75.0 | 75.0 | 74.1 |
| Federal Taxes | 16.7 | 16.6 | 10.0 | 15.9 | 16.1 | 16.1 | 10.0 | 16.3 | 10.0 | 10.0 | 10.0 | 10.0 | 16.2 |
| Provincial Tax | 6.2 | 10.7 | 32.2 | 9.0 | 15.0 | 14.0 | 14.7 | 34.8 | 13.6 | 15.5 | 13.1 | 16.5 | 23.9 |
| HST | 7.2 | 15.8 | 15.3 | 18.0 | 16.9 | 16.0 | |||||||
| Refining & Marketing Costs & Margins | 51.1 | 44.8 | 34.3 | 31.6 | 30.9 | 30.7 | 26.1 | 18.9 | 19.4 | 19.2 | 22.7 | 21.4 | 22.9 |
Source: NRCan
* Regulated Markets
Note: Toronto crude oil cost includes pipeline tolls of $4 per barrel for light crude oil from Edmonton to Sarnia, Ontario.
Holiday Weekends and Fuel Price Increases
According to a study by MJ Ervin & Associates released May 22, 2014, week-over-week retail prices are no more likely to increase during the week immediately before a holiday. In fact, the findings revealed that the number of price increases during the week of a holiday was essentially the same as that of weeks not related to holidays.
It is a commonly held perception that retail gasoline prices rise in the days leading up to a holiday weekend, presumably as a means for fuel marketers or dealers to profit beyond what might be considered a reasonable mark-up on gasoline, from the additional car travel incurred over such weekends. The analysis is based on weekly retail price averages for regular gasoline in Vancouver, Calgary, Regina, Winnipeg, Toronto, Ottawa, Montreal, Quebec City, Halifax, and all of Canada from 2006 to April 2014.
Overall, prices were more likely to generally increase in the spring and early summer, but decrease later in the summer and into the fall. The increases (and decreases) in prices during weeks in which a holiday takes place was more likely indicative of a general and sustained trend in price movements as opposed to a response to the holiday itself. Changes were caused by underlying fluctuations in wholesale prices following global seasonal patterns in retail gasoline demand.
Source: MJ Ervin & Associates
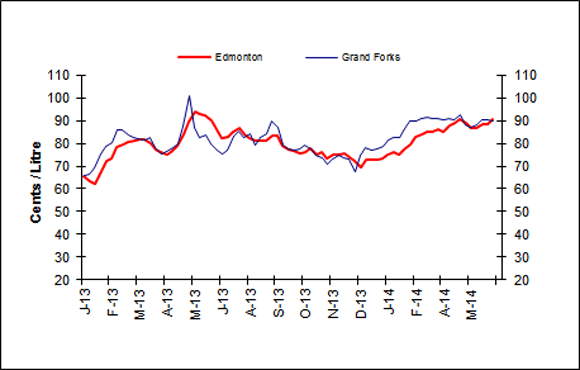
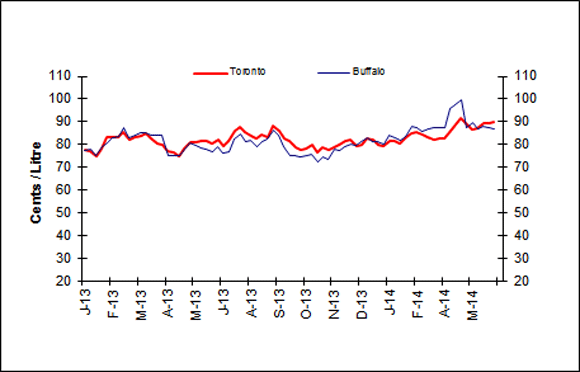
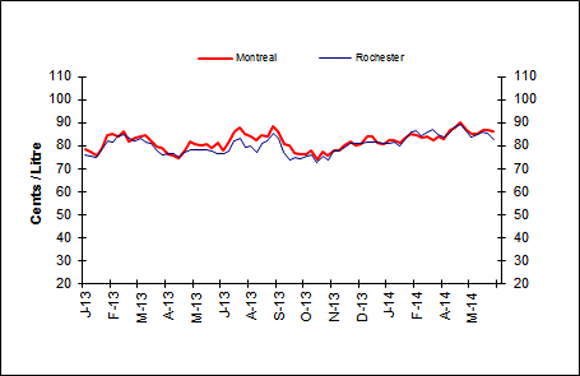
Wholesale Gasoline Prices
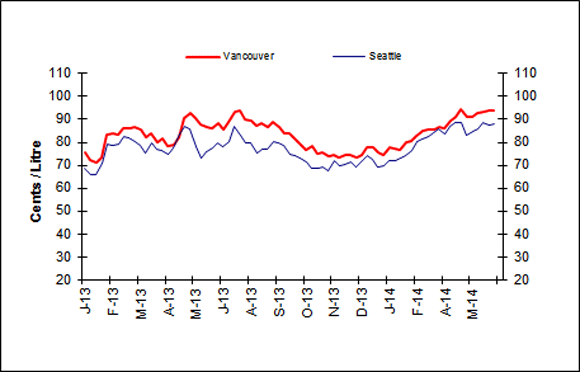
For the week of June 5, 2014, wholesale gasoline prices ranged from a decrease of nearly 3 cents per litre to an increase of 2 cents per litre.
Wholesale gasoline prices in Eastern markets in both Canada and the United States, compared to the previous week, registered increases ranging from less than 1 cent per litre to decreases of almost 3 cents per litre and ended the period in the range of 84 to 90 cents per litre.
In comparison, Western wholesale gasoline price changes ranged from a drop of less than 1 cent per litre to an increase of 2 cents per litre and prices ended the period in the range of 88 to 94 cents per litre.
 |
 |
|
 |
 |
|
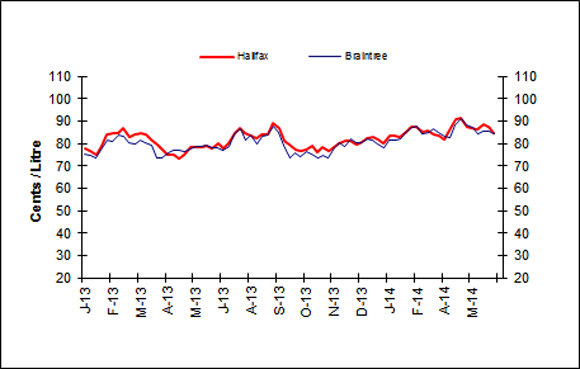 |
Text version
Figure 4
This graph shows the trend in wholesale gasoline prices for selected centres in Canada and the U.S.
| DATE | Halifax | Braintree | Montreal | Rochester | Toronto | Buffalo | Edmonton | Grand Forks | Vancouver | Seattle |
|---|---|---|---|---|---|---|---|---|---|---|
| Thu 03-Jan-13 | 77.50 | 75.42 | 78.60 | 75.82 | 77.50 | 77.31 | 65.40 | 66.07 | 75.50 | 68.79 |
| Thu 10-Jan-13 | 76.70 | 74.48 | 77.40 | 75.49 | 76.90 | 77.88 | 63.40 | 66.67 | 72.40 | 65.77 |
| Thu 17-Jan-13 | 74.80 | 73.73 | 75.40 | 74.81 | 75.00 | 74.96 | 62.40 | 69.13 | 70.90 | 65.72 |
| Thu 13-Dec-12 | 72.10 | 70.22 | 74.90 | 71.94 | 73.90 | 77.52 | 67.70 | 64.43 | 70.50 | 65.70 |
| Thu 24-Jan-13 | 79.00 | 78.00 | 79.00 | 78.15 | 78.30 | 78.93 | 66.80 | 75.06 | 73.50 | 70.59 |
| Thu 31-Jan-13 | 84.10 | 81.70 | 84.70 | 81.81 | 83.50 | 80.51 | 72.50 | 78.85 | 83.40 | 79.19 |
| Thu 07-Feb-13 | 84.60 | 80.98 | 85.10 | 81.47 | 83.20 | 83.16 | 73.10 | 80.16 | 84.00 | 78.87 |
| Thu 14-Feb-13 | 84.50 | 83.61 | 84.20 | 84.35 | 83.20 | 83.55 | 78.10 | 86.03 | 83.30 | 79.18 |
| Thu 21-Feb-13 | 86.70 | 83.01 | 85.90 | 84.51 | 85.40 | 87.44 | 79.70 | 85.90 | 86.00 | 82.60 |
| Thu 28-Feb-13 | 82.80 | 80.41 | 81.90 | 83.34 | 81.90 | 83.14 | 80.50 | 83.70 | 86.20 | 81.99 |
| Thu 07-Mar-13 | 84.10 | 80.00 | 83.60 | 82.22 | 83.30 | 84.09 | 81.00 | 82.56 | 86.90 | 80.15 |
| Thu 14-Mar-13 | 84.60 | 81.52 | 84.00 | 83.10 | 83.90 | 85.12 | 81.70 | 82.24 | 85.40 | 78.61 |
| Thu 21-Mar-13 | 84.10 | 80.55 | 84.50 | 81.59 | 84.80 | 84.95 | 81.80 | 81.66 | 82.10 | 75.28 |
| Thu 28-Mar-13 | 82.00 | 79.08 | 81.50 | 80.79 | 82.60 | 84.24 | 80.20 | 82.51 | 83.80 | 79.62 |
| Thu 04-Apr-13 | 79.40 | 73.32 | 79.50 | 77.54 | 80.60 | 84.10 | 77.40 | 78.17 | 80.20 | 77.14 |
| Thu 11-Apr-13 | 77.30 | 73.36 | 78.90 | 75.92 | 79.80 | 83.84 | 75.90 | 75.52 | 81.50 | 76.23 |
| Thu 18-Apr-13 | 74.70 | 75.92 | 76.30 | 76.28 | 77.10 | 75.04 | 74.90 | 76.41 | 78.50 | 74.77 |
| Thu 25-Apr-13 | 74.80 | 77.01 | 75.90 | 76.42 | 76.70 | 75.40 | 76.80 | 78.08 | 79.00 | 77.56 |
| Thu 02-May-13 | 73.50 | 76.65 | 74.50 | 75.00 | 75.00 | 75.38 | 78.80 | 79.70 | 82.00 | 83.51 |
| Thu 09-May-13 | 75.10 | 76.22 | 77.60 | 77.03 | 78.50 | 77.88 | 83.90 | 87.57 | 90.80 | 87.15 |
| Thu 16-May-13 | 78.10 | 77.25 | 81.50 | 78.21 | 80.90 | 80.54 | 89.30 | 101.10 | 92.50 | 85.64 |
| Thu 23-May-13 | 78.60 | 78.37 | 80.50 | 78.09 | 81.30 | 79.53 | 94.20 | 86.80 | 90.30 | 78.24 |
| Thu 30-May-13 | 78.40 | 78.36 | 79.80 | 77.90 | 81.40 | 78.43 | 92.60 | 82.64 | 87.60 | 73.33 |
| Thu 06-Jun-13 | 78.70 | 78.91 | 80.50 | 78.17 | 81.60 | 78.16 | 92.40 | 83.64 | 86.60 | 76.00 |
| Thu 13-Jun-13 | 77.80 | 78.32 | 78.90 | 77.45 | 80.60 | 76.84 | 90.20 | 79.79 | 86.00 | 77.78 |
| Thu 20-Jun-13 | 80.10 | 78.00 | 81.00 | 76.50 | 82.00 | 79.30 | 86.20 | 76.78 | 88.10 | 79.78 |
| Thu 27-Jun-13 | 77.80 | 76.96 | 78.10 | 76.22 | 79.40 | 76.41 | 82.40 | 75.29 | 85.70 | 77.93 |
| Thu 04-Jul-13 | 79.80 | 78.53 | 81.30 | 77.56 | 81.80 | 76.93 | 82.70 | 77.19 | 88.70 | 80.47 |
| Thu 11-Jul-13 | 84.60 | 84.52 | 86.30 | 82.08 | 85.80 | 82.51 | 85.00 | 83.36 | 93.40 | 87.07 |
| Thu 18-Jul-13 | 87.10 | 86.48 | 87.80 | 82.88 | 87.80 | 84.45 | 86.70 | 85.15 | 93.90 | 82.94 |
| Thu 25-Jul-15 | 84.40 | 81.63 | 84.80 | 79.09 | 85.40 | 81.21 | 84.10 | 82.55 | 89.90 | 79.53 |
| Thu 01-Aug-13 | 83.20 | 83.68 | 84.00 | 80.06 | 84.10 | 81.93 | 82.00 | 84.32 | 89.50 | 79.81 |
| Thu 08-Aug-13 | 82.30 | 79.58 | 82.20 | 76.89 | 82.60 | 78.85 | 81.10 | 78.95 | 87.00 | 75.45 |
| Thu 15-Aug-13 | 84.20 | 83.01 | 84.40 | 80.94 | 84.20 | 81.32 | 81.20 | 82.30 | 88.50 | 76.76 |
| Thu 22-Aug-13 | 83.90 | 83.75 | 84.00 | 82.03 | 83.50 | 82.16 | 80.90 | 84.32 | 86.40 | 76.73 |
| Thu 29-Aug-13 | 88.90 | 87.42 | 88.30 | 85.55 | 88.10 | 86.41 | 83.40 | 89.62 | 88.90 | 80.31 |
| Thu 05-Sep-13 | 86.70 | 84.77 | 86.20 | 83.13 | 85.90 | 84.03 | 83.20 | 86.81 | 86.50 | 79.97 |
| Thu 12-Sep-13 | 81.00 | 79.52 | 80.90 | 77.16 | 82.90 | 78.97 | 79.20 | 79.37 | 84.00 | 78.65 |
| Thu 19-Sep-13 | 79.70 | 73.77 | 80.20 | 73.60 | 81.60 | 75.45 | 77.10 | 77.32 | 83.70 | 74.59 |
| Thu 26-Sep-13 | 77.40 | 75.99 | 77.00 | 74.69 | 78.70 | 75.25 | 76.50 | 76.96 | 80.90 | 74.43 |
| Thu 03-Oct-13 | 76.50 | 73.93 | 76.00 | 74.33 | 77.80 | 74.45 | 75.60 | 77.48 | 79.10 | 73.09 |
| Thu 10-Oct-13 | 77.00 | 76.23 | 76.40 | 75.22 | 78.20 | 75.24 | 76.20 | 79.28 | 76.80 | 71.32 |
| Thu 17-Oct-13 | 78.80 | 75.48 | 78.00 | 75.66 | 79.80 | 75.64 | 77.80 | 77.39 | 78.30 | 68.82 |
| Thu 24-Oct-13 | 76.30 | 73.26 | 74.20 | 72.60 | 76.40 | 76.40 | 75.10 | 74.67 | 75.20 | 68.55 |
| Thu 31-Oct-13 | 78.40 | 74.83 | 77.40 | 75.50 | 78.90 | 74.66 | 75.90 | 73.89 | 75.50 | 69.29 |
| Thu 07-Nov-13 | 76.50 | 73.29 | 75.40 | 73.47 | 77.70 | 73.62 | 73.10 | 70.87 | 73.90 | 67.58 |
| Thu 14-Nov-13 | 78.50 | 78.01 | 77.70 | 77.49 | 78.90 | 78.23 | 74.80 | 73.14 | 74.60 | 71.77 |
| Thu 21-Nov-13 | 80.00 | 80.43 | 77.80 | 77.74 | 79.80 | 77.16 | 75.30 | 74.96 | 73.50 | 69.75 |
| Thu 28-Nov-13 | 81.30 | 78.79 | 80.20 | 79.06 | 81.60 | 79.32 | 75.50 | 73.46 | 74.60 | 70.20 |
| Thu 05-Dec-13 | 81.30 | 81.98 | 81.70 | 80.77 | 81.90 | 79.95 | 74.00 | 73.04 | 74.70 | 71.18 |
| Thu 12-Dec-13 | 79.30 | 80.57 | 80.00 | 80.76 | 79.60 | 79.52 | 72.30 | 67.30 | 73.60 | 69.01 |
| Thu 19-Dec-13 | 80.60 | 80.41 | 80.60 | 80.76 | 79.80 | 81.20 | 69.40 | 74.95 | 74.60 | 71.49 |
| Thu 26-Dec-13 | 82.50 | 82.08 | 84.20 | 81.35 | 82.80 | 82.75 | 72.70 | 77.90 | 77.80 | 73.92 |
| Thu 02-Jan-14 | 83.00 | 81.60 | 83.90 | 81.26 | 82.40 | 81.49 | 72.90 | 77.05 | 77.80 | 72.33 |
| Thu 09-Jan-14 | 81.80 | 79.89 | 81.30 | 81.25 | 80.00 | 81.12 | 72.60 | 77.50 | 75.40 | 69.37 |
| Thu 16-Jan-14 | 79.90 | 78.10 | 80.80 | 80.69 | 79.20 | 80.27 | 73.60 | 78.54 | 74.50 | 69.50 |
| Thu 23-Jan-14 | 83.30 | 81.27 | 82.50 | 80.86 | 81.50 | 84.27 | 75.20 | 81.56 | 77.80 | 72.04 |
| Thu 30-Jan-14 | 83.60 | 81.57 | 82.50 | 81.27 | 81.60 | 84.27 | 75.90 | 82.75 | 77.20 | 72.24 |
| Thu 06-Feb-14 | 83.00 | 81.77 | 81.00 | 79.85 | 80.60 | 82.00 | 75.00 | 82.38 | 76.40 | 73.02 |
| Thu 13-Feb-14 | 85.40 | 84.58 | 83.50 | 82.68 | 83.50 | 83.54 | 77.70 | 86.24 | 79.80 | 74.26 |
| Thu 20-Feb-14 | 87.30 | 87.33 | 84.90 | 85.83 | 85.20 | 88.00 | 79.60 | 89.82 | 80.40 | 76.56 |
| Thu 27-Feb-14 | 87.60 | 87.64 | 84.60 | 86.29 | 85.70 | 87.43 | 83.00 | 89.92 | 82.60 | 80.13 |
| Thu 06-Mar-14 | 85.10 | 84.56 | 83.30 | 84.37 | 84.20 | 85.84 | 84.10 | 91.11 | 84.80 | 81.55 |
| Thu 13-Mar-14 | 85.90 | 84.97 | 83.80 | 85.80 | 83.50 | 86.75 | 85.30 | 91.48 | 85.40 | 82.23 |
| Thu 20-Mar-14 | 84.20 | 86.34 | 82.40 | 86.82 | 82.10 | 87.62 | 85.00 | 91.13 | 85.70 | 84.11 |
| Thu 27-Mar-14 | 83.40 | 84.62 | 84.62 | 84.72 | 82.80 | 87.34 | 85.90 | 90.80 | 86.80 | 85.82 |
| Thu 03-Apr-14 | 81.90 | 82.99 | 83.10 | 83.94 | 82.50 | 87.19 | 85.30 | 90.11 | 85.90 | 83.37 |
| Thu 10-Apr-14 | 86.70 | 82.53 | 86.50 | 85.36 | 86.00 | 95.70 | 88.00 | 91.01 | 89.40 | 86.71 |
| Thu 17-Apr-14 | 90.60 | 88.47 | 87.90 | 88.00 | 88.70 | 97.62 | 88.80 | 90.24 | 91.20 | 88.76 |
| Thu 24-Apr-14 | 91.30 | 91.03 | 90.10 | 89.26 | 91.40 | 99.92 | 90.50 | 92.66 | 94.50 | 88.79 |
| Thu 01-May-14 | 87.60 | 88.06 | 87.00 | 86.18 | 88.80 | 87.36 | 88.70 | 88.15 | 91.30 | 83.13 |
| Thu 08-May-14 | 86.90 | 87.20 | 84.80 | 83.61 | 86.60 | 89.49 | 86.60 | 87.11 | 91.00 | 84.56 |
| Thu 15-May-14 | 86.50 | 84.35 | 85.10 | 84.57 | 87.20 | 86.86 | 86.90 | 88.18 | 92.50 | 85.56 |
| Thu 22-May-14 | 88.30 | 85.62 | 86.70 | 85.75 | 89.30 | 88.24 | 88.30 | 90.07 | 93.20 | 88.76 |
| Thu 29-May-14 | 87.30 | 85.51 | 86.80 | 85.31 | 89.40 | 87.46 | 88.60 | 90.44 | 93.60 | 87.32 |
| Thu 05-Jun-14 | 84.80 | 84.40 | 86.10 | 82.54 | 89.80 | 86.83 | 90.60 | 89.57 | 93.60 | 88.04 |
Sources: NRCan, Bloomberg Oil Buyers Guide
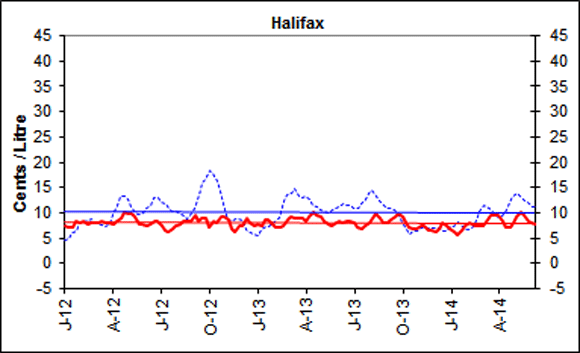
Gasoline Refining and Marketing Margins
Four-week rolling averages are used for gasoline refining and marketing margins.
Refining margins fluctuated upward in the last few months, and have been hovering around 19 cents per litre in the last five weeks, mainly because of the traditional rise in demand with the approach of the summer driving season.
These margins represent the difference between the cost of the crude oil and the wholesale price at which a refiner can sell gasoline. As demand for gasoline rises, inventories are drawn down and wholesale gasoline prices are driven up as markets try to rebalance.
Marketing margins represent the difference between the wholesale and retail prices of gasoline. This margin pays for the costs associated with operating a service station. The local retailer generally earns, on average, 7 cents per litre on gasoline sales and often relies on ancillary income from convenience stores, car washes or food outlets to help cover the site’s operating costs.
 |
 |
|
 |
 |
|
 |
 |
Text version
Figure 5
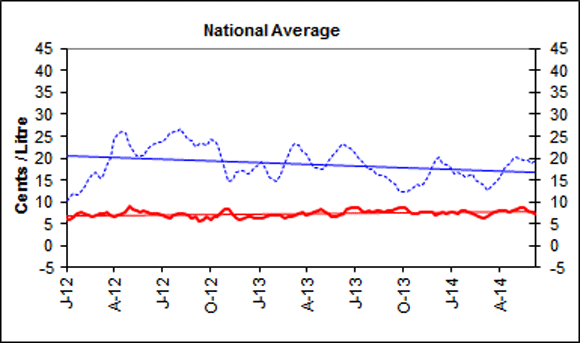
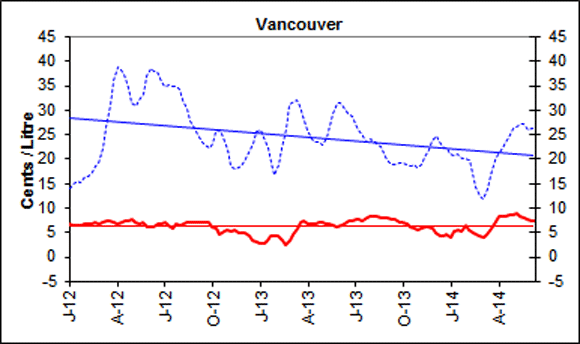
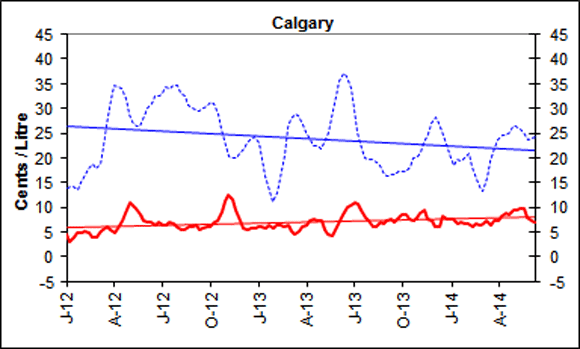
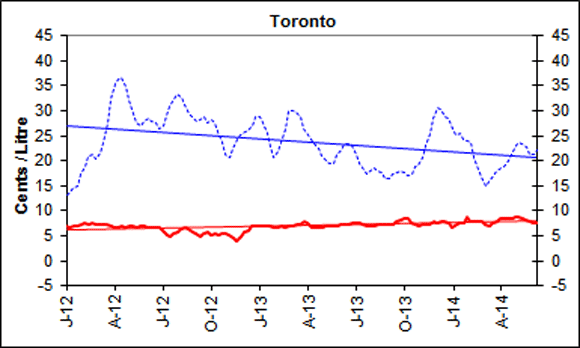
These graphs show the trend in refining and marketing costs and margins for selected centres in Canada and the national average.
| 4-week rolling average | Canada | Vancouver | Calgary | Toronto | Montreal | Halifax | ||||||
|---|---|---|---|---|---|---|---|---|---|---|---|---|
| Marketing Margin | Refining Margin | Marketing Margin | Refining Margin | Marketing Margin | Refining Margin | Marketing Margin | Refining Margin | Marketing Margin | Refining Margin | Marketing Margin | Refining Margin | |
| 2012-01-03 | 6.1 | 10.4 | 6.9 | 14.1 | 4.6 | 13.9 | 6.9 | 13.0 | 1.9 | 7.1 | 7.3 | 4.4 |
| 2012-01-10 | 6.1 | 11.3 | 6.4 | 14.9 | 3.0 | 14.2 | 6.7 | 13.8 | 3.7 | 7.5 | 7.1 | 5.0 |
| 2012-01-17 | 6.5 | 11.8 | 6.4 | 15.4 | 4.0 | 14.1 | 6.9 | 14.5 | 5.1 | 8.7 | 7.2 | 6.0 |
| 2012-01-24 | 7.3 | 11.5 | 6.3 | 15.1 | 5.0 | 13.6 | 7.0 | 14.9 | 7.5 | 9.1 | 8.3 | 6.5 |
| 2012-01-31 | 7.6 | 12.3 | 6.7 | 16.6 | 5.0 | 15.0 | 7.4 | 17.3 | 8.0 | 10.6 | 8.2 | 8.1 |
| 2012-02-07 | 7.2 | 13.6 | 6.8 | 16.6 | 5.2 | 16.5 | 7.4 | 18.9 | 6.2 | 10.6 | 8.4 | 8.2 |
| 2012-02-14 | 7.0 | 15.2 | 6.8 | 17.4 | 4.8 | 17.9 | 7.3 | 20.8 | 6.1 | 10.3 | 7.8 | 8.4 |
| 2012-02-21 | 6.6 | 16.2 | 6.9 | 18.5 | 3.9 | 18.6 | 7.5 | 21.4 | 5.1 | 10.1 | 7.9 | 8.7 |
| 2012-02-28 | 6.8 | 16.9 | 6.8 | 19.3 | 3.9 | 17.7 | 7.3 | 20.3 | 6.5 | 8.8 | 8.0 | 8.2 |
| 2012-03-06 | 7.1 | 15.4 | 7.2 | 22.2 | 4.9 | 18.9 | 7.3 | 21.6 | 6.7 | 7.7 | 8.1 | 7.9 |
| 2012-03-13 | 7.3 | 16.2 | 7.5 | 26.6 | 5.6 | 22.4 | 7.4 | 23.8 | 6.9 | 6.9 | 8.4 | 7.6 |
| 2012-03-20 | 7.5 | 18.1 | 7.5 | 31.2 | 6.0 | 26.7 | 7.2 | 27.6 | 7.8 | 6.4 | 8.0 | 7.3 |
| 2012-03-27 | 6.9 | 20.1 | 7.1 | 36.2 | 5.6 | 31.9 | 6.9 | 32.5 | 6.3 | 6.9 | 8.0 | 7.7 |
| 2012-04-03 | 6.8 | 24.3 | 6.8 | 39.0 | 4.8 | 34.7 | 6.7 | 35.3 | 7.8 | 8.7 | 7.6 | 9.6 |
| 2012-04-10 | 7.1 | 25.8 | 7.1 | 38.3 | 5.8 | 34.4 | 6.8 | 36.2 | 7.4 | 10.4 | 8.4 | 11.4 |
| 2012-04-17 | 7.5 | 26.2 | 7.5 | 37.4 | 7.2 | 33.9 | 7.0 | 36.6 | 6.9 | 12.1 | 8.8 | 13.1 |
| 2012-04-24 | 8.0 | 25.7 | 7.4 | 34.4 | 9.0 | 31.8 | 6.7 | 34.9 | 7.6 | 12.4 | 10.0 | 13.3 |
| 2012-05-01 | 9.3 | 23.3 | 7.8 | 31.6 | 11.0 | 28.9 | 7.0 | 32.0 | 6.5 | 12.6 | 9.8 | 12.6 |
| 2012-05-08 | 8.7 | 21.7 | 7.2 | 31.0 | 10.5 | 27.3 | 6.9 | 29.5 | 6.6 | 12.0 | 9.8 | 11.3 |
| 2012-05-15 | 8.4 | 20.7 | 6.8 | 32.0 | 9.7 | 26.3 | 6.6 | 27.5 | 6.8 | 11.2 | 9.2 | 10.1 |
| 2012-05-22 | 8.0 | 20.6 | 7.0 | 33.2 | 8.6 | 26.3 | 7.0 | 27.0 | 5.9 | 11.4 | 7.8 | 9.7 |
| 2012-05-29 | 8.1 | 20.5 | 6.2 | 37.0 | 7.4 | 28.4 | 6.8 | 28.0 | 7.0 | 12.0 | 7.8 | 10.1 |
| 2012-06-05 | 8.0 | 21.8 | 6.1 | 38.6 | 7.1 | 30.0 | 6.5 | 28.5 | 6.3 | 13.2 | 7.6 | 10.9 |
| 2012-06-12 | 7.5 | 22.8 | 6.2 | 37.9 | 7.0 | 30.9 | 6.7 | 27.8 | 6.2 | 14.0 | 7.9 | 11.5 |
| 2012-06-19 | 7.8 | 23.3 | 6.7 | 38.0 | 6.3 | 32.5 | 6.7 | 27.5 | 8.0 | 15.3 | 8.3 | 12.9 |
| 2012-06-26 | 7.6 | 23.7 | 6.8 | 35.7 | 6.8 | 32.5 | 6.6 | 26.5 | 6.9 | 15.2 | 8.4 | 12.9 |
| 2012-07-03 | 7.3 | 23.7 | 7.0 | 34.9 | 6.5 | 33.0 | 6.1 | 27.0 | 6.6 | 14.8 | 7.3 | 12.1 |
| 2012-07-10 | 7.0 | 24.5 | 6.6 | 35.3 | 6.3 | 34.4 | 5.3 | 29.0 | 7.4 | 14.7 | 6.4 | 11.8 |
| 2012-07-17 | 6.6 | 25.8 | 5.9 | 34.9 | 7.0 | 34.0 | 4.9 | 30.9 | 6.3 | 14.0 | 6.2 | 10.7 |
| 2012-07-24 | 7.1 | 25.9 | 6.7 | 35.0 | 6.6 | 34.6 | 5.4 | 32.5 | 7.7 | 13.6 | 6.9 | 10.3 |
| 2012-07-31 | 7.6 | 26.1 | 6.6 | 34.3 | 6.2 | 34.6 | 5.8 | 33.3 | 9.0 | 13.4 | 7.5 | 10.4 |
| 2012-08-07 | 7.5 | 26.6 | 6.8 | 32.0 | 5.3 | 33.2 | 6.3 | 32.7 | 8.1 | 13.5 | 7.6 | 9.9 |
| 2012-08-14 | 7.6 | 25.4 | 7.1 | 30.2 | 5.5 | 32.4 | 6.7 | 31.2 | 8.2 | 13.0 | 8.4 | 9.3 |
| 2012-08-21 | 7.2 | 24.5 | 7.1 | 27.9 | 6.1 | 30.7 | 6.3 | 29.3 | 6.9 | 12.8 | 8.4 | 8.8 |
| 2012-08-28 | 6.5 | 23.9 | 7.1 | 26.4 | 6.0 | 30.0 | 5.8 | 28.8 | 5.8 | 13.6 | 8.2 | 9.9 |
| 2012-09-04 | 6.5 | 22.7 | 7.1 | 25.2 | 6.5 | 29.7 | 5.5 | 27.9 | 6.1 | 13.4 | 9.6 | 10.9 |
| 2012-09-11 | 5.6 | 23.3 | 7.0 | 23.6 | 5.3 | 29.3 | 4.8 | 28.3 | 4.2 | 15.9 | 8.4 | 13.5 |
| 2012-09-18 | 6.1 | 23.3 | 7.2 | 22.8 | 5.9 | 30.1 | 5.4 | 28.8 | 4.8 | 17.3 | 9.0 | 15.8 |
| 2012-09-25 | 6.5 | 22.9 | 7.0 | 22.3 | 6.2 | 30.4 | 5.7 | 27.6 | 5.4 | 16.4 | 8.8 | 16.4 |
| 2012-10-02 | 5.9 | 24.2 | 6.3 | 23.3 | 6.0 | 31.2 | 5.3 | 28.3 | 4.3 | 18.7 | 7.0 | 18.5 |
| 2012-10-09 | 6.6 | 23.8 | 5.7 | 25.6 | 6.9 | 31.1 | 5.4 | 27.5 | 6.1 | 17.4 | 8.4 | 17.9 |
| 2012-10-16 | 6.7 | 22.9 | 4.7 | 26.6 | 7.3 | 29.3 | 5.2 | 26.3 | 6.8 | 15.7 | 8.0 | 16.6 |
| 2012-10-23 | 7.5 | 20.4 | 5.1 | 24.4 | 9.1 | 25.9 | 5.5 | 23.7 | 7.2 | 14.0 | 9.3 | 14.3 |
| 2012-10-30 | 8.5 | 17.2 | 5.5 | 21.6 | 11.4 | 22.0 | 5.5 | 20.9 | 8.6 | 10.3 | 9.3 | 10.3 |
| 2012-11-06 | 8.3 | 14.8 | 5.1 | 18.7 | 12.4 | 20.3 | 5.1 | 20.8 | 7.9 | 9.6 | 8.5 | 8.6 |
| 2012-11-13 | 7.3 | 15.1 | 5.4 | 17.2 | 11.5 | 19.3 | 4.6 | 21.7 | 5.2 | 10.4 | 6.7 | 8.7 |
| 2012-11-20 | 6.3 | 16.8 | 5.1 | 18.2 | 9.4 | 20.0 | 4.1 | 24.4 | 4.7 | 10.8 | 6.1 | 8.9 |
| 2012-11-27 | 6.0 | 17.2 | 5.0 | 18.7 | 7.3 | 21.2 | 4.9 | 25.5 | 4.4 | 10.8 | 7.4 | 8.9 |
| 2012-12-04 | 6.2 | 17.2 | 4.8 | 20.1 | 5.8 | 21.8 | 5.8 | 25.7 | 5.5 | 9.9 | 7.5 | 8.6 |
| 2012-12-11 | 6.5 | 16.3 | 4.3 | 19.3 | 5.5 | 21.0 | 6.1 | 24.0 | 6.9 | 7.9 | 9.1 | 6.3 |
| 2012-12-18 | 6.7 | 16.6 | 3.6 | 23.2 | 5.8 | 24.0 | 7.1 | 27.1 | 6.5 | 7.8 | 8.0 | 6.0 |
| 2012-12-25 | 6.4 | 17.7 | 3.0 | 25.6 | 5.8 | 24.4 | 6.8 | 28.8 | 5.4 | 7.5 | 7.4 | 5.8 |
| 2013-01-01 | 6.2 | 18.6 | 2.8 | 25.9 | 6.1 | 23.1 | 7.1 | 28.9 | 3.6 | 7.3 | 7.7 | 5.6 |
| 2013-01-08 | 6.4 | 19.0 | 2.7 | 24.5 | 6.0 | 19.8 | 7.1 | 27.6 | 4.4 | 8.0 | 7.5 | 6.6 |
| 2013-01-15 | 6.5 | 17.5 | 3.5 | 22.2 | 5.9 | 16.3 | 6.8 | 25.5 | 4.6 | 8.2 | 8.5 | 7.2 |
| 2013-01-22 | 6.9 | 15.6 | 4.4 | 20.2 | 6.3 | 14.3 | 7.0 | 23.9 | 5.5 | 8.3 | 8.5 | 7.6 |
| 2013-01-29 | 6.9 | 15.0 | 4.2 | 16.8 | 5.8 | 11.0 | 6.5 | 20.7 | 7.7 | 8.4 | 7.6 | 7.9 |
| 2013-02-05 | 7.0 | 14.6 | 4.2 | 18.2 | 6.4 | 12.3 | 6.8 | 21.1 | 8.1 | 9.5 | 7.1 | 9.2 |
| 2013-02-12 | 6.8 | 16.2 | 3.4 | 22.2 | 6.4 | 16.1 | 6.9 | 23.6 | 7.8 | 9.4 | 7.1 | 9.1 |
| 2013-02-19 | 6.4 | 18.5 | 2.4 | 25.6 | 6.2 | 19.9 | 6.8 | 25.7 | 7.0 | 11.0 | 7.4 | 10.8 |
| 2013-02-26 | 6.6 | 20.8 | 3.4 | 31.1 | 6.3 | 26.0 | 7.0 | 30.0 | 6.3 | 13.7 | 8.6 | 13.6 |
| 2013-03-05 | 6.7 | 22.7 | 4.7 | 32.0 | 5.2 | 27.8 | 7.0 | 30.1 | 6.7 | 13.9 | 9.3 | 14.0 |
| 2013-03-12 | 6.8 | 23.3 | 5.8 | 32.1 | 4.7 | 28.9 | 7.1 | 29.7 | 6.8 | 14.3 | 9.0 | 14.6 |
| 2013-03-19 | 7.2 | 23.1 | 7.0 | 31.5 | 5.1 | 29.1 | 7.4 | 29.4 | 6.8 | 12.3 | 9.1 | 12.8 |
| 2013-03-26 | 7.5 | 21.7 | 7.3 | 27.8 | 6.0 | 26.5 | 7.8 | 26.4 | 6.7 | 12.3 | 9.0 | 12.9 |
| 2013-04-02 | 7.1 | 20.9 | 6.9 | 26.5 | 6.4 | 25.8 | 7.5 | 25.6 | 5.2 | 12.6 | 8.4 | 12.9 |
| 2013-04-09 | 7.3 | 19.4 | 6.8 | 24.2 | 7.4 | 23.6 | 6.8 | 24.1 | 5.7 | 13.2 | 9.2 | 12.6 |
| 2013-04-16 | 7.8 | 17.9 | 6.9 | 22.7 | 7.7 | 21.6 | 6.7 | 22.2 | 7.2 | 11.6 | 10.1 | 10.5 |
| 2013-04-23 | 7.9 | 17.6 | 7.0 | 23.6 | 7.3 | 22.4 | 6.6 | 22.5 | 8.4 | 12.6 | 9.5 | 11.1 |
| 2013-04-30 | 8.2 | 17.6 | 7.2 | 24.1 | 7.4 | 22.9 | 6.8 | 22.2 | 9.5 | 12.2 | 9.2 | 10.6 |
| 2013-05-07 | 7.8 | 17.9 | 6.8 | 24.4 | 5.6 | 23.0 | 6.9 | 20.1 | 9.9 | 12.1 | 8.3 | 10.3 |
| 2013-05-14 | 7.4 | 19.2 | 6.7 | 27.0 | 4.4 | 25.1 | 6.9 | 19.3 | 10.2 | 12.4 | 7.8 | 10.2 |
| 2013-05-21 | 6.6 | 20.7 | 6.3 | 29.2 | 4.1 | 28.2 | 7.0 | 19.6 | 7.7 | 13.4 | 7.6 | 10.7 |
| 2013-05-28 | 6.7 | 21.3 | 6.3 | 31.3 | 5.4 | 32.2 | 7.0 | 20.8 | 6.9 | 13.8 | 8.1 | 10.9 |
| 2013-06-04 | 7.0 | 22.6 | 6.6 | 31.4 | 7.2 | 35.6 | 7.2 | 22.0 | 6.3 | 13.7 | 8.4 | 11.2 |
| 2013-06-11 | 7.3 | 23.3 | 6.8 | 29.9 | 8.5 | 36.8 | 7.2 | 22.9 | 6.4 | 13.9 | 8.1 | 11.8 |
| 2013-06-04 | 7.0 | 22.6 | 6.6 | 31.4 | 7.2 | 35.6 | 7.2 | 22.0 | 6.3 | 13.7 | 8.4 | 11.2 |
| 2013-06-11 | 7.3 | 23.3 | 6.8 | 29.9 | 8.5 | 36.8 | 7.2 | 22.9 | 6.4 | 13.9 | 8.1 | 11.8 |
| 2013-06-18 | 8.5 | 22.7 | 7.5 | 29.4 | 9.9 | 36.5 | 7.4 | 23.5 | 9.0 | 13.0 | 8.2 | 11.5 |
| 2013-06-25 | 8.7 | 22.2 | 7.5 | 29.0 | 10.4 | 34.3 | 7.6 | 23.4 | 8.8 | 12.4 | 8.3 | 11.5 |
| 2013-07-02 | 8.8 | 21.4 | 7.8 | 27.3 | 10.9 | 29.8 | 7.7 | 21.4 | 7.7 | 11.7 | 8.1 | 11.0 |
| 2013-07-09 | 8.6 | 21.3 | 7.6 | 27.5 | 10.8 | 26.9 | 7.5 | 21.2 | 7.5 | 12.1 | 7.2 | 11.7 |
| 2013-07-16 | 7.9 | 19.3 | 7.3 | 24.9 | 9.3 | 21.9 | 7.2 | 18.2 | 6.3 | 12.1 | 6.9 | 11.9 |
| 2013-07-23 | 7.8 | 18.3 | 8.0 | 23.9 | 8.0 | 20.3 | 7.0 | 17.8 | 7.0 | 12.7 | 7.4 | 12.5 |
| 2013-07-30 | 7.9 | 17.5 | 8.2 | 24.0 | 7.4 | 19.6 | 7.1 | 18.0 | 8.0 | 14.0 | 8.0 | 13.8 |
| 2013-08-06 | 7.6 | 17.4 | 8.2 | 23.6 | 6.2 | 19.4 | 6.9 | 18.2 | 7.1 | 14.5 | 9.0 | 14.4 |
| 2013-08-13 | 7.8 | 16.4 | 8.4 | 22.8 | 6.2 | 18.9 | 7.2 | 17.9 | 6.8 | 13.4 | 9.7 | 13.2 |
| 2013-08-20 | 7.9 | 16.1 | 8.0 | 23.0 | 6.9 | 18.6 | 7.3 | 17.8 | 6.6 | 12.7 | 8.8 | 12.7 |
| 2013-08-27 | 7.8 | 16.2 | 8.0 | 20.5 | 6.8 | 16.7 | 7.4 | 16.4 | 6.6 | 11.3 | 8.0 | 11.5 |
| 2013-09-03 | 7.9 | 15.2 | 8.1 | 19.5 | 7.2 | 16.4 | 7.3 | 16.5 | 6.9 | 11.4 | 8.1 | 11.7 |
| 2013-09-10 | 8.0 | 14.6 | 7.8 | 18.9 | 7.6 | 16.7 | 7.3 | 17.3 | 7.5 | 10.4 | 8.8 | 10.8 |
| 2013-09-17 | 8.2 | 14.0 | 7.6 | 17.7 | 7.1 | 15.6 | 7.9 | 16.7 | 7.2 | 9.1 | 9.1 | 9.4 |
| 2013-09-24 | 8.6 | 12.7 | 7.2 | 19.3 | 7.8 | 17.1 | 8.1 | 18.0 | 7.8 | 9.1 | 9.7 | 9.4 |
| 2013-10-01 | 8.8 | 12.1 | 7.0 | 18.4 | 8.4 | 16.3 | 8.6 | 16.8 | 7.4 | 7.3 | 9.2 | 7.9 |
| 2013-10-08 | 8.5 | 12.2 | 6.7 | 18.9 | 8.5 | 17.2 | 8.4 | 17.1 | 7.4 | 5.9 | 8.1 | 6.6 |
| 2013-10-15 | 7.8 | 12.5 | 6.2 | 18.2 | 7.5 | 17.8 | 7.6 | 17.2 | 7.3 | 5.1 | 7.0 | 6.1 |
| 2013-10-22 | 7.3 | 13.2 | 5.9 | 18.8 | 7.3 | 20.0 | 7.4 | 18.8 | 6.9 | 5.1 | 6.8 | 6.3 |
| 2013-10-29 | 7.3 | 13.9 | 5.7 | 18.1 | 7.8 | 20.1 | 6.9 | 19.1 | 7.6 | 5.1 | 6.7 | 6.3 |
| 2013-11-05 | 7.8 | 13.6 | 5.9 | 18.8 | 8.9 | 21.3 | 7.2 | 20.8 | 8.4 | 5.7 | 7.3 | 6.9 |
| 2013-11-12 | 7.8 | 14.5 | 6.0 | 18.5 | 9.5 | 21.2 | 7.4 | 21.2 | 7.6 | 6.0 | 7.4 | 7.0 |
| 2013-11-19 | 7.6 | 16.2 | 6.1 | 21.9 | 7.7 | 24.7 | 7.3 | 25.6 | 8.3 | 5.9 | 6.6 | 7.0 |
| 2013-11-26 | 7.6 | 17.8 | 5.8 | 23.7 | 7.2 | 26.9 | 7.9 | 28.3 | 8.8 | 6.8 | 6.6 | 7.8 |
| 2013-12-03 | 7.0 | 19.9 | 4.9 | 24.8 | 6.1 | 28.1 | 7.7 | 30.5 | 7.3 | 5.9 | 6.1 | 6.9 |
| 2013-12-10 | 7.3 | 20.2 | 4.5 | 24.3 | 6.1 | 27.8 | 7.9 | 30.9 | 8.3 | 6.2 | 6.9 | 7.0 |
| 2013-12-17 | 7.8 | 18.9 | 4.3 | 22.2 | 8.2 | 24.6 | 7.8 | 28.9 | 8.0 | 6.1 | 8.0 | 6.4 |
| 2013-12-24 | 7.2 | 18.4 | 4.7 | 22.3 | 7.6 | 22.9 | 7.7 | 28.5 | 5.6 | 6.8 | 7.6 | 6.5 |
| 2013-12-31 | 7.5 | 18.1 | 5.7 | 23.0 | 8.1 | 22.0 | 8.1 | 28.3 | 6.3 | 8.0 | 7.6 | 7.1 |
| 2014-01-07 | 7.7 | 16.4 | 5.2 | 20.8 | 7.6 | 18.6 | 7.4 | 25.3 | 4.7 | 8.1 | 6.3 | 7.4 |
| 2014-01-14 | 7.3 | 16.7 | 5.5 | 21.2 | 6.8 | 19.7 | 7.6 | 25.6 | 4.1 | 8.7 | 5.8 | 8.1 |
| 2014-01-21 | 7.9 | 16.3 | 5.2 | 20.1 | 7.0 | 19.4 | 7.6 | 24.3 | 6.4 | 8.1 | 6.6 | 7.7 |
| 2014-01-28 | 7.9 | 15.6 | 6.6 | 20.1 | 6.7 | 20.1 | 8.7 | 24.1 | 7.8 | 6.9 | 7.4 | 6.7 |
| 2014-02-04 | 7.6 | 16.1 | 5.5 | 20.0 | 6.7 | 21.3 | 8.0 | 24.2 | 8.2 | 6.5 | 8.1 | 6.7 |
| 2014-02-11 | 7.3 | 16.4 | 5.0 | 16.9 | 6.1 | 18.0 | 8.0 | 20.7 | 7.8 | 6.5 | 7.6 | 7.3 |
| 2014-02-18 | 7.0 | 15.0 | 4.6 | 16.4 | 6.7 | 17.7 | 7.9 | 20.3 | 6.6 | 7.2 | 7.6 | 8.7 |
| 2014-02-25 | 6.5 | 14.3 | 4.3 | 12.5 | 6.5 | 14.3 | 7.8 | 16.8 | 5.1 | 8.2 | 7.4 | 10.2 |
| 2014-03-04 | 6.3 | 14.1 | 4.0 | 11.8 | 6.7 | 13.3 | 7.2 | 15.0 | 5.0 | 9.1 | 7.4 | 11.6 |
| 2014-03-11 | 6.7 | 12.6 | 4.7 | 14.0 | 7.3 | 16.0 | 7.1 | 16.0 | 5.3 | 9.1 | 8.8 | 11.2 |
| 2014-03-18 | 7.1 | 13.3 | 5.9 | 15.3 | 6.5 | 17.9 | 7.6 | 15.7 | 6.3 | 8.5 | 9.6 | 10.4 |
| 2014-03-25 | 7.7 | 14.3 | 6.8 | 19.7 | 7.4 | 22.1 | 7.8 | 18.0 | 6.6 | 8.4 | 9.6 | 9.7 |
| 2014-04-01 | 8.1 | 15.1 | 8.3 | 21.5 | 7.3 | 24.1 | 8.4 | 18.9 | 7.0 | 8.4 | 9.4 | 8.7 |
| 2014-04-08 | 8.1 | 16.6 | 8.3 | 22.4 | 8.1 | 24.5 | 8.5 | 19.0 | 6.8 | 9.5 | 8.4 | 9.3 |
| 2014-04-15 | 7.8 | 18.2 | 8.5 | 23.7 | 9.0 | 24.9 | 8.4 | 20.3 | 5.8 | 11.1 | 7.1 | 11.0 |
| 2014-04-22 | 7.8 | 18.9 | 8.6 | 24.4 | 8.5 | 25.2 | 8.6 | 21.3 | 5.7 | 11.5 | 7.2 | 12.1 |
| 2014-04-29 | 8.0 | 20.0 | 8.7 | 26.0 | 9.3 | 26.1 | 8.7 | 23.0 | 5.9 | 12.2 | 8.2 | 13.2 |
| 2014-05-06 | 8.4 | 20.3 | 9.0 | 26.7 | 9.6 | 26.3 | 8.8 | 23.7 | 6.4 | 12.3 | 9.4 | 14.0 |
| 2014-05-13 | 8.7 | 19.8 | 8.4 | 27.4 | 9.9 | 26.0 | 8.5 | 23.5 | 7.4 | 11.5 | 10.0 | 13.3 |
| 2014-05-20 | 8.6 | 19.6 | 8.1 | 27.2 | 9.7 | 25.2 | 8.2 | 22.9 | 8.0 | 11.0 | 9.6 | 12.3 |
| 2014-05-27 | 8.0 | 19.4 | 7.7 | 27.2 | 7.9 | 24.8 | 7.8 | 22.5 | 8.0 | 10.8 | 8.4 | 12.1 |
| 2014-06-03 | 7.7 | 18.8 | 7.4 | 26.4 | 7.4 | 23.9 | 7.7 | 21.4 | 8.1 | 10.6 | 8.1 | 11.3 |
| 2014-06-10 | 7.4 | 19.4 | 7.3 | 26.4 | 6.9 | 24.3 | 7.6 | 22.0 | 7.7 | 11.2 | 7.8 | 11.3 |
Source: NRCan
Crude Oil Overview
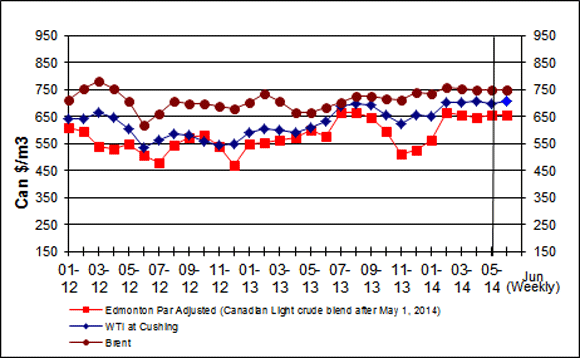
Low Volatility in World Crude Oil Prices
For the week ending June 6, 2014, prices for the three marker crudes averaged between $655/m3 and $747/m3 (US$95 to US$109 per barrel). This is a decrease in the range of $1 to $4/m3 from the previous week.
The price differential between Brent and WTI stood at almost $42/m3 (US$6 per barrel). The Canadian Light Sweet crude differential to WTI was $50/m3 (US$7 per barrel) during the same period. The three crude oil benchmarks have shown low volatility in the last four months.
High U.S. crude oil inventories remain at the upper limit of their five-year average range. This, in addition to a robust gasoline inventory, helps moderate crude oil prices.
The Organization of Petroleum Exporting Countries is scheduled to meet in Vienna on June 11, 2014. Market observers are waiting to see if the cartel decides to increase production quotas to meet anticipated higher demand during this year’s second half.
Figure 6: Crude Oil Price Comparisons
Text version
Figure 6
This graph shows crude oil prices for Edmonton Par, WTI and Brent. The average weekly prices for the period ending June 6, 2014, were $655/cubic metres, $705/cubic metres and $747/cubic metres for Edmonton Par, WTI and Brent, respectively.
| Date | Edmonton Par Prices | WTI Prices | Brent Prices |
| 01/12 | 608.11 | 639.88 | 709.45 |
| 02/12 | 594.50 | 640.89 | 750.59 |
| 03/12 | 538.60 | 663.34 | 780.71 |
| 04/12 | 528.21 | 644.60 | 751.91 |
| 05/12 | 548.81 | 601.64 | 704.10 |
| 06/12 | 507.78 | 532.76 | 618.43 |
| 07/12 | 477.07 | 560.69 | 659.07 |
| 08/12 | 544.82 | 587.49 | 707.75 |
| 09/12 | 570.15 | 582.08 | 697.56 |
| 10/12 | 578.61 | 555.66 | 694.60 |
| 11/12 | 539.87 | 543.52 | 686.30 |
| 12/12 | 467.14 | 549.56 | 680.33 |
| 01/13 | 549.97 | 592.14 | 699.83 |
| 02/13 | 553.76 | 605.29 | 736.06 |
| 03/13 | 560.66 | 598.93 | 705.36 |
| 04/13 | 571.20 | 590.06 | 663.78 |
| 05/13 | 598.81 | 608.31 | 662.59 |
| 06/13 | 577.25 | 630.51 | 680.52 |
| 07/13 | 664.03 | 685.36 | 703.73 |
| 08/13 | 665.21 | 697.44 | 722.47 |
| 09/13 | 647.06 | 691.84 | 723.16 |
| 10/13 | 592.41 | 655.54 | 713.92 |
| 11/13 | 511.65 | 620.13 | 711.21 |
| 12/13 | 524.69 | 655.42 | 740.65 |
| 01/14 | 561.87 | 651.27 | 735.43 |
| 02/14 | 665.35 | 699.89 | 756.56 |
| 03/14 | 655.67 | 701.90 | 752.47 |
| 04/14 | 647.62 | 704.92 | 747.57 |
| 05/14 | 652.85 | 697.62 | 748.13 |
| June 6, 2014 | 654.76 | 704.82 | 746.79 |
Sources: NRCan
| Crude Oil Types | Week Ending: 2014-06-06 |
Change From: Previous Week | Change From: Last Year | |||
|---|---|---|---|---|---|---|
| $Can/ m3 |
$US/ bbl |
$Can/ m3 |
$US/ bbl |
$Can/ m3 |
$US/ bbl |
|
| Canadian Light | 654.76 | 95.30 | -3.58 | -1.08 | +81.45 | +6.68 |
| WTI | 704.82 | 102.58 | -0.68 | -0.70 | +94.99 | +8.32 |
| Brent | 754.65 | 110.10 | +5.01 | -1.11 | +78.43 | +5.39 |
Source: NRCan
Canada’s Oil and Gas Statistical Overview
Canada is the world’s fifth largest natural gas producer with total marketable production averaging 14 billion cubic feet per (bcf/d).
In 2013, 58% of Canada’s natural gas production was exported, with natural gas exports to the U.S. averaging 7.89 bcf/d.
Canada is the world’s fifth largest oil producer with an average production of 3.52 million barrels per day (mb/d).
Growth in Canadian crude oil production was led by the oil sands with bitumen production reaching 2 mb/d in 2013, an increase of 8% compared to 2012.
A growing share of Canadian crude oil demand is being met by domestic production as Canadian crude oil imports continue to fall. Between 2012 and 2013, Canadian crude oil imports fell from an average of 0.72 mb/d (2012) to 0.64 mb/d in 2013.
Download the report
Fuel Focus - Printable Version [PDF, 496 KB]
To read Adobe Acrobat® files, you will need to download and install the free Acrobat Reader® software available from Adobe Systems Incorporated.
Page details
- Date modified: