
Fuel Focus, May 29, 2015
Table of Contents
- National Overview
- Recent Developments
- Retail Gasoline Overview
- Wholesale Gasoline Prices
- Gasoline Refining and Marketing Margins
- Crude Oil Overview
- Download the report
National Overview
Canadian Retail Gasoline Prices Increased by 2 cents over past two weeks
For the two-week period ending May 26, 2015, the Canadian average retail gasoline price reached $1.16 per litre. This represents an increase of 2 cents from the two-week period ending May 12, 2015. Prices are 21 cents per litre lower than last year at this time.
Average retail diesel prices increased by 1 cent per litre over the same time period reaching $1.13 per litre. This is 24 cents less than for the same period last year.
Over the same period, furnace oil prices decreased by 1 cent per litre to reach $1.08, a decrease of 19 cents per litre from a year ago.
Figure 1: Crude Oil and Regular Gasoline Price Comparison
(National Average)
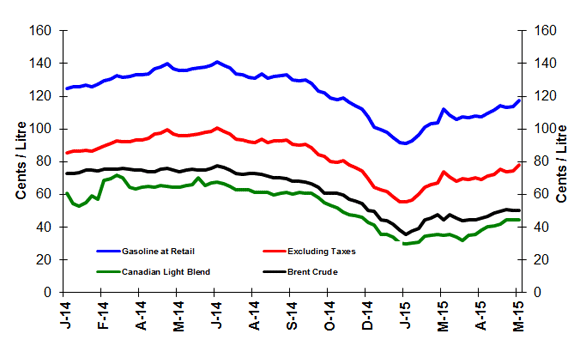
Text version
Figure 1
The graph shows prices in cents per litre for gasoline at retail, gasoline excluding taxes, and Canadian Light Sweet and Brent crude oil prices. Gasoline prices ended the period of May 26, 2015 at 117.4 cents per litre, excluding taxes at 78.0 cents per litre, Canadian Light Sweet at 44.5 cents per litre and Brent at 50.2 cents per litre.
| Dates | Gasoline at retail | Excluding Taxes | Canadian Light Sweet | Brent crude |
|---|---|---|---|---|
| 07/01/2014 | 125.0 | 85.6 | 60.6 | 73.0 |
| 14/01/2014 | 125.6 | 86.2 | 54.6 | 72.6 |
| 21/01/2014 | 125.7 | 86.3 | 52.8 | 73.2 |
| 28/01/2014 | 126.6 | 87.0 | 55.1 | 74.9 |
| 04/02/2014 | 125.9 | 86.7 | 59.0 | 75.1 |
| 11/02/2014 | 127.6 | 88.2 | 57.0 | 74.4 |
| 18/02/2014 | 129.3 | 89.8 | 68.5 | 75.3 |
| 25/02/2014 | 130.7 | 91.0 | 69.7 | 75.4 |
| 04/03/2014 | 132.5 | 92.7 | 71.5 | 75.4 |
| 11/03/2014 | 131.8 | 92.1 | 70.3 | 75.9 |
| 18/03/2014 | 132.0 | 92.3 | 64.3 | 75.4 |
| 25/03/2014 | 132.9 | 93.2 | 63.4 | 74.7 |
| 01/04/2014 | 132.9 | 93.2 | 64.4 | 75.2 |
| 08/04/2014 | 133.9 | 94.1 | 65.1 | 73.7 |
| 15/04/2014 | 136.8 | 96.7 | 64.2 | 73.8 |
| 22/04/2014 | 137.7 | 97.4 | 65.5 | 75.7 |
| 29/04/2014 | 139.8 | 99.4 | 65.0 | 76.1 |
| 06/05/2014 | 136.9 | 96.8 | 64.2 | 74.8 |
| 13/05/2014 | 135.7 | 95.8 | 64.2 | 73.9 |
| 20/05/2014 | 136.0 | 95.9 | 65.2 | 75.0 |
| 27/05/2014 | 136.8 | 96.6 | 66.2 | 75.5 |
| 03/06/2014 | 137.4 | 97.2 | 70.3 | 75.0 |
| 10/06/2014 | 138.1 | 97.9 | 65.5 | 74.7 |
| 17/06/2014 | 138.8 | 98.5 | 67.1 | 76.0 |
| 24/06/2014 | 141.2 | 100.7 | 67.3 | 77.8 |
| 01/07/2014 | 138.7 | 98.4 | 66.5 | 76.7 |
| 08/07/2014 | 137.2 | 97.0 | 65.2 | 74.9 |
| 15/07/2014 | 133.8 | 93.9 | 62.9 | 72.9 |
| 22/07/2014 | 133.0 | 93.2 | 62.7 | 72.4 |
| 29/07/2014 | 131.8 | 92.1 | 63.0 | 72.9 |
| 05/08/2014 | 131.1 | 91.5 | 63.7 | 72.9 |
| 2014-08-12 | 133.6 | 93.8 | 61.0 | 72.3 |
| 2014-08-19 | 131.3 | 91.7 | 61.1 | 71.1 |
| 26/08/2014 | 132.1 | 92.5 | 59.8 | 70.2 |
| 02/09/2014 | 132.8 | 93.0 | 60.6 | 70.4 |
| 09/09/2014 | 133.0 | 93.3 | 61.2 | 69.5 |
| 16/09/2014 | 129.9 | 90.4 | 60.5 | 68.2 |
| 23/09/2014 | 129.4 | 90.0 | 61.1 | 68.0 |
| 30/09/2014 | 130.1 | 90.6 | 60.6 | 67.6 |
| 07/10/2014 | 128.0 | 88.8 | 60.8 | 66.4 |
| 14/10/2014 | 123.1 | 84.4 | 58.0 | 64.2 |
| 21/10/2014 | 121.9 | 83.2 | 54.8 | 60.5 |
| 28/10/2014 | 118.8 | 80.3 | 53.1 | 60.8 |
| 04/11/2014 | 117.8 | 79.5 | 51.7 | 60.8 |
| 11/11/2014 | 119.2 | 80.7 | 49.0 | 59.6 |
| 18/11/2014 | 116.2 | 78.1 | 47.5 | 57.2 |
| 25/11/2014 | 114.4 | 76.4 | 47.0 | 56.2 |
| 02/12/2014 | 112.3 | 74.4 | 45.9 | 54.3 |
| 09/12/2014 | 107.2 | 69.9 | 42.9 | 50.3 |
| 16/12/2014 | 101.1 | 64.4 | 41.4 | 49.7 |
| 23/12/2014 | 99.4 | 62.8 | 35.6 | 44.3 |
| 30/12/2014 | 98.1 | 61.6 | 35.7 | 44.2 |
| 06/01/2015 | 95.0 | 58.8 | 33.8 | 42.0 |
| 13/01/2015 | 91.5 | 55.7 | 30.5 | 38.1 |
| 20/01/2015 | 91.3 | 55.4 | 29.8 | 35.8 |
| 27/01/2015 | 92.5 | 56.5 | 30.3 | 37.6 |
| 03/02/2015 | 96.5 | 60.2 | 30.7 | 39.1 |
| 10/02/2015 | 101.2 | 64.5 | 34.7 | 44.2 |
| 17/02/2015 | 103.0 | 66.2 | 35.0 | 45.3 |
| 24/02/2015 | 103.7 | 66.8 | 35.7 | 47.7 |
| 03/03/2015 | 112.3 | 74.1 | 35.1 | 44.6 |
| 10/03/2015 | 108.6 | 70.6 | 35.4 | 47.4 |
| 17/03/2015 | 105.8 | 68.0 | 33.8 | 45.4 |
| 2015-03-24 | 107.3 | 69.5 | 31.6 | 43.7 |
| 2015-03-31 | 107.1 | 69.3 | 34.9 | 44.6 |
| 2015-04-07 | 108.1 | 70.2 | 35.6 | 44.2 |
| 2015-04-14 | 107.6 | 69.1 | 38.1 | 45.3 |
| 2015-04-21 | 109.70 | 72.8 | 40.5 | 46.8 |
| 2015-04-28 | 111.40 | 71.0 | 40.7 | 48.9 |
| 2015-05-05 | 114.5 | 75.3 | 41.8 | 49.9 |
| 2015-05-12 | 113.0 | 74.0 | 44.3 | 50.5 |
| 2015-05-19 | 113.6 | 74.6 | 44.5 | 50.1 |
| 2015-05-26 | 117.4 | 78.0 | 44.5 | 50.2 |
Figure 2: Weekly Regular Gasoline Prices
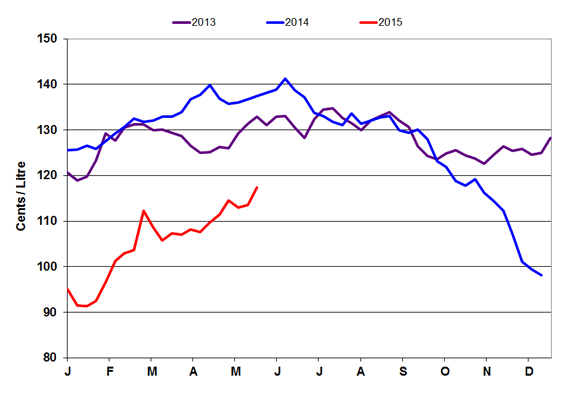
Text version
Figure 2
This graph shows the gasoline price trends from 2013 to 2015.
| Date | 2013 Gasoline at Retail | Date | 2014 Gasoline at Retail | Date | 2015 Gasoline at Retail |
|---|---|---|---|---|---|
| 13-01-01 | 118.90 | 14-01-07 | 125.00 | 15-01-06 | 95.00 |
| 13-01-08 | 120.60 | 14-01-14 | 125.60 | 15-01-13 | 91.50 |
| 13-01-15 | 118.90 | 14-01-21 | 125.70 | 15-01-20 | 91.30 |
| 13-01-22 | 119.70 | 14-01-28 | 126.60 | 15-01-27 | 92.50 |
| 13-01-29 | 123.30 | 14-02-04 | 125.90 | 15-02-03 | 96.50 |
| 13-02-05 | 129.20 | 14-02-11 | 127.60 | 15-02-10 | 101.20 |
| 13-02-12 | 127.70 | 14-02-18 | 129.30 | 15-02-17 | 103.00 |
| 13-02-19 | 130.50 | 14-02-25 | 130.70 | 15-02-24 | 103.70 |
| 13-02-26 | 131.20 | 14-03-04 | 132.50 | 15-03-03 | 112.30 |
| 13-03-05 | 131.20 | 14-03-11 | 131.80 | 15-03-10 | 108.60 |
| 13-03-12 | 129.90 | 14-03-18 | 132.00 | 15-03-17 | 105.80 |
| 13-03-19 | 130.10 | 14-03-25 | 132.90 | 15-03-24 | 107.30 |
| 13-03-26 | 129.40 | 14-04-01 | 132.90 | 15-03-31 | 107.10 |
| 13-04-02 | 128.70 | 14-04-08 | 133.90 | 15-04-07 | 108.10 |
| 13-04-09 | 126.50 | 14-04-15 | 136.80 | 15-04-14 | 107.60 |
| 13-04-16 | 125.00 | 14-04-22 | 137.70 | 15-04-21 | 109.70 |
| 13-04-23 | 125.10 | 14-04-29 | 139.80 | 15-04-28 | 111.40 |
| 13-04-30 | 126.30 | 14-05-06 | 136.90 | 15-05-05 | 114.50 |
| 13-05-07 | 126.00 | 14-05-13 | 135.70 | 15-05-12 | 113.00 |
| 13-05-14 | 129.30 | 14-05-20 | 136.00 | 15-05-19 | 113.60 |
| 13-05-21 | 131.40 | 14-05-27 | 136.80 | 15-05-26 | 117.40 |
| 13-05-28 | 132.90 | 14-06-03 | 137.40 | 15-06-02 | |
| 13-06-04 | 131.10 | 14-06-10 | 138.10 | 15-06-09 | |
| 13-06-11 | 132.90 | 14-06-17 | 138.80 | 15-06-16 | |
| 13-06-18 | 133.10 | 14-06-24 | 141.20 | 15-06-23 | |
| 13-06-25 | 130.50 | 14-07-01 | 138.70 | 15-06-30 | |
| 13-07-02 | 128.30 | 14-07-08 | 137.20 | 15-07-07 | |
| 13-07-09 | 132.40 | 14-07-15 | 133.80 | 15-07-14 | |
| 13-07-16 | 134.40 | 14-07-22 | 133.00 | 15-07-21 | |
| 13-07-23 | 134.70 | 14-07-29 | 131.80 | 15-07-28 | |
| 13-07-30 | 132.70 | 14-08-05 | 131.10 | 15-08-04 | |
| 13-08-06 | 131.50 | 14-08-12 | 133.60 | 15-08-11 | |
| 13-08-13 | 130.00 | 14-08-19 | 131.30 | 15-08-18 | |
| 13-08-20 | 132.00 | 14-08-26 | 132.10 | 15-08-25 | |
| 13-08-27 | 133.00 | 14-09-02 | 132.80 | 15-09-01 | |
| 13-09-03 | 133.90 | 14-09-09 | 133.00 | 15-09-08 | |
| 13-09-10 | 132.10 | 14-09-16 | 129.90 | 15-09-15 | |
| 13-09-17 | 130.60 | 14-09-23 | 129.40 | 15-09-22 | |
| 13-09-24 | 126.40 | 14-09-30 | 130.10 | 15-09-29 | |
| 13-10-01 | 124.30 | 14-10-07 | 128.00 | 15-10-06 | |
| 13-10-08 | 123.60 | 14-10-14 | 123.10 | 15-10-13 | |
| 13-10-15 | 124.80 | 14-10-21 | 121.90 | 15-10-20 | |
| 13-10-22 | 125.50 | 14-10-28 | 118.80 | 15-10-27 | |
| 13-10-29 | 124.40 | 14-11-04 | 117.80 | 15-11-03 | |
| 13-11-05 | 123.70 | 14-11-11 | 119.20 | 15-11-10 | |
| 13-11-12 | 122.60 | 14-11-18 | 116.20 | 15-11-17 | |
| 13-11-19 | 124.60 | 14-11-25 | 114.40 | 15-11-24 | |
| 13-11-26 | 126.40 | 14-12-02 | 112.30 | 15-12-01 | |
| 13-12-03 | 125.40 | 14-12-09 | 107.20 | 15-12-08 | |
| 13-12-10 | 125.90 | 14-12-16 | 101.10 | 15-12-15 | |
| 13-12-17 | 124.50 | 14-12-23 | 99.40 | 15-12-22 | |
| 13-12-24 | 125.00 | 14-12-30 | 98.10 | 15-12-29 | |
| 13-12-31 | 128.30 |
| ¢/L | Two week average ending: 2015-05-26 | Change from: 2 weeks ago | Change from: Last Year |
|---|---|---|---|
| Gasoline | 115.5 | +1.75 | -21 |
| Diesel | 113.1 | +0.95 | -23.8 |
| Furnace Oil | 108.4 | -0.15 | -18.5 |
| Natural Gas Prices in $CA/GJ | |||
| Alberta (NGX) | 2.77 | -0.19 | -1.49 |
| Ontario (Dawn) | 3.55 | -0.17 | -1.27 |
Source: NRCan, Bloomberg, NGX
| 2015-05-26 | ¢/kilogram | ¢/L gasoline equivalent | ¢/L diesel equivalent |
|---|---|---|---|
| Vancouver | 123.6 | 81.5 | 84.5 |
| Edmonton | 115.0 | 75.9 | 78.7 |
| Toronto | 128.4 | 84.7 | 87.8 |
Source: ¢/kg Kent Marketing Services Limited
Recent Developments
- Monthly Short-Term Energy Outlook: The U.S. Energy Information Administration (EIA) released its monthly Short-Term Energy Outlook on May 13, 2015. The report highlighted several factors that contributed to crude prices rallying in April despite increasing global inventories. These factors include: higher global oil demand growth, expected declines in U.S. tight oil production, and the growing risk of unplanned supply outages in the Middle East and North Africa. Source: US EIA
- Canada Releases Greenhouse Gas Emissions Target: On May 15, the Government of Canada announced that it plans to reduce its greenhouse gas (GHG) emissions by 30% below 2005 levels by 2030. The Government announced its intention to develop a number of regulatory measures which will be pursued in line with its sector by sector approach to reduce GHGs. These include new regulations on GHG methane emissions in the oil and gas sector, natural gas fired electricity generation and on the production of chemical and nitrogen fertilizers. Source: Government of Canada
- Benefits from Lower Gasoline Prices Weighed Down by Decrease in the Value of the Canadian Dollar: According to a study by TD Bank, the average Canadian family will save about $600 in gasoline costs in 2015 due to the decrease in oil prices. However, the Canadian dollar has also dropped making imports more expensive for the Canadian consumer. They note that most benefits to consumers from lower oil prices will likely be offset by more expensive imports in areas such as clothing and food products. Source: TD Economics
Retail Gasoline Overview
For the period ending May 26, 2015, the four-week average regular gasoline pump price in selected cities across Canada increased by 3 cents to reach $1.15 per litre compared to the previous report of May 12,2015. Compared to the same period in 2014, the average Canadian pump price is 22 cents per litre lower.
The four-week average crude component increased by 6 cents to reach 50 cents compared to two weeks ago. The crude oil price component of gasoline is 23 cents per litre lower than this time last year.
Retail gasoline prices in Western centres increased by less than 1 cent per litre compared to the previous report and ranged from 96 cents per litre to $1.33 per litre. Prices in Eastern cities increased by 1 cent per litre and ranged from $1.13 to $1.23 per litre.
At the national level, refining and marketing costs and margins remained the same at 25 cents per litre compared to the last report two weeks ago.
Figure 3: Regular Gasoline Pump Prices in Selected Cities Four-Week Average (May 5 to 26, 2015)
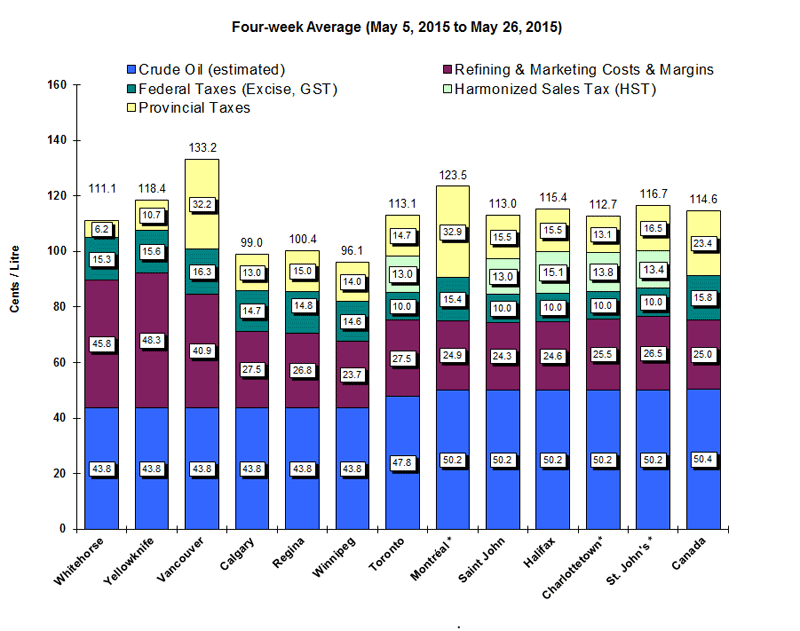
Text version
Figure 3
This graph shows the gasoline price components for 2 territories and 10 cities plus the national average.
| Whitehorse | Yellowknife | Vancouver | Calgary | Regina | Winnipeg | Toronto | Montreal* | Saint John* | Halifax* | Charlottetown* | St. John's* | Canada | |
|---|---|---|---|---|---|---|---|---|---|---|---|---|---|
| Pump Price/Prix à la pompe | 111.1 | 118.4 | 133.2 | 99.0 | 100.4 | 96.1 | 113.1 | 123.5 | 113.0 | 115.4 | 112.7 | 116.7 | 114.6 |
| Crude (est.) / Brut (est.) | 43.8 | 43.8 | 43.8 | 43.8 | 43.8 | 43.8 | 47.8 | 50.2 | 50.2 | 50.2 | 50.2 | 50.2 | 50.4 |
| Federal Taxes / Taxes fédérales | 15.3 | 15.6 | 16.3 | 14.7 | 14.8 | 14.6 | 10.0 | 15.4 | 10.0 | 10.0 | 10.0 | 10.0 | 15.8 |
| Provincial Tax / Taxe provinciale | 6.2 | 10.7 | 32.2 | 13.0 | 15.0 | 14.0 | 14.7 | 32.9 | 15.5 | 15.5 | 13.1 | 16.5 | 23.4 |
| HST | 13.0 | 13.0 | 15.1 | 13.8 | 13.4 | ||||||||
| Refining & Marketing Costs & Margins / Coûts et | 45.8 | 48.3 | 40.9 | 27.5 | 26.8 | 23.7 | 27.5 | 24.9 | 24.3 | 24.6 | 25.5 | 26.5 | 25.0 |
Source: NRCan
* Regulated Markets
Note: Toronto crude oil cost includes pipeline tolls of $4 per barrel for light crude oil from Edmonton to Sarnia, Ontario.
British Columbia Maintains Carbon Intensity Targets Under Low Carbon Fuel Regulations
The Ministry of Energy and Mines in British Columbia announced that their carbon intensity targets under the Renewable & Low Carbon Fuel Requirements Regulation will remain unchanged. The current targets require fuel suppliers to gradually reduce the amount of carbon pollution in the fuels they sell by 10% between 2010 and 2020. It also requires a minimum level of renewable fuel in both gasoline (5%) and diesel (4%).
This announcement followed an 18-month review, which accepted input from a variety of stakeholders, including refiners, biofuels producers, and environmental and health advocates. A number of recommendations came out of this process, which are currently being considered by the Ministry.
The Ministry indicated that a fundamental component for success of the Regulation is a functioning market for the exchange of compliance credits. This market is essential for enabling fuel suppliers to comply by acquiring credits when necessary. The Ministry will be working with fuel suppliers in the coming months to establish transaction protocols that enable credit trading.
The Ministry indicated that they will conduct a review of the Regulation every three years, with the next review to be conducted in 2017. They expect that by 2017, a market price for credits will have been established and can be used as an indicator for assessing future carbon intensity reduction targets within the Regulation.
Source: Government of British Columbia
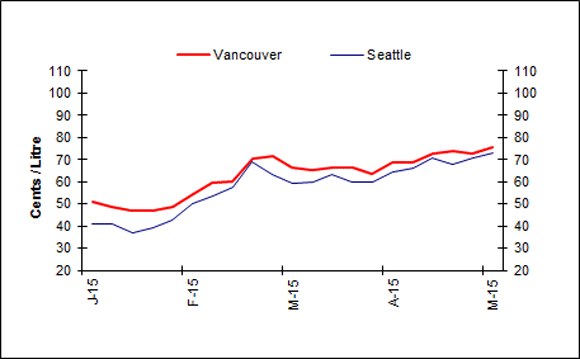
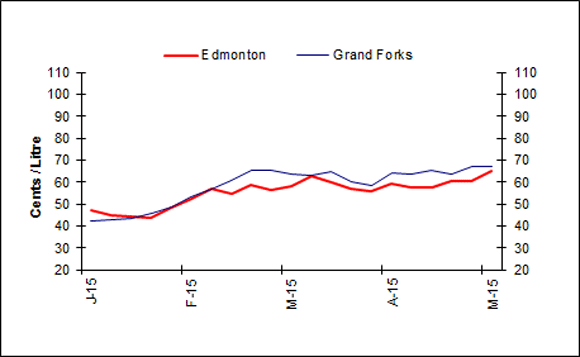
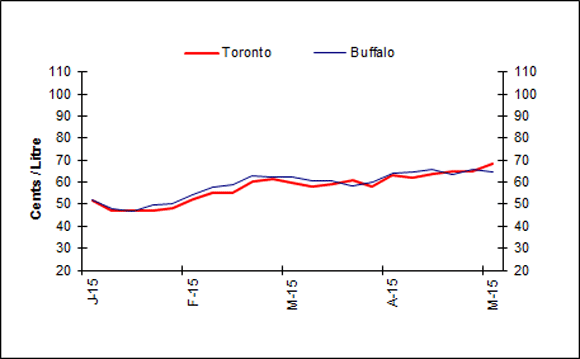
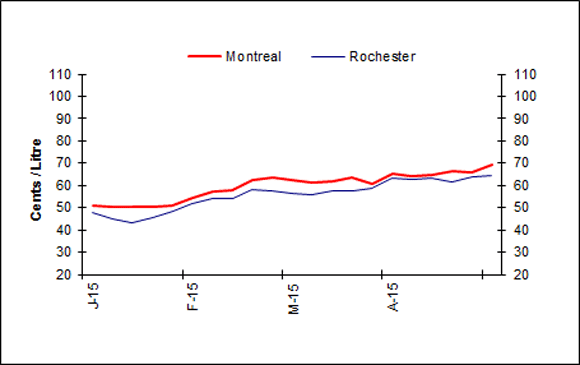
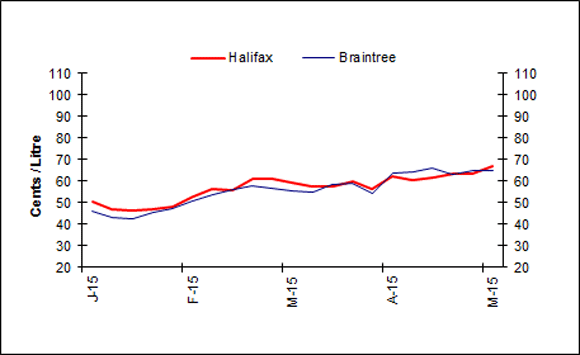
Wholesale Gasoline Prices
For the two-week period ending May 21, 2015, wholesale gasoline prices in the selected North American cities increased.
Overall, North American wholesale gasoline prices increased by between 1.5 to nearly 5 cents. Prices for the period ended in the 64- to 76-cent-per-litre range. (All figures in Canadian cents per litre).
In the Eastern markets of Canada and the U.S., wholesale gasoline price increases ranged between 1.5 cents to 3.3 cents, and ended in the 64- to 68-cent-per-litre range.
Increases in wholesale gasoline prices in Western centres ranged between 2 cents and 5 cents, and ended in the 65- to 76-cent-per-litre range.
In the last four weeks, wholesale price changes in selected Canadian and American centres increased between 1 cent and 8 cents.
 |
 |
|
 |
 |
|
 |
Text version
Figure 4
This graph shows the trend in wholesale gasoline prices for selected centres in Canada and the U.S.
| DATE | Halifax | Braintree | Montreal | Rochester | Toronto | Buffalo | Edmonton | Grand Forks | Vancouver | Seattle |
|---|---|---|---|---|---|---|---|---|---|---|
| Thu 02-Jan-14 | 83.00 | 81.60 | 83.90 | 81.26 | 82.40 | 81.49 | 72.90 | 77.05 | 77.80 | 72.33 |
| Thu 09-Jan-14 | 81.80 | 79.89 | 81.30 | 81.25 | 80.00 | 81.12 | 72.60 | 77.50 | 75.40 | 69.37 |
| Thu 16-Jan-14 | 79.90 | 78.10 | 80.80 | 80.69 | 79.20 | 80.27 | 73.60 | 78.54 | 74.50 | 69.50 |
| Thu 23-Jan-14 | 83.30 | 81.27 | 82.50 | 80.86 | 81.50 | 84.27 | 75.20 | 81.56 | 77.80 | 72.04 |
| Thu 30-Jan-14 | 83.60 | 81.57 | 82.50 | 81.27 | 81.60 | 83.07 | 75.90 | 82.75 | 77.20 | 72.24 |
| Thu 06-Feb-14 | 83.00 | 81.77 | 81.00 | 79.85 | 80.60 | 82.00 | 75.00 | 82.38 | 76.40 | 73.02 |
| Thu 13-Feb-14 | 85.40 | 84.58 | 83.50 | 82.68 | 83.50 | 83.54 | 77.70 | 86.24 | 79.80 | 74.26 |
| Thu 20-Feb-14 | 87.30 | 87.33 | 84.90 | 85.83 | 85.20 | 88.00 | 79.60 | 89.82 | 80.40 | 76.56 |
| Thu 27-Feb-14 | 87.60 | 87.64 | 84.60 | 86.29 | 85.70 | 87.43 | 83.00 | 89.92 | 82.60 | 80.13 |
| Thu 06-Mar-14 | 85.10 | 84.56 | 83.30 | 84.37 | 84.20 | 85.84 | 84.10 | 91.11 | 84.80 | 81.55 |
| Thu 13-Mar-14 | 85.90 | 84.97 | 83.80 | 85.80 | 83.50 | 86.75 | 85.30 | 91.48 | 85.40 | 82.23 |
| Thu 20-Mar-14 | 84.20 | 86.34 | 82.40 | 86.82 | 82.10 | 87.62 | 85.00 | 91.13 | 85.70 | 84.11 |
| Thu 27-Mar-14 | 83.40 | 84.62 | 84.00 | 84.72 | 82.80 | 87.34 | 85.90 | 90.80 | 86.80 | 85.82 |
| Thu 03-Apr-14 | 81.90 | 82.99 | 83.10 | 83.94 | 82.50 | 87.19 | 85.30 | 90.11 | 85.90 | 83.37 |
| Thu 10-Apr-14 | 86.70 | 82.53 | 86.50 | 85.36 | 86.00 | 95.70 | 88.00 | 91.01 | 89.40 | 86.71 |
| Thu 17-Apr-14 | 90.60 | 88.47 | 87.90 | 88.00 | 88.70 | 97.62 | 88.80 | 90.24 | 91.20 | 88.76 |
| Thu 24-Apr-14 | 91.30 | 91.03 | 90.10 | 89.26 | 91.40 | 99.92 | 90.50 | 92.66 | 94.50 | 88.79 |
| Thu 01-May-14 | 87.60 | 88.06 | 87.00 | 86.18 | 88.80 | 87.36 | 88.70 | 88.15 | 91.30 | 83.13 |
| Thu 08-May-14 | 86.90 | 87.20 | 84.80 | 83.61 | 86.60 | 89.49 | 86.60 | 87.11 | 91.00 | 84.56 |
| Thu 15-May-14 | 86.50 | 84.35 | 85.10 | 84.57 | 87.20 | 86.86 | 86.90 | 88.18 | 92.50 | 85.56 |
| Thu 22-May-14 | 88.30 | 85.62 | 86.70 | 85.75 | 89.30 | 88.24 | 88.30 | 90.07 | 93.20 | 88.76 |
| Thu 29-May-14 | 87.30 | 85.51 | 86.80 | 85.31 | 89.40 | 87.46 | 88.60 | 90.44 | 93.60 | 87.32 |
| Thu 05-Jun-14 | 84.80 | 84.40 | 86.10 | 82.54 | 89.80 | 86.83 | 90.60 | 89.57 | 93.60 | 88.04 |
| Thu 12-Jun-14 | 86.10 | 87.14 | 86.30 | 84.73 | 91.30 | 88.58 | 89.80 | 90.68 | 95.40 | 89.01 |
| Thu 19-Jun-14 | 88.80 | 87.87 | 89.70 | 86.27 | 93.50 | 88.82 | 90.50 | 91.88 | 97.40 | 90.68 |
| Thu 26-Jun-14 | 87.20 | 85.34 | 88.00 | 82.13 | 92.30 | 86.41 | 87.70 | 89.10 | 95.80 | 89.24 |
| Thu 03-Jul-14 | 85.20 | 83.69 | 86.20 | 81.51 | 91.00 | 83.83 | 86.10 | 87.49 | 92.60 | 84.50 |
| Thu 10-Jul-14 | 83.30 | 85.59 | 84.00 | 81.81 | 88.30 | 81.79 | 82.70 | 85.06 | 87.10 | 77.57 |
| Thu 17-Jul-14 | 83.00 | 80.56 | 83.20 | 80.28 | 87.00 | 80.73 | 81.10 | 83.27 | 85.90 | 80.33 |
| Thu 24-Jul-14 | 82.80 | 79.09 | 82.80 | 79.34 | 86.20 | 79.74 | 80.00 | 81.68 | 85.80 | 81.44 |
| Thu 31-Jul-14 | 83.80 | 87.46 | 83.40 | 80.18 | 86.40 | 80.24 | 82.20 | 83.30 | 87.80 | 84.44 |
| Thu 07-Aug-14 | 81.40 | 79.26 | 81.80 | 80.46 | 84.90 | 79.89 | 81.90 | 88.04 | 87.30 | 86.85 |
| Thu 14-Aug-14 | 82.60 | 77.16 | 82.40 | 79.65 | 84.90 | 78.55 | 84.30 | 84.66 | 87.00 | 84.17 |
| Thu 21-Aug-14 | 81.90 | 79.42 | 81.70 | 79.51 | 83.90 | 81.73 | 81.80 | 85.88 | 86.20 | 87.20 |
| Thu 28-Aug-14 | 83.10 | 78.90 | 82.80 | 80.35 | 84.40 | 80.39 | 82.90 | 83.88 | 86.70 | 83.98 |
| Thu 04-Sep-14 | 83.10 | 80.84 | 83.70 | 79.15 | 84.90 | 82.42 | 84.60 | 83.78 | 87.50 | 82.30 |
| Thu 11-Sep-14 | 81.50 | 76.41 | 81.80 | 76.36 | 81.60 | 81.51 | 83.70 | 81.38 | 84.00 | 76.59 |
| Thu 18-Sep-14 | 80.60 | 77.81 | 80.50 | 74.98 | 80.70 | 79.17 | 81.60 | 80.84 | 82.80 | 71.42 |
| Thu 25-Sep-14 | 83.60 | 78.95 | 83.50 | 80.27 | 83.20 | 82.88 | 82.40 | 84.63 | 81.10 | 74.90 |
| Thu 02-Oct-14 | 81.10 | 79.27 | 80.70 | 78.81 | 80.80 | 77.62 | 80.70 | 77.68 | 79.00 | 70.20 |
| Thu 09-Oct-14 | 76.90 | 79.26 | 76.00 | 68.83 | 75.10 | 72.60 | 76.90 | 75.00 | 73.00 | 62.09 |
| Thu 16-Oct-14 | 72.80 | 80.09 | 71.40 | 71.13 | 70.90 | 73.39 | 71.60 | 77.11 | 68.80 | 60.12 |
| Thu 23-Oct-14 | 73.00 | 79.88 | 71.20 | 68.07 | 71.40 | 73.20 | 71.00 | 84.35 | 68.90 | 61.00 |
| Thu 30-Oct-14 | 72.80 | 67.77 | 72.30 | 68.97 | 73.10 | 71.65 | 70.00 | 74.62 | 71.90 | 62.09 |
| Thu 06-Nov-14 | 68.60 | 67.60 | 68.40 | 68.48 | 69.50 | 72.40 | 70.10 | 69.67 | 71.40 | 67.60 |
| Thu 13-Nov-14 | 69.50 | 65.75 | 69.90 | 65.51 | 70.50 | 69.41 | 69.90 | 62.53 | 74.60 | 68.81 |
| Thu 20-Nov-14 | 68.20 | 65.89 | 68.10 | 64.70 | 68.40 | 70.32 | 65.70 | 62.55 | 70.30 | 64.40 |
| Thu 27-Nov-14 | 67.50 | 65.06 | 67.70 | 65.72 | 68.10 | 70.63 | 63.70 | 62.26 | 65.70 | 59.13 |
| Thu 04-Dec-14 | 61.90 | 58.14 | 62.40 | 58.98 | 62.70 | 62.97 | 59.20 | 56.59 | 60.20 | 51.92 |
| Thu 11-Dec-14 | 55.60 | 52.87 | 57.20 | 53.75 | 57.10 | 58.20 | 55.70 | 53.10 | 54.70 | 44.73 |
| Thu 18-Dec-14 | 53.90 | 50.11 | 55.60 | 52.37 | 55.80 | 56.36 | 52.20 | 48.09 | 54.70 | 42.88 |
| Thu 25-Dec-14 | 54.20 | 51.09 | 55.70 | 52.54 | 56.30 | 57.54 | 52.10 | 47.32 | 55.20 | 44.15 |
| Thu 01-Jan-15 | 50.20 | 45.88 | 51.30 | 47.82 | 51.70 | 52.04 | 47.20 | 42.25 | 51.20 | 41.16 |
| Thu 08-Jan-15 | 46.90 | 43.19 | 50.60 | 44.81 | 47.30 | 48.09 | 45.00 | 42.87 | 48.50 | 40.72 |
| Thu 15-Jan-15 | 46.60 | 42.30 | 50.30 | 43.50 | 47.20 | 46.68 | 44.20 | 43.28 | 47.00 | 37.04 |
| Thu 22-Jan-15 | 47.20 | 45.26 | 50.50 | 45.67 | 47.20 | 49.64 | 43.90 | 45.92 | 47.00 | 39.15 |
| Thu 29-Jan-15 | 48.20 | 47.00 | 51.00 | 48.37 | 48.00 | 50.44 | 48.40 | 48.80 | 48.80 | 42.85 |
| Thu 05-Feb-15 | 52.90 | 50.65 | 54.60 | 51.75 | 52.20 | 54.13 | 52.10 | 53.44 | 54.60 | 50.12 |
| Thu 12-Feb-15 | 56.20 | 53.56 | 57.40 | 54.19 | 55.40 | 57.51 | 56.70 | 56.48 | 59.40 | 53.76 |
| Thu 19-Feb-15 | 55.60 | 55.91 | 57.70 | 54.23 | 55.40 | 58.78 | 54.70 | 60.87 | 60.40 | 57.33 |
| Thu 26-Feb-15 | 60.80 | 57.71 | 62.30 | 58.17 | 60.20 | 62.69 | 58.60 | 65.23 | 70.30 | 68.96 |
| Thu 05-Mar-15 | 61.20 | 56.75 | 63.80 | 57.62 | 61.20 | 62.49 | 56.30 | 65.32 | 71.60 | 63.08 |
| Thu 12-Mar-15 | 59.30 | 55.45 | 62.70 | 56.74 | 62.36 | 62.36 | 58.20 | 63.71 | 66.40 | 59.34 |
| Thu 19-Mar-15 | 57.90 | 54.71 | 61.40 | 55.89 | 58.30 | 60.60 | 63.00 | 63.29 | 65.20 | 59.76 |
| Thu 26-Mar-15 | 58.10 | 58.24 | 62.00 | 57.84 | 58.90 | 60.60 | 60.10 | 64.71 | 66.30 | 63.29 |
| Thu 02-Apr-15 | 59.60 | 58.97 | 63.70 | 57.44 | 60.80 | 58.31 | 57.10 | 59.91 | 66.20 | 59.80 |
| Thu 09-Apr-15 | 59.60 | 54.12 | 60.70 | 58.63 | 57.80 | 60.01 | 55.90 | 58.28 | 63.30 | 59.94 |
| Thu 16-Apr-15 | 62.10 | 63.74 | 65.30 | 63.38 | 63.10 | 63.81 | 59.20 | 63.94 | 68.60 | 64.41 |
| Thu 23-Apr-15 | 60.70 | 64.33 | 64.20 | 62.59 | 62.20 | 64.43 | 57.80 | 63.33 | 68.60 | 66.20 |
| Thu 30 Apr-15 | 61.70 | 65.85 | 64.70 | 63.49 | 63.50 | 65.56 | 57.40 | 65.51 | 72.60 | 70.92 |
| Thu 7 May-15 | 63.50 | 63.07 | 66.60 | 61.79 | 65.20 | 63.39 | 60.20 | 63.71 | 73.80 | 67.87 |
| Thu 14 May-15 | 63.30 | 65.00 | 66.20 | 64.04 | 65.20 | 65.64 | 60.70 | 66.92 | 72.90 | 70.76 |
| Thu 21-May-15 | 66.80 | 64.92 | 69.10 | 64.28 | 68.40 | 64.92 | 65.00 | 67.13 | 75.70 | 72.83 |
Sources: NRCan, Bloomberg Oil Buyers Guide
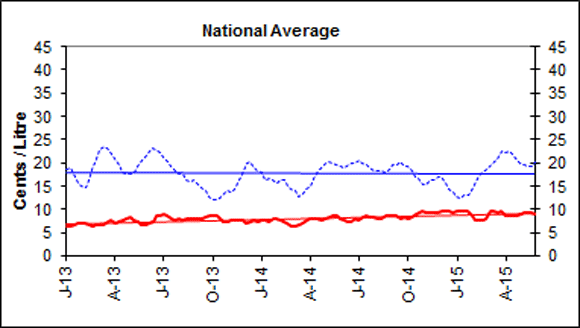
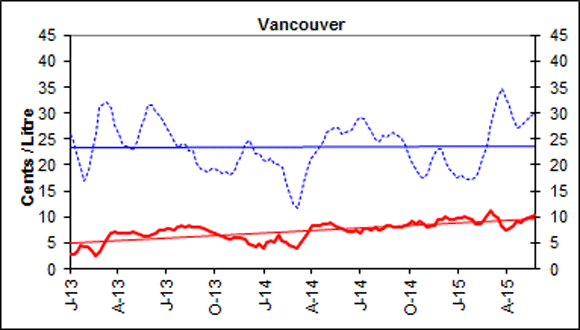
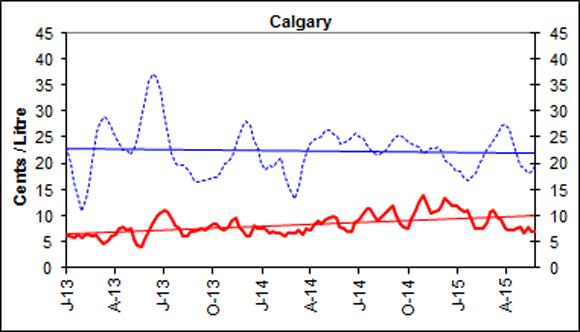
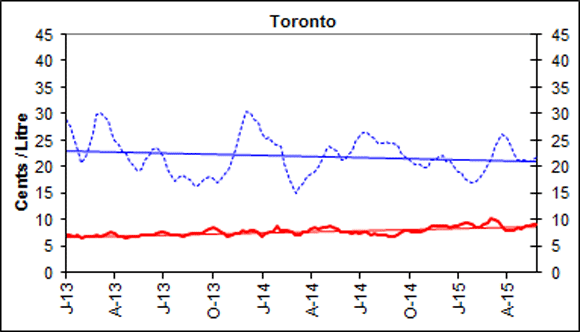
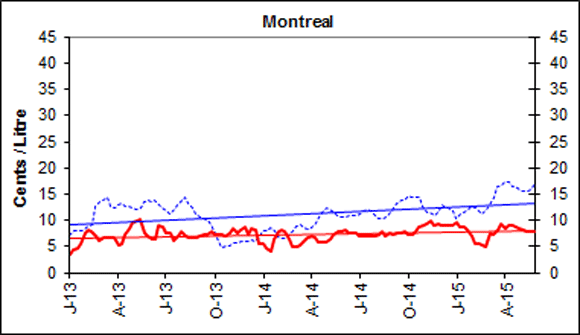
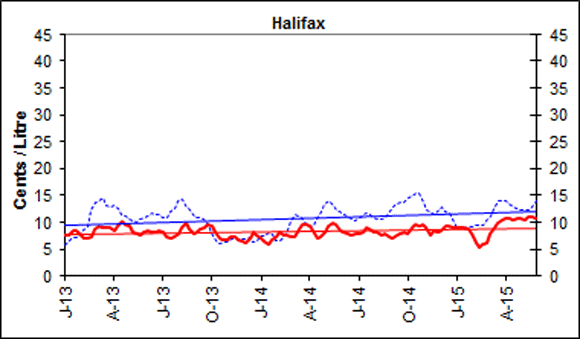
Gasoline Refining and Marketing Margins
Four-week rolling averages are used for gasoline refining and marketing margins.
These gasoline refining margins refer to the difference between the cost of crude oil and the wholesale price at which the refiner can sell gasoline. The margin includes the cost associated with refining the product as well as a profit for the retailer.
The gasoline marketing margins represent the difference between the wholesale and retail prices of gasoline. This margin pays for the costs associated with operating a service station.
Gasoline refining margins have moved upwards over the past two weeks in the major Canadian markets, shown below. This is the result of wholesale prices increasing more than crude oil prices.
Nationally, refining margins reached 19 cents per litre and are 3 cents higher this year compared to last year.
Nationally, marketing margins have been steady over the past several weeks, hovering around an average of 9 cents per litre.
 |
 |
|
 |
 |
|
 |
 |
Text version
Figure 5
These graphs show the trend in refining and marketing costs and margins for selected centres in Canada and the national average.
| 4-week rolling average | Canada | Vancouver | Calgary | Toronto | Montreal | Halifax | ||||||
|---|---|---|---|---|---|---|---|---|---|---|---|---|
| Marketing Margin | Refining Margin | Marketing Margin | Refining Margin | Marketing Margin | Refining Margin | Marketing Margin | Refining Margin | Marketing Margin | Refining Margin | Marketing Margin | Refining Margin | |
| 2013-01-01 | 6.2 | 18.6 | 2.8 | 25.9 | 6.1 | 23.1 | 7.1 | 28.9 | 3.6 | 7.3 | 7.7 | 5.6 |
| 2013-01-08 | 6.4 | 19.0 | 2.7 | 24.5 | 6.0 | 19.8 | 7.1 | 27.6 | 4.4 | 8.0 | 7.5 | 6.6 |
| 2013-01-15 | 6.5 | 17.5 | 3.5 | 22.2 | 5.9 | 16.3 | 6.8 | 25.5 | 4.6 | 8.2 | 8.5 | 7.2 |
| 2013-01-22 | 6.9 | 15.6 | 4.4 | 20.2 | 6.3 | 14.3 | 7.0 | 23.9 | 5.5 | 8.3 | 8.5 | 7.6 |
| 2013-01-29 | 6.9 | 15.0 | 4.2 | 16.8 | 5.8 | 11.0 | 6.5 | 20.7 | 7.7 | 8.4 | 7.6 | 7.9 |
| 2013-02-05 | 7.0 | 14.6 | 4.2 | 18.2 | 6.4 | 12.3 | 6.8 | 21.1 | 8.1 | 9.5 | 7.1 | 9.2 |
| 2013-02-12 | 6.8 | 16.2 | 3.4 | 22.2 | 6.4 | 16.1 | 6.9 | 23.6 | 7.8 | 9.4 | 7.1 | 9.1 |
| 2013-02-19 | 6.4 | 18.5 | 2.4 | 25.6 | 6.2 | 19.9 | 6.8 | 25.7 | 7.0 | 11.0 | 7.4 | 10.8 |
| 2013-02-26 | 6.6 | 20.8 | 3.4 | 31.1 | 6.3 | 26.0 | 7.0 | 30.0 | 6.3 | 13.7 | 8.6 | 13.6 |
| 2013-03-05 | 6.7 | 22.7 | 4.7 | 32.0 | 5.2 | 27.8 | 7.0 | 30.1 | 6.7 | 13.9 | 9.3 | 14.0 |
| 2013-03-12 | 6.8 | 23.3 | 5.8 | 32.1 | 4.7 | 28.9 | 7.1 | 29.7 | 6.8 | 14.3 | 9.0 | 14.6 |
| 2013-03-19 | 7.2 | 23.1 | 7.0 | 31.5 | 5.1 | 29.1 | 7.4 | 29.4 | 6.8 | 12.3 | 9.1 | 12.8 |
| 2013-03-26 | 7.5 | 21.7 | 7.3 | 27.8 | 6.0 | 26.5 | 7.8 | 26.4 | 6.7 | 12.3 | 9.0 | 12.9 |
| 2013-04-02 | 7.1 | 20.9 | 6.9 | 26.5 | 6.4 | 25.8 | 7.5 | 25.6 | 5.2 | 12.6 | 8.4 | 12.9 |
| 2013-04-09 | 7.3 | 19.4 | 6.8 | 24.2 | 7.4 | 23.6 | 6.8 | 24.1 | 5.7 | 13.2 | 9.2 | 12.6 |
| 2013-04-16 | 7.8 | 17.9 | 6.9 | 22.7 | 7.7 | 21.6 | 6.7 | 22.2 | 7.2 | 11.6 | 10.1 | 10.5 |
| 2013-04-23 | 7.9 | 17.6 | 7.0 | 23.6 | 7.3 | 22.4 | 6.6 | 22.5 | 8.4 | 12.6 | 9.5 | 11.1 |
| 2013-04-30 | 8.2 | 17.6 | 7.2 | 24.1 | 7.4 | 22.9 | 6.8 | 22.2 | 9.5 | 12.2 | 9.2 | 10.6 |
| 2013-05-07 | 7.8 | 17.9 | 6.8 | 24.4 | 5.6 | 23.0 | 6.9 | 20.1 | 9.9 | 12.1 | 8.3 | 10.3 |
| 2013-05-14 | 7.4 | 19.2 | 6.7 | 27.0 | 4.4 | 25.1 | 6.9 | 19.3 | 10.2 | 12.4 | 7.8 | 10.2 |
| 2013-05-21 | 6.6 | 20.7 | 6.3 | 29.2 | 4.1 | 28.2 | 7.0 | 19.6 | 7.7 | 13.4 | 7.6 | 10.7 |
| 2013-05-28 | 6.7 | 21.3 | 6.3 | 31.3 | 5.4 | 32.2 | 7.0 | 20.8 | 6.9 | 13.8 | 8.1 | 10.9 |
| 2013-06-04 | 7.0 | 22.6 | 6.6 | 31.4 | 7.2 | 35.6 | 7.2 | 22.0 | 6.3 | 13.7 | 8.4 | 11.2 |
| 2013-06-11 | 7.3 | 23.3 | 6.8 | 29.9 | 8.5 | 36.8 | 7.2 | 22.9 | 6.4 | 13.9 | 8.1 | 11.8 |
| 2013-06-18 | 8.5 | 22.7 | 7.5 | 29.4 | 9.9 | 36.5 | 7.4 | 23.5 | 9.0 | 13.0 | 8.2 | 11.5 |
| 2013-10-22 | 7.3 | 13.2 | 5.9 | 18.8 | 7.3 | 20.0 | 7.4 | 18.8 | 6.9 | 5.1 | 6.8 | 6.3 |
| 2013-10-29 | 7.3 | 13.9 | 5.7 | 18.1 | 7.8 | 20.1 | 6.9 | 19.1 | 7.6 | 5.1 | 6.7 | 6.3 |
| 2013-11-05 | 7.8 | 13.6 | 5.9 | 18.8 | 8.9 | 21.3 | 7.2 | 20.8 | 8.4 | 5.7 | 7.3 | 6.9 |
| 2013-11-12 | 7.8 | 14.5 | 6.0 | 18.5 | 9.5 | 21.2 | 7.4 | 21.2 | 7.6 | 6.0 | 7.4 | 7.0 |
| 2013-11-19 | 7.6 | 16.2 | 6.1 | 21.9 | 7.7 | 24.7 | 7.3 | 25.6 | 8.3 | 5.9 | 6.6 | 7.0 |
| 2013-11-26 | 7.6 | 17.8 | 5.8 | 23.7 | 7.2 | 26.9 | 7.9 | 28.3 | 8.8 | 6.8 | 6.6 | 7.8 |
| 2013-12-03 | 7.0 | 19.9 | 4.9 | 24.8 | 6.1 | 28.1 | 7.7 | 30.5 | 7.3 | 5.9 | 6.1 | 6.9 |
| 2013-12-10 | 7.3 | 20.2 | 4.5 | 24.3 | 6.1 | 27.8 | 7.9 | 30.9 | 8.3 | 6.2 | 6.9 | 7.0 |
| 2013-12-17 | 7.8 | 18.9 | 4.3 | 22.2 | 8.2 | 24.6 | 7.8 | 28.9 | 8.0 | 6.1 | 8.0 | 6.4 |
| 2013-12-24 | 7.2 | 18.4 | 4.7 | 22.3 | 7.6 | 22.9 | 7.7 | 28.5 | 5.6 | 6.8 | 7.6 | 6.5 |
| 2013-12-31 | 7.5 | 18.1 | 4.0 | 21.0 | 7.5 | 20.0 | 6.8 | 26.3 | 5.6 | 8.2 | 6.9 | 7.3 |
| 2014-01-07 | 7.7 | 16.4 | 5.2 | 20.8 | 7.6 | 18.6 | 7.4 | 25.3 | 4.7 | 8.1 | 6.3 | 7.4 |
| 2014-01-14 | 7.3 | 16.7 | 5.5 | 21.2 | 6.8 | 19.7 | 7.6 | 25.6 | 4.1 | 8.7 | 5.8 | 8.1 |
| 2014-01-21 | 7.9 | 16.3 | 5.2 | 20.1 | 7.0 | 19.4 | 7.6 | 24.3 | 6.4 | 8.1 | 6.6 | 7.7 |
| 2014-01-28 | 7.9 | 15.6 | 6.6 | 20.1 | 6.7 | 20.1 | 8.7 | 24.1 | 7.8 | 6.9 | 7.4 | 6.7 |
| 2014-02-04 | 7.6 | 16.1 | 5.5 | 20.0 | 6.7 | 21.3 | 8.0 | 24.2 | 8.2 | 6.5 | 8.1 | 6.7 |
| 2014-02-11 | 7.3 | 16.4 | 5.0 | 16.9 | 6.1 | 18.0 | 8.0 | 20.7 | 7.8 | 6.5 | 7.6 | 7.3 |
| 2014-02-18 | 7.0 | 15.0 | 4.6 | 16.4 | 6.7 | 17.7 | 7.9 | 20.3 | 6.6 | 7.2 | 7.6 | 8.7 |
| 2014-02-25 | 6.5 | 14.3 | 4.3 | 12.5 | 6.5 | 14.3 | 7.8 | 16.8 | 5.1 | 8.2 | 7.4 | 10.2 |
| 2014-03-04 | 6.3 | 14.1 | 4.0 | 11.8 | 6.7 | 13.3 | 7.2 | 15.0 | 5.0 | 9.1 | 7.4 | 11.6 |
| 2014-03-11 | 6.7 | 12.6 | 4.7 | 14.0 | 7.3 | 16.0 | 7.1 | 16.0 | 5.3 | 9.1 | 8.8 | 11.2 |
| 2014-03-18 | 7.1 | 13.3 | 5.9 | 15.3 | 6.5 | 17.9 | 7.6 | 15.7 | 6.3 | 8.5 | 9.6 | 10.4 |
| 2014-03-25 | 7.7 | 14.3 | 6.8 | 19.7 | 7.4 | 22.1 | 7.8 | 18.0 | 6.6 | 8.4 | 9.6 | 9.7 |
| 2014-04-01 | 8.1 | 15.1 | 8.3 | 21.5 | 7.3 | 24.1 | 8.4 | 18.9 | 7.0 | 8.4 | 9.4 | 8.7 |
| 2014-04-08 | 8.1 | 16.6 | 8.3 | 22.4 | 8.1 | 24.5 | 8.5 | 19.0 | 6.8 | 9.5 | 8.4 | 9.3 |
| 2014-04-15 | 7.8 | 18.2 | 8.5 | 23.7 | 9.0 | 24.9 | 8.4 | 20.3 | 5.8 | 11.1 | 7.1 | 11.0 |
| 2014-04-22 | 7.8 | 18.9 | 8.6 | 24.4 | 8.5 | 25.2 | 8.6 | 21.3 | 5.7 | 11.5 | 7.2 | 12.1 |
| 2014-04-29 | 8.0 | 20.0 | 8.7 | 26.0 | 9.3 | 26.1 | 8.7 | 23.0 | 5.9 | 12.2 | 8.2 | 13.2 |
| 2014-05-06 | 8.4 | 20.3 | 9.0 | 26.7 | 9.6 | 26.3 | 8.8 | 23.7 | 6.4 | 12.3 | 9.4 | 14.0 |
| 2014-05-13 | 8.7 | 19.8 | 8.4 | 27.4 | 9.9 | 26.0 | 8.5 | 23.5 | 7.4 | 11.5 | 10.0 | 13.3 |
| 2014-05-20 | 8.6 | 19.6 | 8.1 | 27.2 | 9.7 | 25.2 | 8.2 | 22.9 | 8.0 | 11.0 | 9.6 | 12.3 |
| 2014-05-27 | 8.0 | 19.4 | 7.7 | 27.2 | 7.9 | 24.8 | 7.8 | 22.5 | 8.0 | 10.8 | 8.4 | 12.1 |
| 2014-06-03 | 7.7 | 18.8 | 7.4 | 26.4 | 7.4 | 23.9 | 7.7 | 21.4 | 8.1 | 10.6 | 8.1 | 11.3 |
| 2014-06-10 | 7.4 | 19.4 | 7.3 | 26.4 | 6.9 | 24.3 | 7.6 | 22.0 | 7.7 | 11.2 | 7.8 | 11.3 |
| 2014-06-17 | 7.3 | 19.8 | 7.1 | 26.9 | 6.8 | 24.7 | 7.3 | 23.0 | 7.6 | 10.8 | 7.7 | 10.7 |
| 2014-06-24 | 7.8 | 19.9 | 7.3 | 28.5 | 8.6 | 25.7 | 7.7 | 24.8 | 7.6 | 11.0 | 8.0 | 10.5 |
| 2014-07-01 | 7.8 | 20.7 | 6.9 | 29.1 | 9.3 | 25.1 | 7.3 | 25.8 | 6.9 | 11.3 | 7.8 | 10.7 |
| 2014-07-08 | 8.2 | 20.0 | 7.7 | 28.0 | 10.0 | 24.0 | 7.7 | 25.6 | 7.1 | 10.8 | 8.2 | 10.3 |
| 2014-07-15 | 8.6 | 19.4 | 7.6 | 27.9 | 11.4 | 23.8 | 7.8 | 26.4 | 6.9 | 12.2 | 8.9 | 11.6 |
| 2014-07-22 | 8.4 | 19.0 | 7.3 | 26.2 | 11.2 | 22.4 | 7.1 | 25.6 | 7.2 | 11.6 | 8.7 | 11.3 |
| 2014-07-29 | 8.3 | 18.4 | 7.9 | 25.1 | 9.9 | 22.0 | 7.4 | 25.2 | 7.1 | 11.1 | 8.3 | 11.0 |
| 2014-08-05 | 7.9 | 18.2 | 7.6 | 24.6 | 8.9 | 21.6 | 7.2 | 24.4 | 7.2 | 10.4 | 8.1 | 10.4 |
| 2014-08-12 | 8.0 | 18.4 | 8.1 | 25.1 | 9.7 | 21.8 | 7.3 | 24.4 | 7.8 | 10.3 | 7.6 | 10.5 |
| 2014-08-19 | 8.6 | 17.8 | 8.3 | 25.2 | 10.5 | 22.3 | 7.3 | 24.2 | 7.0 | 10.1 | 7.8 | 10.4 |
| 2014-08-26 | 8.6 | 18.6 | 8.1 | 25.9 | 11.4 | 23.4 | 6.9 | 24.5 | 7.5 | 11.3 | 7.2 | 11.6 |
| 2014-09-02 | 8.4 | 19.5 | 7.9 | 26.6 | 11.8 | 24.5 | 6.8 | 24.7 | 7.4 | 12.2 | 7.0 | 12.5 |
| 2014-09-09 | 8.5 | 19.6 | 7.6 | 26.4 | 10.1 | 25.2 | 7.1 | 24.1 | 7.6 | 13.4 | 7.5 | 13.3 |
| 2014-09-16 | 8.0 | 20.1 | 8.2 | 25.4 | 8.5 | 25.4 | 7.6 | 22.9 | 7.7 | 13.4 | 7.8 | 13.3 |
| 2014-09-23 | 8.2 | 19.3 | 8.3 | 24.1 | 7.8 | 24.8 | 8.0 | 21.8 | 7.8 | 13.8 | 8.1 | 13.7 |
| 2014-09-30 | 8.1 | 19.2 | 8.6 | 22.2 | 7.5 | 24.4 | 7.9 | 21.6 | 7.3 | 14.3 | 8.0 | 14.2 |
| 2014-10-07 | 8.4 | 18.1 | 9.2 | 20.2 | 9.2 | 23.7 | 7.6 | 20.8 | 7.2 | 14.5 | 8.9 | 14.9 |
| 2014-10-14 | 8.8 | 17.0 | 8.6 | 17.9 | 11.0 | 22.1 | 7.7 | 19.2 | 8.0 | 13.2 | 9.6 | 13.9 |
| 2014-10-21 | 9.2 | 15.7 | 9.2 | 17.7 | 12.4 | 23.0 | 7.7 | 20.4 | 8.8 | 14.5 | 9.3 | 15.4 |
| 2014-10-28 | 9.6 | 13.4 | 8.5 | 16.5 | 13.8 | 21.1 | 8.0 | 18.8 | 9.2 | 12.5 | 9.6 | 13.5 |
| 2014-11-04 | 9.3 | 15.2 | 8.1 | 18.5 | 12.3 | 22.2 | 8.4 | 19.9 | 9.4 | 11.5 | 8.9 | 12.3 |
| 2014-11-11 | 9.2 | 16.2 | 8.3 | 19.7 | 10.5 | 21.9 | 8.7 | 20.2 | 9.9 | 10.6 | 7.5 | 11.1 |
| 2014-11-18 | 9.2 | 16.4 | 8.4 | 22.4 | 10.7 | 22.9 | 8.8 | 21.4 | 9.1 | 11.0 | 8.5 | 11.3 |
| 2014-11-25 | 9.2 | 16.8 | 9.4 | 22.7 | 10.9 | 22.7 | 8.7 | 21.4 | 9.4 | 10.8 | 8.3 | 11.0 |
| 2014-12-02 | 9.4 | 16.8 | 9.4 | 22.9 | 11.8 | 22.4 | 8.8 | 22.2 | 9.1 | 13.1 | 8.5 | 12.9 |
| 2014-12-09 | 9.7 | 15.7 | 9.9 | 19.4 | 13.2 | 19.6 | 8.8 | 20.1 | 8.9 | 11.5 | 9.4 | 11.1 |
| 2014-12-16 | 9.5 | 14.2 | 9.5 | 19.2 | 12.5 | 20.2 | 8.5 | 20.9 | 9.1 | 12.5 | 9.3 | 11.7 |
| 2014-12-23 | 9.4 | 13.8 | 9.5 | 18.3 | 11.8 | 19.4 | 8.8 | 20.1 | 9.1 | 11.9 | 9.0 | 10.4 |
| 2014-12-30 | 9.6 | 12.9 | 9.8 | 17.5 | 11.8 | 18.4 | 8.9 | 19.0 | 9.7 | 10.3 | 9.0 | 8.9 |
| 2015-01-06 | 9.4 | 12.5 | 9.7 | 18.1 | 11.3 | 18.3 | 9.1 | 18.9 | 8.8 | 11.2 | 9.0 | 9.0 |
| 2015-01-13 | 9.6 | 13.0 | 10.1 | 17.6 | 10.7 | 17.1 | 9.4 | 17.8 | 8.9 | 11.6 | 9.0 | 8.9 |
| 2015-01-20 | 9.5 | 12.9 | 9.9 | 17.1 | 10.9 | 16.7 | 9.4 | 17.1 | 8.3 | 12.1 | 8.8 | 9.0 |
| 2015-01-27 | 8.7 | 13.9 | 9.4 | 17.2 | 8.9 | 17.4 | 9.3 | 17.0 | 7.0 | 12.7 | 7.9 | 9.2 |
| 2015-02-03 | 7.6 | 16.1 | 8.6 | 18.9 | 7.5 | 19.3 | 8.5 | 18.3 | 5.7 | 14.0 | 6.1 | 11.0 |
| 2015-02-10 | 7.5 | 17.2 | 8.6 | 19.3 | 7.6 | 19.6 | 8.6 | 18.0 | 5.5 | 11.8 | 5.4 | 9.4 |
| 2015-02-17 | 7.6 | 18.0 | 9.3 | 21.9 | 7.6 | 21.9 | 9.0 | 19.4 | 5.3 | 12.5 | 5.8 | 10.6 |
| 2015-02-24 | 7.8 | 18.5 | 10.1 | 23.7 | 8.6 | 22.5 | 9.3 | 20.0 | 5.0 | 12.0 | 6.2 | 10.4 |
| 2015-03-03 | 9.5 | 19.1 | 11.3 | 27.3 | 10.8 | 23.7 | 10.2 | 21.7 | 7.7 | 13.2 | 7.7 | 11.6 |
| 2015-03-10 | 9.5 | 20.2 | 10.5 | 30.6 | 11.0 | 24.4 | 10.1 | 23.6 | 7.3 | 14.5 | 8.9 | 12.6 |
| 2015-03-17 | 9.4 | 20.9 | 9.7 | 32.1 | 9.7 | 24.7 | 9.6 | 24.4 | 8.3 | 15.8 | 9.9 | 13.4 |
| 2015-03-24 | 9.5 | 22.6 | 8.2 | 34.7 | 9.2 | 27.1 | 8.6 | 26.2 | 9.2 | 16.8 | 10.3 | 13.9 |
| 2015-03-31 | 8.6 | 22.3 | 7.5 | 33.3 | 7.6 | 27.3 | 8.0 | 25.7 | 8.4 | 17.3 | 10.9 | 13.9 |
| 2015-04-07 | 8.6 | 22.4 | 7.9 | 31.2 | 7.2 | 26.5 | 7.9 | 24.4 | 9.1 | 17.2 | 10.6 | 13.4 |
| 2015-04-14 | 8.7 | 21.9 | 8.3 | 30.1 | 7.4 | 25.1 | 8.1 | 23.5 | 9.2 | 17.1 | 10.6 | 13.2 |
| 2015-04-21 | 8.6 | 20.7 | 9.2 | 27.3 | 7.5 | 21.7 | 8.5 | 21.4 | 8.7 | 16.4 | 10.6 | 12.6 |
| 2015-04-28 | 8.8 | 20.0 | 9.0 | 27.3 | 7.8 | 19.6 | 8.4 | 21.2 | 8.6 | 16.0 | 10.6 | 12.3 |
| 2015-05-05 | 9.2 | 19.6 | 9.6 | 28.2 | 6.8 | 18.9 | 8.8 | 21.2 | 8.3 | 15.7 | 10.5 | 12.4 |
| 2015-05-12 | 9.3 | 19.2 | 9.7 | 29.7 | 7.9 | 19.0 | 8.8 | 21.8 | 7.8 | 15.8 | 11.0 | 12.5 |
| 2015-05-19 | 9.2 | 19.3 | 10.0 | 29.6 | 7.0 | 18.5 | 9.1 | 21.2 | 7.9 | 16.0 | 11.1 | 12.9 |
| 2015-05-26 | 9.0 | 20.1 | 10.3 | 30.0 | 7.1 | 19.7 | 9.0 | 21.9 | 7.9 | 17.0 | 10.6 | 14.0 |
Source: NRCan
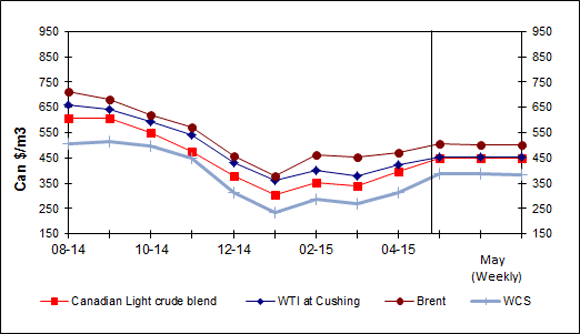
Crude Oil Overview
Declines in U.S. crude oil production and inventories leading to higher prices
For the two weeks ending May 26, 2015, prices for the three light crude benchmarks averaged between CAD$446.26 /m3 and CAD$500.60/m3 (US$58.5 and US$65.66 per barrel).
Over the past two weeks prices for Canadian light crude oil increased, while WTI and Brent prices decreased. Canadian light crude oil prices at Edmonton increased by CAD$2.77/m3 (US$0.44 per barrel) from two weeks ago, WTI decreased by CAD$0.04/m3 (US$0.24 per barrel) and Brent decreased by CAD$3.24 /m3 (US$0.70 per barrel).
The differential between Canadian light crude oil prices and the other two benchmarks has been narrowing. Currently Canadian Light crude is USD$7.2 less than Brent.
The differential between Canadian light crude and WTI has narrowed to less than USD$1, and averaged only USD$0.87 over the past two weeks. The Western Canada Select crude oil price decreased by CAD$1.88/m3 (US$0.45 per barrel) compared to two weeks ago.
U.S. crude inventories declined for the third straight week. The U.S. EIA reported that crude inventories fell by 2.7 million barrels last week, which is a larger decrease than had been expected. Inventory levels in the U.S. now stand at 482.2 million barrels.
In addition, U.S. production decreased by 112,000 bpd from 9.374 MMbpd to 9.262 MMbpd. These two factors, along with the modest drop in the USD, have contributed to the rise in crude oil prices over the past several weeks.
Figure 6: Crude Oil Price Comparisons
Text version
Figure 6
This graph shows crude oil prices for Canadian Light Sweet, WTI, Brent and WCS. The average weekly prices for the period ending May 18, 2015, were $448.15/cubic metres, $453.96/cubic metres, $501.69/cubic metres and $383.58/cubic metres for the Canadian Light, WTI, Brent and WCS, respectively.
| Dates | (Canadian Light Sweet) | WTI | Brent | WCS |
|---|---|---|---|---|
| 01/13 | 549.97 | 592.14 | 699.83 | 387.55 |
| 02/13 | 553.76 | 605.29 | 736.06 | 370.93 |
| 03/13 | 560.66 | 598.93 | 705.36 | 430.10 |
| 04/13 | 571.20 | 590.06 | 663.78 | 441.27 |
| 05/13 | 598.81 | 608.31 | 662.59 | 519.16 |
| 06/13 | 577.25 | 630.51 | 680.52 | 489.10 |
| 07/13 | 664.03 | 685.36 | 703.73 | 592.16 |
| 08/13 | 665.21 | 697.44 | 722.47 | 595.65 |
| 09/13 | 647.06 | 691.84 | 723.16 | 543.60 |
| 10/13 | 592.41 | 655.54 | 713.92 | 483.77 |
| 11/13 | 511.65 | 620.13 | 711.21 | 413.23 |
| 12/13 | 524.69 | 655.42 | 740.65 | 394.48 |
| 01/14 | 561.87 | 651.27 | 735.43 | 452.06 |
| 02/14 | 665.35 | 699.89 | 756.56 | 566.93 |
| 03/14 | 655.67 | 701.90 | 752.47 | 554.81 |
| 04/14 | 647.62 | 704.92 | 747.57 | 550.77 |
| 05/14 | 652.85 | 697.62 | 748.13 | 566.87 |
| 06/14 | 665.50 | 715.93 | 762.22 | 589.57 |
| 07/14 | 629.45 | 690.70 | 730.08 | 558.81 |
| 08/14 | 606.25 | 660.32 | 710.46 | 507.84 |
| 09/14 | 608.92 | 644.03 | 681.65 | 515.00 |
| 10/14 | 551.84 | 594.78 | 621.20 | 497.90 |
| 11/14 | 474.20 | 540.12 | 569.75 | 447.90 |
| 12/14 | 378.11 | 430.68 | 459.36 | 313.77 |
| 01/15 | 304.92 | 359.85 | 377.71 | 232.32 |
| 02/15 | 350.67 | 399.16 | 461.37 | 287.18 |
| 03-15 | 339.32 | 379.25 | 452.57 | 269.44 |
| 04-15 | 394.52 | 422.81 | 471.56 | 313.37 |
| May 4, 2015 | 446.93 | 453.49 | 505.26 | 389.32 |
| May 11, 2015 | 447.96 | 453.34 | 501.18 | 389.51 |
| May 18, 2015 | 448.15 | 453.96 | 501.69 | 383.58 |
Sources: NRCan
| Crude Oil Types | Two- Week Ending: 2015-05-26 |
Change From: Two weeks ago |
Change From: Last Year |
|||
|---|---|---|---|---|---|---|
| $Can/ m3 |
$US/ bbl |
$Can/ m3 |
$US/ bbl |
$Can/ m3 |
$US/ bbl |
|
| Canadian Light | 446.26 | 58.48 | +0.44 | +0.08 | -213.49 | -34.03 |
| WTI | 452.56 | 59.36 | -0.04 | -0.24 | -253.95 | -43.65 |
| Brent | 500.60 | 65.66 | -3.24 | -0.69 | -252.78 | -44.37 |
| WCS | 384.21 | 50.40 | -1.88 | -0.45 | -194.78 | -34.13 |
Source: NRCan
Download the report
Fuel Focus - Printable Version [PDF, 689 KB]
To read Adobe Acrobat® files, you will need to download and install the free Acrobat Reader® software available from Adobe Systems Incorporated.
Page details
- Date modified: