
How do forests benefit Canadians?

Forests play a vital role in the health, stability and well-being of our planet. Forests provide essential environmental and ecosystem services, offer recreational, health, spiritual and cultural benefits, supply crucial goods and services, and are a key source of economic prosperity across Canada.
From harvesting trees to producing every day essential goods and services (such as lumber, furniture, toilet paper and sanitary products, packaging, and biofuels for power generation in remote communities), Canadians rely on forests to meet their needs. Across the country, forests also provide economic benefits, including to rural, remote and Indigenous communities. The forest sector supports over 300 forest-reliant communities and directly employs 212,660 Canadians, including over 11,000 Indigenous people.
Key sustainability indicators
Explore the report to find information on the key sustainability indicators:
- Forest sector employment: Annual indicator of direct employment in the forest sector. This indicator is an important measure of how the forest sector contributes nationally to the economic and social welfare of Canadians.
- Forest sector average earnings: Annual average earnings in the forest sector. Trends in average earnings indicate the overall importance of the sector to the economy, especially when compared with other industries.
- Forest communities: Percentage of people working and living within Canada’s forests. Forests provide a range of important economic, cultural and environmental benefits for many Canadian rural and urban communities.
Download the report
(PDF, 17.8 MB)
Forest sector employment
Key information
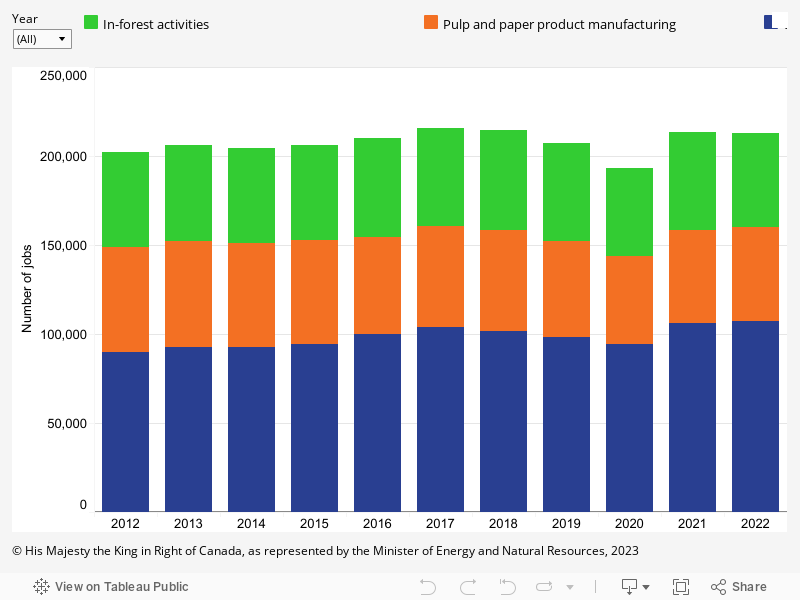
The forest sector is highly integrated, so jobs across all forest subsectors are interdependent. As a result, the closure of a mill or forest product manufacturing facility can have ripple effects throughout the supply chain—both upstream and downstream of the affected facility.
In 2022, Canada’s forest sector employed 212,660 people, which is a marginal decrease (< 1%) from 2021. According to the last census (2021), approximately 19% of forest sector workers are women, 13% are immigrants, 12% are visible minorities and 6% are Indigenous. In 2021, over 11,000 Indigenous people worked in the forest sector.
- Employment in the forest sector was fairly stable between 2021 and 2022.
- Employment in in-forest activities, which includes nursery operations, tree planting and timber cruising and logging, decreased slightly in 2022 and remains slightly below pre-pandemic levels.
- The decrease in employment in in-forest activities was offset by minor increases in employment in the wood products manufacturing and pulp and paper manufacturing subsectors.
Why is this indicator important?
The forest sector is an important employer nationwide and contributes to the economic and social welfare of Canadians. Forest sector employment is particularly important in many rural and Indigenous communities, where it is often a key source of income.
Forest sector direct employment, 2012–2022
Graph summary
Comparison of the total number of jobs in the forest sector by subsector for each year between 2012 and 2022.
Graph data
Forest sector direct employment, 2012–2022
| Year | Number of jobs | ||
|---|---|---|---|
| In-forest activities | Pulp and paper product manufacturing | Wood product manufacturing | |
| 2012 | 53,415 | 59,140 | 89,830 |
| 2013 | 54,130 | 59,175 | 92,955 |
| 2014 | 53,205 | 58,380 | 92,815 |
| 2015 | 53,630 | 58,020 | 94,540 |
| 2016 | 55,605 | 54,480 | 100,200 |
| 2017 | 55,145 | 56,820 | 103,855 |
| 2018 | 55,845 | 57,045 | 101,510 |
| 2019 | 54,715 | 54,340 | 98,130 |
| 2020 | 49,490 | 49,420 | 94,305 |
| 2021 | 54,730 | 52,210 | 106,360 |
| 2022 | 52,690 | 52,825 | 107,145 |
Forest sector average earnings
Key information
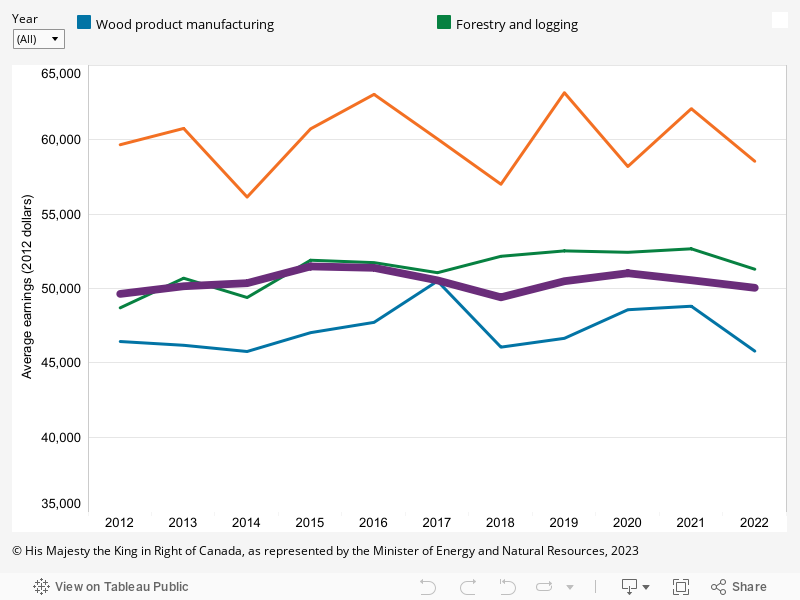
Average earnings refer to the average net annual income per person directly employed in the forest sector, not including overtime pay.
Average 2022 earnings across the forest sector fell 4.8% from record-high levels reached in 2021. Earnings hit their lowest point since 2018, averaging approximately $51,900 annually. While they are volatile year-over-year, average earnings have generally followed a stable upward trend since 2011.
- In 2022, earnings from wood product manufacturing and from forestry and logging activity were down 6.2% and 2.6%, respectively, as compared to 2021. Over the same period, average earnings in the pulp and paper product manufacturing subsector fell 5.7% as compared to 2021.
- Increasing production costs due to inflation and supply chain disruptions, fibre shortages in Western Canada and British Columbia, as well as declining lumber and panel commodity prices for the wood product manufacturing sector have led numerous facilities to curtail operations, either temporarily or permanently, which impacted compensation of the workforce in the sector.
- Overall, average earnings in the forest sector remained slightly higher than average earnings across all manufacturing jobs, but earnings for the latter only declined 1% between 2021 and 2022, to $50,000.
Why is this indicator important?
- Trends in forest sector average earnings indicate the importance of the sector to the economy and social well-being of Canadians when compared with other industries.
- Real wage growth (that is not the result of inflation) shows the change in actual purchasing power of forest sector employees.
Average earnings in the forest sector compared with all manufacturing sectors, 2012–2022
Graph summary
Comparison of average earnings in the forest sector by subsector and for all other manufacturing sectors for each year between 2012 and 2022.
Graph data
Average earnings in the forest sector compared with all manufacturing sectors, 2012–2022
| Year | Average earnings (2012 dollars) | |||
|---|---|---|---|---|
| Forestry and logging | Pulp and paper product manufacturing | Wood product manufacturing | All manufacturing | |
| 2012 | 48,700 | 59,670 | 46,433 | 49,637 |
| 2013 | 50,691 | 60,766 | 46,180 | 50,153 |
| 2014 | 49,392 | 56,150 | 45,762 | 50,358 |
| 2015 | 51,901 | 60,738 | 47,029 | 51,484 |
| 2016 | 51,740 | 63,057 | 47,722 | 51,391 |
| 2017 | 51,063 | 60,059 | 50,499 | 50,547 |
| 2018 | 52,166 | 57,013 | 46,055 | 49,407 |
| 2019 | 52,529 | 63,168 | 46,648 | 50,491 |
| 2020 | 52,434 | 58,206 | 48,572 | 51,026 |
| 2021 | 52,670 | 62,093 | 48,807 | 50,556 |
| 2022 | 51,297 | 58,558 | 45,789 | 50,047 |
Forest communities
Canada’s forests are a significant factor in the lives of people in many Indigenous and rural communities, where the forest sector is one of the largest employers.
Forests offer significant benefits to communities throughout Canada and across urban and rural areas, in terms of the environment, economy and culture.
- Over one-third of Canada’s population live in or close to forests.
- In about 300 Canadian communities, the forest industry is a key source of employment and income.
- The communities that rely on the forest sector account for about 2% of Canada’s population, or about 615,000 people.
- As of 2021, nearly one million Indigenous people live in or close to forested areas and the forest sector employs over 11,000 Indigenous people.
Why is this indicator important?
- Not only is forest sector employment in rural and Indigenous communities important for Canada’s overall economic health, but supporting Indigenous-led forestry projects is one of many ways to promote reconciliation, self-determination and economic development in Indigenous communities. Additionally, forests have cultural significance for many Indigenous Peoples. Respecting the relationship between Indigenous communities and forests and recognizing the value of Indigenous knowledge is intrinsic to implementing the United Nations Declaration on the Rights of Indigenous Peoples (UNDRIP) and fostering innovation in the forest sector.
- Forest-reliant communities have shown resilience in the face of challenges like climate change and mill closures. Supporting these communities by providing education and capacity-building is important for maintaining sustainable partnerships to overcome obstacles.
Sources and information
See Sources and information in the downloadable report for detailed sources.
Page details
- Date modified: