
How much forest does Canada have?
There are 367 million hectares (ha) of forest across Canada. This is 15 times the size of all the Great Lakes put together. Across the country, Canadians have deep connections with forests—valuing, managing and using them in different ways. Therefore, retaining Canada’s forest is vital. Since 1990, less than half of 1% has been deforested.
Canadian perspectives on and relationships with the forest are diverse and evolve over time. From biodiversity, recreation, carbon storage and water filtration, to building materials, employment opportunities and cultural identity, Canadians expect a lot from the forest. And just like the dynamic forest itself, the values we expect from the forest are evolving all the time. Regionally tailored sustainable forest management policies and practices are developed and applied across Canada to balance these diverse values and integrate stakeholder input. They are designed to be adaptive with changing attitudes towards the forest.
- Over 90% of forests in Canada are on public land; 7% are under private ownership.
- Approximately 45% of forests on public land are managed for forestry.
- Almost 10% is legally protected with an additional 3% restricted for other reasons including ecological reserves and traditional land use.
- While not entirely free of human activity, 30% of forests in Canada have no formal management plan or designation.
- Forests in Canada have global significance because of their size, biodiversity and contributions to carbon and water cycling.
Key sustainability indicators
Explore the report to find information on the key sustainability indicators:
- Forest area: Long-term trends in forest area across Canada. A relatively stable forest area is an important indication that forests are being managed sustainably and are, therefore, a stable provider of resources, biodiversity and diverse environmental services.
- Deforestation and afforestation: Estimated area of annual deforestation in Canada by industrial sectors. Low deforestation supports high levels of biodiversity and maintains the quality of soil, air and water.
- Wood volume: Long-term trends in estimated volume of wood in forests. Wood volume estimates provide information on forest productivity, available carbon storage, forest fire fuel predictions, and harvest level forecasts.
Download the report
(PDF, 17.8 MB)
Forest area
Key Information
Canada’s forests cover 367 million ha. Since 1990, less than half of 1% of Canada’s forest has been deforested—converted to non-forest land use. Relative to the size of Canada’s existing forests, very little afforestation has been recorded. Some gradual changes in forest area, including those attributed to climate change, are more challenging to quantify but include expansions in some areas and losses in others. The current estimate of forest area in Canada (367 million ha) is an improved estimate in relation to what was previously reported, and is based on better data and more advanced assessment tools.
- Like most countries, Canada uses an internationally standardized definition established by the United Nations (UN) Food and Agricultural Organization (FAO) to track forest area through time.
- While forest area in Canada is relatively stable, the tree cover within is more dynamic due to forest fires, insect infestations, harvest activities and re-growth of forest cover.
- Canada’s National Forest Inventory continues to improve and refine estimates for critical sustainable forest management indicators, including forest area.
There are also other types of treed lands across Canada that do not fully meet the UN’s definition of forest but can contribute to habitat for wildlife, the sequestration and storage of carbon, as well as many other values across the landscapes in which they are found. These include:
- “other wooded lands,” which are areas with trees where the tree canopy cover is between 5 and 10%, usually accompanied by other vegetation types, like shrubs or bushes; there are 36 million ha of other wooded lands in Canada
- “other land with tree cover,” which are distinguished from “forest areas” as being in predominantly urban and agricultural areas, such as orchards; there are 7 million ha of other land with tree cover in Canada
Why is this indicator important?
- Forest area losses are a concern and closely monitored because forests provide habitat for biodiversity and many important ecosystem goods and services.
- Forest area is a broadly used and regularly measured indicator. In conjunction with forest area, many other indicators are used to gauge the effectiveness of sustainable forest management.
Canada’s estimated forest area, 1990–2022
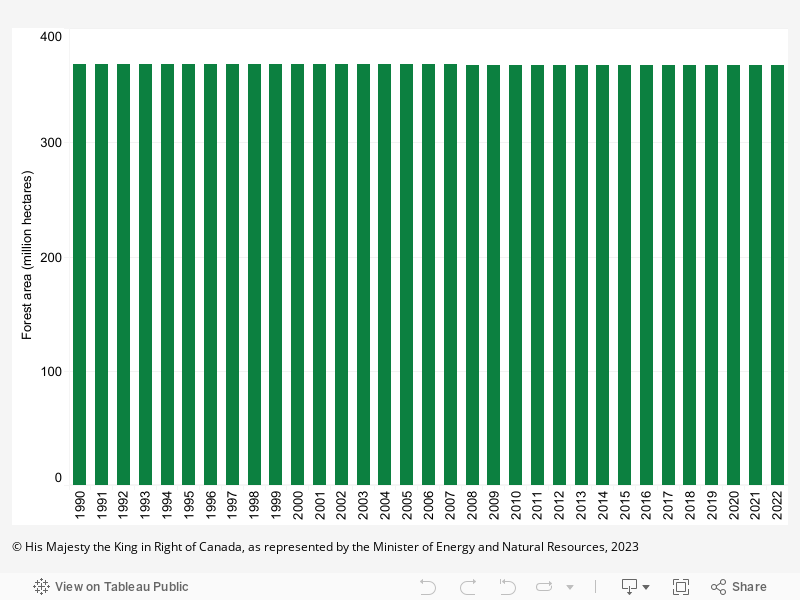
Graph summary
Canada’s estimated forest area trends between 1990 and 2022.
Graph data
Canada’s estimated forest area, 1990–2022
| Year | Forest area (million hectares) |
|---|---|
| 1990 | 368,883 |
| 1991 | 368,829 |
| 1992 | 368,774 |
| 1993 | 368,724 |
| 1994 | 368,647 |
| 1995 | 368,607 |
| 1996 | 368,572 |
| 1997 | 368,535 |
| 1998 | 368,498 |
| 1999 | 368,456 |
| 2000 | 368,411 |
| 2001 | 368,372 |
| 2002 | 368,333 |
| 2003 | 368,281 |
| 2004 | 368,232 |
| 2005 | 368,184 |
| 2006 | 368,140 |
| 2007 | 368,064 |
| 2008 | 368,017 |
| 2009 | 367,971 |
| 2010 | 367,929 |
| 2011 | 367,889 |
| 2012 | 367,847 |
| 2013 | 367,804 |
| 2014 | 367,751 |
| 2015 | 367,694 |
| 2016 | 367,638 |
| 2017 | 367,582 |
| 2018 | 367,530 |
| 2019 | 367,480 |
| 2020 | 367,429 |
| 2021 | 367,379 |
| 2022 | 367,330 |
Deforestation and afforestation
Key Information
The National Deforestation Monitoring System (NDMS) tracks changes from forest land to other land uses across Canada. Deforestation does not include forest harvesting when forest is being regrown on the site.
The NDMS can show trends by time, region and industry sector type.
Canada’s annual deforestation rate has slightly decreased over the last three decades. In 2021, 51,000 ha of forest were converted to non-forest land uses, as compared to 64,000 ha in 1990.
- Canada has 9% of the world’s forest but is responsible for only 0.37% of global deforestation that has occurred since 1990.
- The main drivers of deforestation in Canada continue to be agricultural, mining, as well as oil and gas expansion.
- The development of hydroelectric reservoirs causes spikes in annual deforestation due to forest flooding, as seen in 1993 and 2006.
- Deforestation in the forestry category (see figure below) arises from new permanent forestry roads and other persistent clearings such as sizable landings.
- The low annual area of recorded afforestation is much smaller than the annual area of deforestation, which in turn is much smaller than the total area of Canada’s forests.
Why is this indicator important?
Forest loss affects biodiversity, soil, air and water quality, as well as the availability of wildlife habitat. Forests also store more carbon than other terrestrial ecosystems and can be managed to mitigate climate change by, for example, increasing forest area through afforestation or by avoiding deforestation.
Estimated area of annual deforestation in Canada, by industrial sector, 1990–2021
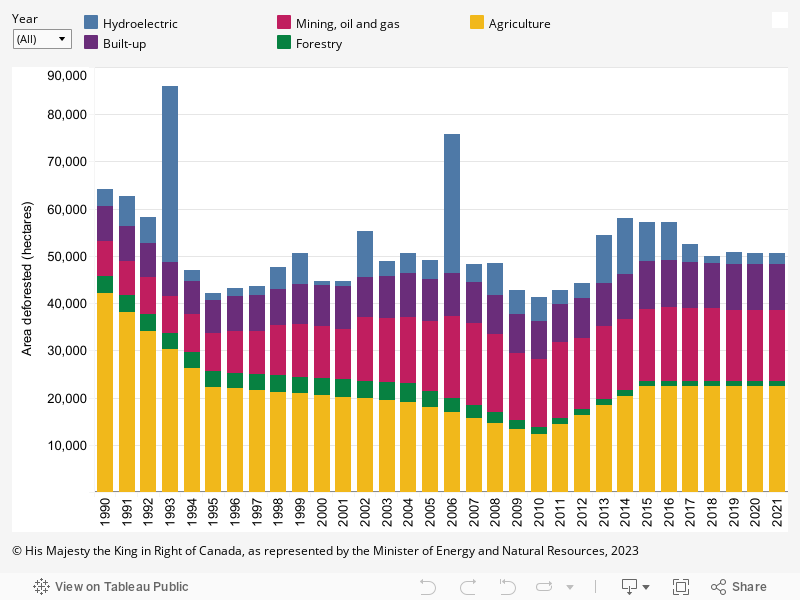
Graph summary
Comparison of the annual estimated area of deforestation in Canada between 1990 and 2021 by industrial sectors of: 1. Agriculture, 2. Forestry, 3. Mining, oil and gas, 4. Built-up and 5. Hydroelectric.
Graph data
Estimated area of annual deforestation in Canada, by industrial sector, 1990–2021
| Area deforested (hectares) | |||||
|---|---|---|---|---|---|
| Year | Agriculture | Forestry | Mining, oil and gas | Built-up | Hydroelectric |
| 1990 | 42,107 | 3,682 | 7,282 | 7,472 | 3,598 |
| 1991 | 38,142 | 3,600 | 7,254 | 7,298 | 6,402 |
| 1992 | 34,177 | 3,517 | 7,855 | 7,199 | 5,400 |
| 1993 | 30,217 | 3,435 | 7,952 | 7,126 | 37,323 |
| 1994 | 26,252 | 3,352 | 8,054 | 7,057 | 2,374 |
| 1995 | 22,289 | 3,270 | 8,163 | 7,028 | 1,493 |
| 1996 | 21,941 | 3,334 | 8,806 | 7,518 | 1,695 |
| 1997 | 21,597 | 3,398 | 9,146 | 7,513 | 2,014 |
| 1998 | 21,249 | 3,463 | 10,584 | 7,743 | 4,597 |
| 1999 | 20,893 | 3,527 | 11,175 | 8,354 | 6,646 |
| 2000 | 20,544 | 3,591 | 10,961 | 8,804 | 883 |
| 2001 | 20,196 | 3,655 | 10,740 | 9,104 | 882 |
| 2002 | 19,849 | 3,720 | 13,390 | 8,639 | 9,746 |
| 2003 | 19,502 | 3,784 | 13,577 | 8,951 | 3,061 |
| 2004 | 19,154 | 3,848 | 14,060 | 9,396 | 4,073 |
| 2005 | 17,982 | 3,452 | 14,758 | 8,946 | 4,035 |
| 2006 | 16,842 | 3,058 | 17,394 | 9,022 | 29,479 |
| 2007 | 15,703 | 2,666 | 17,482 | 8,657 | 3,719 |
| 2008 | 14,563 | 2,272 | 16,528 | 8,271 | 6,810 |
| 2009 | 13,422 | 1,879 | 14,037 | 8,313 | 5,072 |
| 2010 | 12,283 | 1,485 | 14,397 | 8,029 | 5,112 |
| 2011 | 14,303 | 1,407 | 15,953 | 8,229 | 2,920 |
| 2012 | 16,320 | 1,328 | 14,919 | 8,446 | 3,343 |
| 2013 | 18,341 | 1,250 | 15,546 | 9,137 | 10,123 |
| 2014 | 20,360 | 1,171 | 15,033 | 9,550 | 11,946 |
| 2015 | 22,378 | 1,092 | 15,345 | 10,108 | 8,225 |
| 2016 | 22,378 | 1,092 | 15,655 | 10,073 | 8,037 |
| 2017 | 22,378 | 1,092 | 15,483 | 9,845 | 3,747 |
| 2018 | 22,378 | 1,092 | 15,439 | 9,682 | 1,411 |
| 2019 | 22,378 | 1,092 | 15,159 | 9,662 | 2,534 |
| 2020 | 22,378 | 1,092 | 15,147 | 9,637 | 2,340 |
| 2021 | 22,378 | 1,092 | 15,147 | 9,629 | 2,273 |
Wood volume
Key Information
There are an estimated 50.2 billion cubic metres of wood volume in Canada. Wood volume is one of the most frequently studied, measured and reported forest indicators because of its importance in assessing available wood supply for the forest sector, managing carbon stocks in forests and determining the productivity of Canada’s forest resources.
Regular improvements to inventory methods and tools as well as updated data sources give us a better understanding of wood volume in Canada, and how it is changing through time.
- Just over half of the wood volume in Canada is in areas managed for forestry. A portion of this is available for wood supply, and other portions are set aside to achieve management objectives such as protection of water resources and wildlife habitat features.
- Around 11% of wood volume nationally is in legally protected areas with an additional 4% in areas restricted for other reasons including ecological reserves and traditional land uses.
- While not entirely free of human activity, over 20% of wood volume in Canada is in areas that have no formal forest management plan or designation.
Why is this indicator important?
- Wood volume is used along with other information to determine forest productivity, calculate biomass and estimate carbon storage in Canada’s forests.
- It is important to monitor general trends in wood volume in all forests for predicting fire behaviour and monitoring carbon storage.
Estimated wood volume (million cubic metres) in Canada
| Year | 1990 | 1995 | 2000 | 2005 | 2010 | 2015 | 2016 | 2017 | 2018 | 2019 | 2020 | 2021 |
|---|---|---|---|---|---|---|---|---|---|---|---|---|
| Wood volume | 54,555 | 54,524 | 54,050 | 52,292 | 51,648 | 51,167 | 51,095 | 50,885 | 50,591 | 50,494 | 50,558 | 50,199 |
Note: data are not consistent among different reporting years due to improvements in methodology. More information is included in the Sources and information section of this indicator.
Sources and information
See Sources and information in the downloadable report for detailed sources.
Page details
- Date modified: