
Spending and human resources

Planned spending
Departmental spending trend graph
Text version
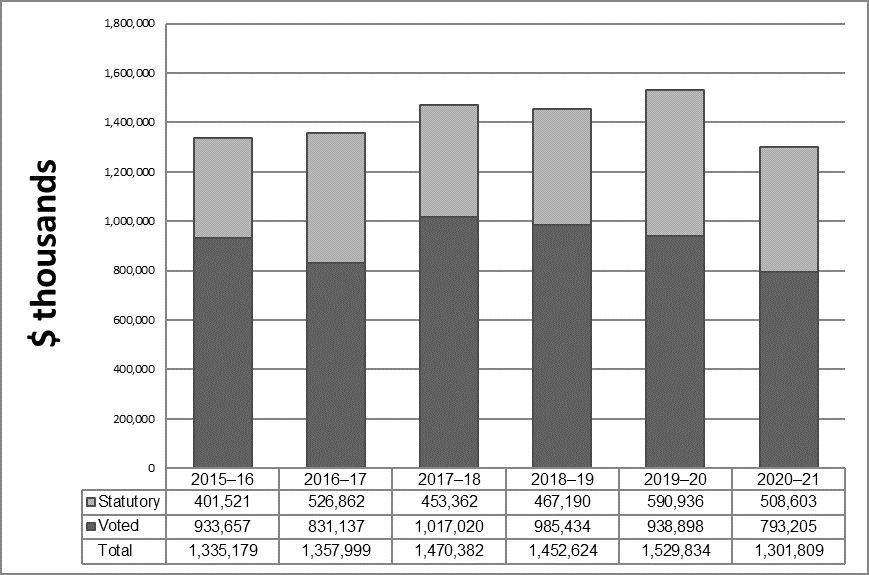
Departmental Spending Trend in thousands of dollars. Departmental spending broken down by statutory and voted amounts, is presented in a bar graph for fiscal years 2015–2016, 2016–2017, 2017–2018, 2018–2019, 2019–2020 and 2020-21. The amounts are as follows:
2015–2016
- Statutory: 401,521
- Voted: 933,657
- Total: 1,335,179
2016–2017
- Statutory: 526,862
- Voted: 831,137
- Total: 1,357,999
2017–2018
- Statutory: 453,362
- Voted: 1,017,020
- Total : 1,470,382
2018–2019
- Statutory: 467,190
- Voted: 985,434
- Total: 1,452,624
2019–2020
- Statutory: 590,936
- Voted: 938,898
- Total: 1,529,834
2020–2021
- Statutory: 508,603
- Voted: 793,205
- Total: 1,301,809
| Core Responsibilities and Internal Services | 2015–16 Expenditures |
2016–17 Expenditures |
2017–18 Forecast spending |
2018–19 Main Estimates |
2018–19 Planned spending |
2019–20 Planned spending |
2020–21 Planned spending |
|---|---|---|---|---|---|---|---|
| Natural Resources Science and Risk Mitigation | $204,218,435 | $205,782,987 | $198,683,355 | $181,158,584 | $181,158,584 | $173,913,358 | $156,496,673 |
| Innovative Solutions and Sustainable Natural Resource Development | $506,764,842 | $396,734,230 | $542,966,381 | $564,281,850 | $564,281,850 | $542,886,900 | $497,257,660 |
| Globally Competitive Natural Resource Sectors | $498,630,538 | $629,574,353 | $575,763,391 | $569,046,044 | $569,046,044 | $687,164,440 | $524,385,298 |
| Subtotal | $1,209,613,815 | $1,232,091,570 | $1,317,413,127 | $1,314,486,478 | $1,314,486,478 | $1,403,964,698 | $1,178,139,631 |
| Internal Services | $125,564,854 | $125,907,344 | $152,968,818 | $138,137,439 | $138,137,439 | $125,869,690 | $123,668,933 |
| Total | $1,335,178,669 | $1,357,998,914 | $1,470,381,945 | $1,452,623,917 | $1,452,623,917 | $1,529,834,388 | $1,301,808,564 |
For 2015-16 and 2016-17, the figures represent the actual expenditures as reported in the Public Accounts of Canada, while 2017-18 represents the forecasted expenditures to year end. For 2018-19 to 2020-21, the figures represent total planned spending, reflecting funding to support NRCan program activities.
From 2015-16 to 2016-17, NRCan expenditures increased slightly, mainly due to an increase in Statutory Atlantic Offshore payments and the implementation of the Federal Infrastructure Initiative, offset by the transfer of responsibility over the Nuclear Legacy Liabilities Program and the Port Hope Area Initiative to Atomic Energy of Canada Limited and reduced spending pertaining to the ecoENERGY for Biofuels, Windpower Production Incentive and Energy Innovation programs.
From 2016-17 to 2017-18, NRCan is forecasting an increase in spending mainly as a result of newly signed collective agreements and the increased spending profile of the Green Infrastructure envelope, the Energy Innovation program, Oil and Gas Clean Technology, and the Green Municipal Fund, offset by reductions in Statutory Atlantic Offshore payments.
The decrease between 2017-18 Forecasted spending and 2018-19 Planned spending is mainly due to the reduced funding profile of the Federal Infrastructure Initiative, the ecoENERGY for Renewable Power program and the Softwood Lumber Action Plan, the sunsetting of the Green Municipal Fund and the Oil and Gas Clean Technology program, offset by an increase in the funding profile of the Green Infrastructure envelope, Advancing Clean Technology, and the Impact Canada initiative.
Planned spending in Voted authorities from 2018-19 to 2020-21 is declining, mainly as a result of reduced funding profiles for major initiatives and sunsetting programs. Sunsetting programs could be renewed but are subject to government’s decisions to extend, reduce or enhance funding and outcomes of such decisions will be reflected in the department’s future budget exercises and Estimates documents. The following major initiatives will be sunsetting over the next two years:
Sunsetting on March 31, 2019 and potentially up for renewal:
- Enhancing Indigenous Participation in West Coast Energy Development;
- Enhancing National Earthquake Monitoring;
- Environmental Assessment Review Interim Strategy;
- Green Jobs;
- Federal Infrastructure Initiative;
- Genomics Research & Development Initiative; and
- World Class Tanker Safety System.
Sunsetting on March 31, 2020 and potentially up for renewal:
- Geo-mapping for Energy and Minerals;
- Major Projects Management Office;
- Marine Conservation Targets;
- Targeted Geoscience Initiative;
- Forest Innovation and Expanding Market Opportunities;
- Investments in Forest Industry Transformation Program; and
- Indigenous Forestry Initiative.
Planned spending in Statutory authorities is fluctuating from 2018-19 to 2020-21, mainly as a result of the Atlantic Offshore Accounts. Statutory payment obligations under these accords are largely driven by oil and gas prices, production levels and anticipated corporate income taxes related to offshore operations. The planned spending is based on the department's economic modeling forecasts prepared in the Fall of 2017.
Planned human resources
| Core Responsibilities and Internal Services | 2015–16 Actual |
2016–17 Actual |
2017–18 Forecast |
2018–19 Planned |
2019–20 Planned |
2020–21 Planned |
| Natural Resources Science and Risk Mitigation | 1,229 | 1,208 | 1,220 | 1,195 | 1,177 | 1,146 |
| Innovative Solutions and Sustainable Natural Resource Development |
1,439 | 1,447 | 1,476 | 1,461 | 1,453 | 1,456 |
| Globally Competitive Natural Resource Sectors | 328 | 335 | 351 | 343 | 324 | 255 |
| Subtotal | 2,996 | 2,990 | 3,047 | 2,999 | 2,954 | 2,857 |
| Internal Services | 940 | 906 | 941 | 933 | 938 | 937 |
| Total | 3,936 | 3,896 | 3,988 | 3,932 | 3,892 | 3,794 |
For 2015-16 and 2016-17, the figures represent the FTEs as reported in the Departmental Results Report while 2017-18 represents the forecasted FTEs to year end. For 2018-19 to 2020-21, the figures represent total Planned FTEs to support NRCan program activities, approved by Treasury Board, to support the department’s activities. NRCan’s total FTE count remains relatively steady from 2015-16 to 2016-17.
The decrease between 2017-18 Forecasted FTEs and 2020-21 Planned FTEs is mainly attributed to the sunsetting of major initiatives, which were explained in the Budgetary Planning Summary Section.
Furthermore, as new initiatives are undertaken, plans for future FTE requirements will be adjusted accordingly.
Estimates by vote
For information on NRCan’s organizational appropriations, consult the 2018–19 Main Estimates.
Future-Oriented Condensed Statement of Operations
The Future-Oriented Condensed Statement of Operations provides a general overview of NRCan’s operations. The forecast of financial information on expenses and revenues is prepared on an accrual accounting basis to strengthen accountability and to improve transparency and financial management.
Because the Future-Oriented Condensed Statement of Operations is prepared on an accrual accounting basis, and the forecast and planned spending amounts presented in other sections of the Departmental Plan are prepared on an expenditure basis, amounts may differ.
A more detailed Future-Oriented Statement of Operations and associated notes, including a reconciliation of the net cost of operations to the requested authorities, are available on NRCan’s website.
| Financial information | 2017–18 Forecast results |
2018–19 Planned results |
Difference (2018–19 Planned results minus 2017–18 Forecast results) |
|---|---|---|---|
| Total expenses | 1,513,404,969 | 1,543,004,776 | 29,599,807 |
| Total revenues | 30,596,524 | 37,317,799 | 6,721,275 |
| Net cost of operations before government funding and transfers |
1,482,808,445 | 1,505,686,977 | 22,878,532 |
The increase of $29.6 million in expenses between years is mainly explained by a $33.5 million increase in Innovative and Sustainable Natural Resources Development mainly related to:
An increase of $168 million in funding profiles:
- $82 million for the Green Infrastructure envelope;
- $50 million for Clean Growth in Natural Resource Sectors;
- $27 million for Impact Canada Initiative – Clean Technology Challenges; and
- $9 million for the Clean-up of the Gunnar uranium mining facilities.
Offset by:
A decrease of $107 million resulting from the sunsetting of the following programs:
- $63 million for Green Municipal Fund;
- $44 million for the development of cleaner oil and gas technologies.
And a decrease of $29 million in the funding profiles:
- $16 million for the Federal Infrastructure Initiative; and
- $13 million for the ecoENERGY for Renewable Power program.
The charts presenting the distribution by program of Natural Resources Canada’s total forecast expenses for 2017-18 and planned expenses for 2018-19 on an accrual basis are available on the NRCan’s website.
Page details
- Date modified: