
Section I: Organizational Expenditure Overview 2014-15
Organizational Profile
Appropriate Minister: The Honourable Gordon James Carr, P.C., M.P.
Institutional Head: Bob Hamilton
Ministerial Portfolio:
- Atomic Energy of Canada LimitedFootnote [i] (AECL);
- National Energy BoardFootnote [ii] (NEB);
- Canadian Nuclear Safety CommissionFootnote [iii] (CNSC);
- Canada-Newfoundland and Labrador Offshore Petroleum BoardFootnote [iv] (CNLOPB);
- Canada-Nova Scotia Offshore Petroleum BoardFootnote [v] (CNSOPB);
- Northern Pipeline AgencyFootnote [vi] (NPA);
- Sustainable Development Technology CanadaFootnote [vii] (SDTC); and
- Energy Supplies Allocation Board (ESAB) (inactive).
Year established: 1994
Main legislative authorities:
- Department of Natural Resources ActFootnote [viii], S.C. 1994, c. 41
- Forestry ActFootnote [ix], R.S.C., 1985, c. F-30
- Resources and Technical Surveys ActFootnote [x], R.S.C., 1985, c. R-7
Organizational Context
Raison d’être
Natural Resources Canada (NRCan) works to improve the quality of life of Canadians by ensuring that our resource sector remains a source of jobs, prosperity, and opportunity within the context of a world that increasingly values sustainable practices and low carbon processes.
Responsibilities
The Minister of Natural Resources has responsibilities under more than 30 acts of Parliament. The Minister’s core powers, duties and functions are set forth in the Department of Natural Resources Act, the Resources and Technical Surveys Act and the Forestry Act. NRCan also works in areas of shared responsibilities with provinces.
To deliver on its responsibilities, NRCan relies on a number of instruments: policy, programs, regulations, and science and technology. It uses partnerships and international collaboration to help drive progress on natural resource issues that are important to Canadians. More broadly, the Department plays a critical role in Canada’s future, contributing to high-paying jobs, business investment and overall economic growth in Canada’s natural resource sectors.
NRCan has offices and laboratories across the country. About half of its occupied facilities are in the National Capital Region, with the remainder being distributed from Atlantic Canada, through Quebec and Ontario, to the Western and Pacific Regions and Northern Canada.
Strategic Outcomes and Program Alignment Architecture
- Strategic Outcome 1: Canada’s Natural Resource Sectors are Globally Competitive
- Program 1.1: Market Access and Diversification
- Sub-Program 1.1.1: Mineral and Metal Markets Access and Development
- Sub-Program 1.1.2: Forest Products Market Access and Development
- Sub-Program 1.1.3: Energy Market Regulation and Information
- Program 1.2: Innovation for New Products and Processes
- Sub-Program 1.2.1: Mining Innovation
- Sub-Program 1.2.2: Forest Sector Innovation
- Sub-Program 1.2.3: Geomatics Innovation
- Program 1.3: Investment in Natural Resource Sectors
- Sub-Program 1.3.1: Mineral Investment
- Sub-Program 1.3.2: Targeted Geoscience Initiative
- Sub-Program 1.3.3: Geo-mapping for Energy and Minerals
- Sub-Program 1.3.4: New Energy Supply
- Sub-Program 1.3.5: Major Projects Management Office Initiative
- Program 1.4: Statutory Programs – Atlantic Offshore
- Program 1.1: Market Access and Diversification
- Strategic Outcome 2: Natural Resource Sectors and Consumers are Environmentally Responsible
- Program 2.1: Energy-Efficient Practices and Lower-Carbon Energy Sources
- Sub-Program 2.1.1: Renewable Energy Deployment
- Sub-Program 2.1.2: Support for Clean Energy Decision-Making
- Sub-Program 2.1.3: Alternative Transportation Fuels
- Sub-Program 2.1.4: Energy Efficiency
- Program 2.2: Technology Innovation
- Sub-Program 2.2.1: Materials for Energy
- Sub-Program 2.2.2: Green Mining
- Sub-Program 2.2.3: Clean Energy Science and Technology
- Program 2.3: Responsible Natural Resource Management
- Sub-Program 2.3.1: Forest Ecosystem Science and Application
- Sub-Program 2.3.2: Groundwater Geoscience
- Sub-Program 2.3.3: Environmental Studies and Assessments
- Sub-Program 2.3.4: Radioactive Waste Management
- Sub-Program 2.3.5: Earth Observations for Responsible Resource Development
- Program 2.1: Energy-Efficient Practices and Lower-Carbon Energy Sources
- Strategic Outcome 3: Canadians have Information to Manage their Lands and Natural Resources, and are Protected from Related Risks
- Program 3.1: Protection for Canadians and Natural Resources
- Sub-Program 3.1.1: Explosives Safety and Security
- Sub-Program 3.1.2: Materials and Certification for Safety and Security
- Sub-Program 3.1.3: Forest Disturbances Science and Application
- Sub-Program 3.1.4: Climate Change Adaptation
- Sub-Program 3.1.5: Geohazards and Public Safety
- Program 3.2: Landmass Information
- Sub-Program 3.2.1: Essential Geographic Information
- Sub-Program 3.2.2: Canada’s Legal Boundaries
- Sub-Program 3.2.3: Polar Continental Shelf Logistics Support
- Sub-Program 3.2.4: United Nations Convention on the Law of the Sea
- Program 4.1: Internal Services
- Program 3.1: Protection for Canadians and Natural Resources
Organizational Priorities
In 2014-15, NRCan supported key Government of Canada (GC) priorities. The Department played a lead role in:
- Expanding markets and global partnerships;
- Unlocking resource potential through responsible development;
- Leveraging S&T knowledge for safety and security risk management;
- Innovating for competitiveness and environmental performance; and
- Increasing the effectiveness and efficiency of NRCan operations.
Information on how each of these priorities is being delivered is found below under the Summary of Progress.
| Priority | Type1 | Strategic Outcomes |
| Expand markets and global partnerships | Previously Committed to | SO 1 - Canada’s Natural Resource Sectors are Globally Competitive SO 2 - Natural Resource Sectors and Consumers are Environmentally Responsible |
| Summary of Progress | ||
|
NRCan worked to expand existing markets, open new markets, address market access barriers, attract investment into Canada and promote Canadian investment abroad, by engaging with key foreign governments, both bilaterally and multilaterally. This included signing a new bilateral Memorandum of Understanding (MOU) with the United States (US) Department of Energy and a trilateral data MOU with the US and Mexico. Canada also engaged with China, Ukraine, Poland, the United Kingdom (UK), Lithuania and Italy on the potential for future Liquefied Natural Gas (LNG) exports. With the US, Canada helped the Ukraine formulate a plan to deal with natural gas supply shortages during the winter of 2014-15. Internationally, the Canada-European Union (EU) High Level Energy Dialogue was relaunched after the Canada-EU summit of September 2014, when leaders committed to renewed collaboration in the field of energy. The Dialogue allows Canada to cooperate with the EU on key energy areas such as oil and gas markets, science and technology (S&T), research and development (R&D), renewables, and in international fora. NRCan’s recent outreach and engagement on EU’s proposed regulations for the Fuel Quality Directive successfully brought about final regulations in February 2015, which should not impact future oil exports to the EU. The Department provided technical expertise on Canada's natural resource sectors to Foreign Affairs, Trade and Development Canada (DFATD) to support international trade negotiations, including on the recently concluded Canada-Korea Free Trade Agreement and on other international trade negotiations still under way such as the Canada-Japan Economic Partnership Agreement and the Trans-Pacific Partnership. NRCan also provided expertise to DFATD and Environment Canada (EC) in support of three international climate change negotiation sessions. NRCan continued to advance Canada’s international climate change objectives in a range of high-level climate change- and clean energy-related fora. NRCan promoted its energy efficiency and clean energy supply initiatives at the fifth Clean Energy Ministerial in May 2014. The Department became Canada’s Focal Point on the Climate Technology Centre and Network (CTCN) of the United Nations Framework Convention on Climate Change (UNFCCC), and will facilitate the deployment of climate-friendly technologies in developing countries, as well as the Clean Technology Initiative (CTI) Private Financing Advisory Network (PFAN). The Clean Energy Dialogue successfully released the Third Report to Leaders in October 2014, outlining joint Canada-US achievements in working groups focused on Carbon Capture and Storage and Integrating Renewable Power into the Grid, as well as Clean Energy R&D and Energy Efficiency. In 2014-15, NRCan established the Major Projects Management Office – West (MPMO-West). It provides a single window for First Nations to engage with the GC on issues related to the development of West Coast energy infrastructure. In response to Special Federal Representative Douglas Eyford’s recommendations, the MPMO-West team is engaging early and often with First Nations, to build a trusting relationship, to identify and address issues related to west coast energy infrastructure, and to facilitate increased Aboriginal participation in energy projects. NRCan coordinated many federal-provincial-territorial meetings, including the Energy and Mines Ministers’ Conference 2014, which included discussion of collaboration on energy efficiency, regulatory reform, the junior mining sector and mandatory reporting in the extractive sectors. The Department continued to work collaboratively with wood product associations, provincial governments and the forest industry on a range of market development activities, both in foreign and North American markets. Exports of Canadian forest products increased 10.2% (dollar value) in 2014-15, in part due to these activities. Under the Expanding Market Opportunities program, NRCan provided support to the forest industry including $6.7 million in support of foreign market development initiatives and $2.8 million to increase the use of wood in non-residential and mid-rise applications in Canada and the US. Promoting Canadian best practices in responsible mineral resource development, NRCan led the Canadian delegation to the 10th annual general meeting of the Intergovernmental Forum on Mining, Minerals, Metals and Sustainable Development. At events in Brussels and Berlin, the delegation promoted Canadian mining policies and technologies, including the Green Mining Initiative. In 2014-15, NRCan established the Extractive Sector Transparency Measures Act (ESTMA) in response to the Prime Minister’s 2013 G8 commitment to deter corruption in the extractives sector through transparency measures. The Act requires the reporting of certain payments made to all levels of governments domestically and abroad. The ESTMA received Royal Assent on December 16, 2014, and came into force on June 1, 2015. NRCan contributed to the 2014-15 review and renewal of the GC’s Corporate Social Responsibility (CSR) Strategy. Through cooperation with the Prospectors and Developers Association of Canada (PDAC), the Mining Association of Canada (MAC), rePlan, Plan Canada and UNICEF, the Department developed a CSR checklist for mining companies working abroad. |
||
1Type is defined as follows: previously committed to – committed to in the first or second fiscal year prior to the subject year of the report; ongoing – committed to at least three fiscal years prior to the subject year of the report; and new – newly committed to in the reporting year of the RPP or DPR. If another type that is specific to the department is introduced, an explanation of its meaning must be provided.
| Priority | Type | Strategic Outcomes |
| Unlock resource potential through responsible development | Previously Committed to | SO 1 - Canada’s Natural Resource Sectors are Globally Competitive SO 2 - Natural Resource Sectors and Consumers are Environmentally Responsible SO 3 - Canadians have Information to Manage their Lands and Natural Resources, and are Protected from Related Risks |
| Summary of Progress | ||
|
NRCan provided federal leadership by working with other federal departments and regulatory agencies to implement the Government’s plan for Responsible Resource Development and help protect Canadians. It also disseminated scientific knowledge necessary to understand and identify areas that hold the most resource development potential. To help bring Canada’s LNG resources to market, the Department supported the Governor in Council’s decision-making to authorize the National Energy Board (NEB) to issue two export licenses. NRCan continued to monitor the Lower Churchill hydroelectric projects, including reviewing funding request documentation and independent engineering reports and participating in site visits. The Department is updating the federal regulatory framework governing energy resources, including:
With a view to attracting and increasing investment in Canada’s natural resource sector, NRCan:
The Aboriginal Forestry Initiative delivered $2.7 million in funding in 2014-2015, supporting early engagement activities with industry, enhanced community readiness and capacity, and facilitating business development opportunities in Aboriginal communities across Canada. NRCan continued to synthesize its science-based research to support the forest sector, including projects such as the long-term ecological forest research (35-year study) at Turkey Lakes, Ontario, and 15 years of research results from the Ecosystem Management Emulating Natural Disturbance project which explores the effectiveness of ecosystem-based management in the western boreal forest. NRCan provided estimates of forest-related carbon and greenhouse gas (GHG) emissions to EC’s National Inventory (of GHG emissions); this information will be used in the 2015 National Inventory Report. NRCan also delivered geoscience support to federal (Transport Canada [TC], Canadian High Arctic Research Station) and territorial governments (Northwest Territories [NWT] Environment and Natural Resources, NWT Department of Transport, Nunavut Department of Economic Development and Transportation, Gwich’in Renewable Resource Board) to increase their understanding of changes to the climate, and how they impact Northern infrastructure that would be required in bringing resources to market. |
||
| Priority | Type | Strategic Outcomes |
| Innovate for competitiveness and environmental performance | Previously Committed to | SO 1 — Canada’s Natural Resource Sectors are Globally Competitive SO 2 — Natural Resource Sectors and Consumers are Environmentally Responsible |
| Summary of Progress | ||
|
NRCan continued its work to enhance energy efficiency in the residential, commercial and institutional, industrial and transportation sectors, pursue S&T projects on unconventional oil and gas, promote the development and use of innovative energy technology, support the production and use of alternative transportation fuels, and advance innovation in green mining. The implementation of the Government-owned, Contractor-operated (GoCo) model for AECL’s Nuclear laboratory is on track. A key milestone was achieved in November 2014, with the operationalization of Canadian Nuclear Laboratories (CNL). NRCan supported the forest sector’s efforts to develop opportunities in bioenergy, bio-products and next generation of building materials, including the deployment of new cross-laminated timber manufacturing technology at facilities in Western Quebec and British Columbia; state-of-the-art precision forestry informatics through a national equipment manufacturer; commercial production of food-grade biomethanol from a pulp and paper mill; construction of a facility to prefabricate a panelized system for the Passive House Standard (a rigorous, internationally recognized design and building standard), and industrial-scale glue applications for lignin extracted from the pulping process. Under the ecoENERGY Efficiency program, NRCan continued to support training initiatives for individuals in the housing, buildings, industrial and transportation sectors, and the development of codes and regulations. This program contributes to Canada's long-term goals to reduce greenhouse gas emission while saving Canadian consumers and businesses money, and helping Canadian industry to become more competitive. In 2014-15, key activities included the ENERGY STAR® benchmarking tool for buildings, the SmartWay Transport Partnership (a benchmarking program for the freight transportation industry), and the expansion of the ENERGY STAR® product labelling program. NRCan's Program of Energy Research and Development, ecoENERGY Innovation Initiative and Clean Energy Fund programs continued to support leading-edge clean energy research, development and demonstration (RD&D) projects. In its first full year of operation, the NRCan-led Federal Geospatial Platform (FGP) developed a functional test version of an integrated suite of internal and external online tools and technologies. Through this whole-of-government, enterprise-wide approach to geospatial tools and information sharing, the federal government has started to integrate and share more than 141 geospatial data layers, significantly exceeding its original first-year target of 50. The addition of this new data to Canada’s Open Data Portal will facilitate smarter and faster decision making by a multitude of users on a wide range of issues, from environmental and safety, to economic and social issues. NRCan undertook the Canadian Geomatics Environmental Scan and Value Study representing the most comprehensive assessment to date of the geomatics and geospatial sector in Canada. The study found that in 2013, the use of geospatial information contributed $20.7 billion in productivity improvements to the Canadian economy, or the equivalent of 1.1% of national GDP. With regard to improving the energy efficiency of vehicles, NRCan’s CanmetMATERIALS Lab completed work in successfully integrating spring-back prediction of high-strength steels. This enables Canadian companies, to avoid costly tooling changes and enhances time to market in hydro-formed tubular products used in crash applications in vehicle body structures. Several materials solutions for key components in the Canadian Generation-IV (GEN-IV) Supercritical Water-cooled Reactor concept were developed in 2014-15. This year, coatings to protect steels from corrosion in high-temperature supercritical water have been evaluated and finalized; and a ceramic insulating material has been developed and tested. Results were provided to the Canadian GEN-IV Review Committee in February 2015. |
||
| Priority | Type | Strategic Outcomes |
| Leverage S&T knowledge for safety and security risk management | Previously Committed to | SO 2 - Natural Resource Sectors and Consumers are Environmentally Responsible SO 3 - Canadians have Information to Manage their Lands and Natural Resources, and are Protected from Related Risks |
| Summary of Progress | ||
|
Through collaboration with federal, provincial and territorial partners, academia, industry stakeholders and key international organizations, NRCan continued to drive innovation of the Canadian Geospatial Data Infrastructure, ensuring that high-value, open, standards-based geodata, such as topographic and geoscience maps, are available to Canadians. The Department also delivered reusable Open Data applications (e.g., Canadian digital elevation data and GeoGratis) and tools, leading to cost-effectiveness in technology use, and continued to prepare for and manage risks and emergencies as they relate to its mandate. NRCan continued to disseminate geospatial products and services in support of land and natural resource management, publishing 37 Canadian geoscience maps along with their associated data, and releasing 775 science and technology publications. The Department also produced a new reference map of Canada including updates to the transportation network, populated placed symbols, place names and the position of the North Magnetic Pole. New features include winter roads, two new national parks and an updated summer sea ice extent based on EC’s standard measurement approach. NRCan’s research on an early intervention against the spruce budworm in Eastern Canada produced promising results, including a better understanding of how a spruce budworm outbreak begins and spreads. In October 2014, the Department co-hosted the Third Biennial Wildland Fire Canada Conference with Maritime provincial agencies. The event was a key opportunity to re-engage and strengthen working relationships with Canadian fire management agencies, and transfer knowledge on NRCan fire research and information systems technology to fire management end-users. Commissioning of the Water Treatment Plants for the Port Hope and Port Grandby remained on track. In September 2014, Public Works and Government Services Canada (PWGSC) put out to tender the contract for the Port Granby Long Term Waste Management Facility. Under the Nuclear Legacy Liabilities Program (NLLP), NRCan continued its work with AECL and CNL on the transition of nuclear decommissioning and waste responsibilities to the GCo management model. NRCan regularly participated in the development and revision of GC Emergency Management Plans including the Interagency Volcanic Event Notification Protocol, Atlantic Canada Tsunami Protocol, Earthquake Contingency Plan, Earthquake Response protocol, Flood Plan, and Satellite Imagery Acquisition Plan. New security provisions under the Explosives Act came into force on February 1, 2015, which completed the final step in the implementation of the Explosives Regulations, 2013. The Adaptation Platform continued to develop effective climate change adaptation actions, notably by bringing more stakeholders on board. Public Safety Canada and the Federation of Canadian Municipalities joined the plenary body, with total Platform membership rising to 370 members. NRCan met its Northern survey obligations and completed its annual plan for the multi-year First Nations Land Management program. As part of its First Nation Land Management work, NRCan prepared 37 land descriptions, 101 research reports, and annual work plans for Treaty Land Entitlement in Saskatchewan and Manitoba. |
||
| Priority | Type | Strategic Outcomes |
| Increase the effectiveness and efficiency in NRCan operations | Previously Committed to | P 4.1 – Internal Services |
| Summary of Progress | ||
|
NRCan focused on transforming the way it delivers internal services such as human resources, information management, and capital investments, to increase the efficiency and effectiveness of its operations. The Department has implemented government-wide transformation initiatives:
NRCan has also made improvements to its operations:
|
||
Risk Analysis
NRCan recognizes that a solid understanding of its risk environment is fundamental to achieving its strategic outcomes and maintaining operational efficiency and effectiveness. Within its mandate and the levers at its disposition, NRCan endeavours to respond to uncertainties, including opportunities, in the global and domestic contexts and their potential impact on Canada’s natural resource sectors.
Key Risks
|
Market Access and Investment Climate Canada’s economy relies on the contributions of the natural resource sectors, both in contributing to the Gross Domestic Product (GDP) and in creating jobs. Despite variances in global commodity markets, Canada’s resource sectors will continue to play a significant part in Canada’s economic future. To continue to expand the natural resource sectors, Canada must maintain an investment climate attractive to resource development, and a sound regulatory system to support responsible resource development and gain Canadians’ support. |
||
| Risk | Actions taken | Link to PAA |
|
If Canada fails to respond to changing market dynamics such as shifting natural resources demand to new markets, or maintain an appropriate investment climate, natural resource sectors may lose opportunities. |
NRCan provided support to several regulatory and legislative initiatives to strengthen energy and mining regulations, pipeline safety, nuclear liability and offshore petroleum regimes. In February 2014, the Energy Safety and Security Act received Royal Assent and will enter into force in February 2016. The Offshore Health and Safety Act received Royal Assent in June 2014 and entered into force on December 31, 2014. The Pipeline Safety Act was introduced in December 2014 and received Royal Assent in June 2015. NRCan continues to work with Quebec on the 2011 Canada-Quebec Gulf of St. Lawrence Petroleum Resources Accord legislation to implement it as early as possible. As well, NRCan contributed to the review of the Metal Mining Effluent Regulations led by EC. To help bring Canada’s LNG resources to market, NRCan supported Governor in Council decision-making to authorize the NEB to issue two LNG export licences. In 2014, NRCan established the MPMO-West, providing a single window for First Nations communities to engage with the GC on issues related to West Coast energy infrastructure development. The MPMO-West team is engaging early, often and in collaboration with other federal departments, supporting a range of initiatives to respond to identified community needs building a trusting relationship and facilitating increased Aboriginal participation in energy projects. NRCan managed outreach and engagement on proposed regulations for the EU’s Fuel Quality Directive; these efforts successfully brought about final regulations in February 2015, which should not impact future oil exports to the EU. Internationally, NRCan supported projects and engaged with partners to promote Canada as a reliable and responsible resource developer, as well as to promote investment in Canada’s natural resource sectors; for example:
NRCan continued to conduct research to ensure the safety of our infrastructure and sustainability of our natural resource systems; for example:
|
1.1.2 – Forest Products Market Access and Development 1.1.3 – Energy Market Regulation and Information 1.3.1 – Mineral Investment 1.3.5 – Major Projects Management Office Initiative 2.1.2 – Support for Clean Energy Decision-making 2.2.1 – Materials for Energy 2.3.1 – Forest Ecosystems Science and Application |
|
Hazards and Emergency Management NRCan is mandated to support the management of natural resource-related emergencies, through prevention, preparedness and response, thereby helping to ensure the safety and security of Canadians. |
||
| Risk | Actions taken | Link to PAA |
|
If Canada does not have sufficient safeguards in place, in the event of a natural event or human-driven incident, this may negatively impact Canadians, the security of Canada’s natural resource infrastructure as well as Canada’s economy. |
NRCan and Maritime forest management agencies co-hosted the third biennial Wildland Fire Canada Conference in October 2014, helping to re-engage and strengthen working relationships among the Canadian fire management agencies and to transfer knowledge on NRCan fire research and information systems technology to fire management end-users. NRCan and the Privy Council Office led the development of geomatics in support of the federal Departmental Security Officer (DSO) Community with the support of Defence Research and Development Canada. The project included two components: (1) to document the requirements of the DSO community in the preservation of information and physical infrastructure; (2) to bring together the DSO community to extract detailed functional requirements for the FGP based on commonly accepted user-centred engineering methods. NRCan updated the Risk and Control Assessment Report for the NLLP to confirm that adequate controls were in place to mitigate potential impacts on health, safety and the environment from incidents that could occur during implementation of the NLLP. NRCan participated in the development and revision of GC Emergency Management Plans including the Interagency Volcanic Event Notification Protocol, Atlantic Canada Tsunami Protocol, Earthquake Contingency Plan, Earthquake Response Protocol, Flood Plan, and Satellite Imagery Acquisition Plan. In addition, NRCan collaborated on the development of, and participation in, a Full-Scale Exercise (FSX) Unified Response, to test the recently redrafted Federal Nuclear Emergency Plan with a field deployment of federal and provincial assets. Lessons learned from these exercises are being used to improve a variety of NRCan emergency management protocols. The Department also developed and disseminated knowledge about hazards to Government and industry clients through 24/7 monitoring and alerting, and emergency geomatics services. In 2014-15, NRCan implemented an $17 million ‘Enhanced Earthquake Monitoring’ initiative to refresh Canada’s earthquake monitoring and alerting capability. NRCan also continues its work in mapping and interpretation of floods and ice break-up during emergency situations. The Emergency Geomatics Service, which supports emergency response activities in Canada, also continues to produce and disseminate satellite-based information products to a large community of emergency responders. |
1.2.3 – Geospatial Innovation 2.3.4 – Radioactive Waste Management 2.3.5 – Earth Observation for Responsible Resource Development 3.1.2 – Materials and Certification for Safety and Security 3.1.3 – Forest Disturbances Science and Application 3.1.5 – Geohazards and Public Safety 3.2.1 – Essential Geographic Information 4.1 – Internal Services |
Actual Expenditures
| 2014-15 Main Estimates |
2014-15 Planned Spending |
2014-15 Total Authorities Available for Use |
2014-15 Actual Spending (authorities used) |
Difference (actual minus planned) |
|---|---|---|---|---|
| 2,534,650,611 | 2,534,650,611 | 2,282,358,631 | 2,049,418,787 | (485,231,824) |
| 2014-15 Planned |
2014-15 Actual |
2014-15 Difference (actual minus planned) |
|---|---|---|
| 3,902 | 3,913 | 11 |
| Strategic Outcome(s), Program(s) and Internal Services | 2014-15 Main Estimates |
2014-15 Planned Spending |
2015-16 Planned Spending |
2016-17 Planned Spending |
2014-15 Total Authorities Available for Use |
2014-15 Actual Spending (authorities used) |
2013-14 Actual Spending (authorities used) |
2012–13 Actual Spending (authorities used) |
|---|---|---|---|---|---|---|---|---|
| Strategic Outcome: 1. Canada’s Natural Resource Sectors are Globally Competitive | ||||||||
| Market Access and Diversification | 56,085,530 | 56,085,530 | 48,685,006 | 46,583,308 | 64,507,366 | 61,566,240 | 59,733,334 | 55,420,361 |
| Innovation for New Products and Processes | 67,598,586 | 67,598,586 | 83,438,001 | 95,060,475 | 71,742,031 | 71,707,214 | 94,093,063 | 93,948,144 |
| Investment in Natural Resource Sectors | 55,641,175 | 55,641,175 | 54,230,114 | 54,864,751 | 61,525,666 | 60,589,504 | 65,333,593 | 73,319,149 |
| Statutory Programs- Atlantic Offshore | 1,293,425,000 | 1,293,425,000 | 1,181,938,140 | 1,108,579,456 | 837,746,067 | 837,746,067 | 795,884,721 | 684,964,769 |
| Subtotal | 1,472,750,291 | 1,472,750,291 | 1,368,291,261 | 1,305,087,990 | 1,035,521,130 | 1,031,609,025 | 1,015,044,711 | 907,652,423 |
| Strategic Outcome: 2. Natural Resource Sectors and Consumers are Environmentally Responsible | ||||||||
| Energy-Efficient Practices and Lower-Carbon Energy Sources | 464,018,045 | 464,018,045 | 253,978,461 | 187,217,607 | 370,539,168 | 291,745,439 | 314,652,883 | 342,424,547 |
| Technology Innovation | 150,090,774 | 150,090,774 | 126,472,078 | 112,852,111 | 163,911,547 | 151,832,220 | 155,738,548 | 152,200,348 |
| Responsible Natural Resource Management | 179,373,009 | 179,373,009 | 193,117,981 | 165,816,726 | 387,092,977 | 267,570,932 | 282,047,031 | 236,874,939 |
| Subtotal | 793,481,827 | 793,481,827 | 573,568,520 | 465,886,444 | 921,543,692 | 711,148,591 | 752,438,462 | 731,499,834 |
| Strategic Outcome: 3. Canadians have Information to Manage their Lands and Natural Resources, and are Protected from Related Risks | ||||||||
| Protection for Canadians and Natural Resources | 55,878,528 | 55,878,528 | 58,672,639 | 59,053,121 | 66,173,756 | 65,692,439 | 65,535,095 | 55,604,146 |
| Landmass Information | 53,620,414 | 53,620,414 | 71,155,143 | 51,472,071 | 89,926,292 | 78,469,116 | 73,828,231 | 90,961,341 |
| Subtotal | 109,498,941 | 109,498,941 | 129,827,782 | 110,525,192 | 156,100,048 | 144,161,555 | 139,363,326 | 146,565,487 |
| Internal Services Subtotal | 158,919,551 | 158,919,551 | 142,789,148 | 128,635,058 | 169,193,761 | 162,499,616 | 184,198,094 | 181,093,220 |
| Total | 2,534,650,611 | 2,534,650,611 | 2,214,476,711 | 2,010,134,684 | 2,282,358,631 | 2,049,418,787 | 2,091,044,593 | 1,966,810,964 |
The overall $485 million difference between Planned Spending and Actual Spending is attributed to a $252 million reduction in authorities and lapse of $233 million. The reduction in authorities and the lapse are explained below.
NRCan’s planned spending of $2.535 billion was adjusted during the year to $2.282 billion to reflect changes in authorities granted in Budget 2014 and adjustments to statutory items. The reduction of $252 million is explained by a combination of increases and decreases.
Increases included funding for the extension of the NLLP and the United Nations Convention on the Law of the Sea (UNCLOS); the renewal of the Investments in Forest Industry Transformation Program; the facilitation of Aboriginal Participation in West Coast Energy Development; the Genomics Research and Development Initiative, as well as comprehensive claims and self-government negotiations across Canada. Increases were also a result of transfers from the Department of National Defence for the Canadian Forces Arctic Training Centre and for the support and advice for responding to the GC’s public safety and security policy imperatives; a transfer from Aboriginal Affairs and Northern Development Canada (AANDC) to enable the delivery of cost-effective, safe and efficient field logistics for the Canadian High Arctic Research Station Science and Technology program; the operating budget and capital budget carry forward, and collective bargaining for amounts before the implementation of the two year operating budget freeze.
Decreases included transfers to other departments, and reduced statutory payments to the Newfoundland Offshore Petroleum Resource Revenue Fund (which were lower than initially forecasted due to lower oil prices), Nova Scotia Crown Share Adjustment Payments (due to reduced natural gas prices along with lower production), payments to Newfoundland and Labrador and Nova Scotia Offshore Petroleum Boards as a result of voluntary remittances received from both boards and provinces.
NRCan’s actual spending of $2.049 billion compared to total authorities of $2.282 billion resulted in a lapse of $233 million, primarily due to funding being re-profiled into future years for the Port Hope Area Initiative, the Grant to Sustainable Development Technology Canada for the Technology Fund, UNCLOS, and the Gunnar mine, as well as funding for the Grant to Sustainable Development Technology Canada Next Generation Biofuels Fund, which was not provided to Sustainable Development Technology Canada. In addition, a lapse in the Grants and Contributions vote pertaining to the ecoENERGY for Biofuels program (due to funds not committed to any contribution agreements and under-production by biofuel companies) and the ecoENERGY Renewable Power program (due to lower incentive payouts based on lower production levels) contributed to the reduction in spending.
Alignment of Spending With the Whole-of-Government Framework
| Strategic Outcome | Program | Spending Area | Government of Canada Outcome | 2014-15 Actual Spending |
|---|---|---|---|---|
| 1 Canada’s Natural Resource Sectors are Globally Competitive | 1.1 Market Access and Diversification | Economic Affairs | Strong Economic Growth | 61,566,240 |
| 1.2 Innovation for New Products and Processes | Economic Affairs | Strong Economic Growth | 71,707,214 | |
| 1.3 Investment in Natural Resource Sectors | Economic Affairs | Strong Economic Growth | 60,589,504 | |
| 1.4 Statutory Programs- Atlantic Offshore | Economic Affairs | Strong Economic Growth | 837,746,067 | |
| 2 Natural Resource Sectors and Consumers are Environmentally Responsible | 2.1 Energy-Efficient Practices and Lower-Carbon Energy Sources | Economic Affairs | A Clean and Healthy Environment | 291,745,439 |
| 2.2 Technology Innovation | Economic Affairs | A Clean and Healthy Environment | 151,832,220 | |
| 2.3 Responsible Natural Resource Management | Economic Affairs | A Clean and Healthy Environment | 267,570,932 | |
| 3 Canadians have information to Manage their Lands and Natural Resources, and are Protected from Related Risks | 3.1 Protection for Canadians and Natural Resources | Social Affairs | A Safe and Secure Canada | 65,692,439 |
| 3.2 Landmass Information | Social Affairs | A Safe and Secure Canada | 78,469,116 |
| Spending Area | Total Planned Spending | Total Actual Spending |
|---|---|---|
| Economic Affairs | 2,266,232,118 | 1,742,757,616 |
| Social Affairs | 109,498,941 | 144,161,555 |
| International Affairs |
|
|
| Government Affairs |
|
|
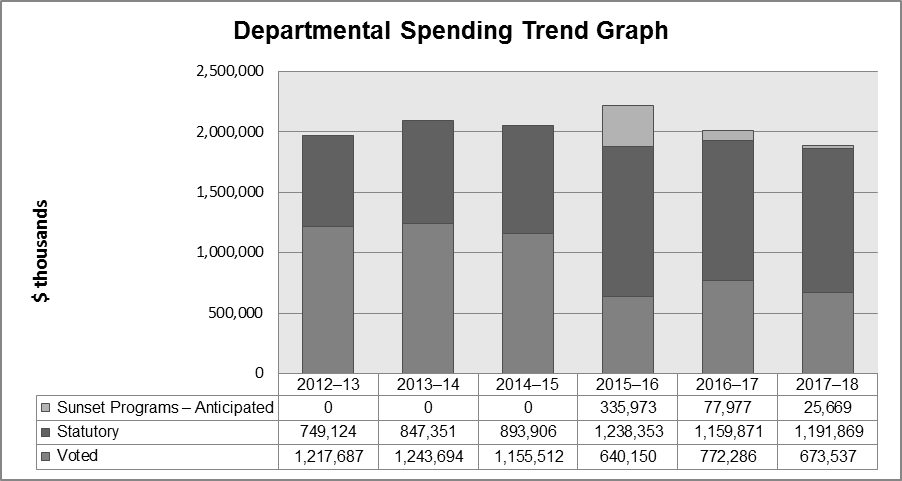
Departmental Spending Trend
Text version
| 2011-12 | 2012-13 | 2013-14 | 2014-15 | 2015-16 | 2016-17 | |
|---|---|---|---|---|---|---|
| Sunset Programs | 0 | 0 | 0 | 265,083,632 | 104,654,006 | 75,638,452 |
| Total Spending | 3,352,172,605 | 1,966,810,964 | 2,091,044,593 | 2,269,566,979 | 2,185,766,316 | 2,250,021,913 |
For fiscal years 2012-13, 2013-14 and 2014-15, the figures represent the actual expenditures as reported in the Public Accounts. NRCan’s spending profile remains steady over the period 2012-13 to 2014-15.
For the periods 2015-16 to 2017-18, the figures represent the total planned spending for the fiscal year, which reflects approved funding by Treasury Board to support the departmental strategic outcomes. The sunset amounts represent programs that are set to expire in that fiscal year, for which no government decision on the program’s future has been made. In 2015-16, a significant portion ($231.3 million) of the sunsetting programs is related to the NLLP. Planned spending from 2015-16 to 2017-18 is declining in both Voted and Statutory authorities.
Major initiatives sunsetting in 2015-16 include:
- Nuclear Legacy Liabilities Program;
- ecoENERGY Innovation Initiative; and
- ecoENERGY Efficiency Program.
Major initiatives sunsetting in 2016-17 include:
- Federal Infrastructure Initiative;
- ecoENERGY for Biofuels; and
- Wind Power Production Incentive.
Major initiatives sunsetting in 2017-18 include:
- Investments in Forest Industry Transformation Program; and
- Forest Innovation and Expanding Market Opportunities programs, which were extended to 2017-18 in Budget 2015 for which the funding has not yet been included in planned spending for 2017-18.
Estimates by Vote
For information on NRCan’s organizational Votes and statutory expenditures, consult the Public Accounts of Canada 2014 on the Public Works and Government Services Canada website.Footnote xii
Page details
- Date modified: