
Natural Resources Canada Quarterly Financial Report (Unaudited) for the Quarter Ended September 30, 2013
Statement outlining results, risks and significant changes in operations, personnel and programs
1. Introduction
This quarterly financial report should be read in conjunction with the Main Estimates and Supplementary Estimates (A), and the Net Budgetary Authorities published on the Treasury Board Secretariat website, as well as Canada’s Economic Action Plan 2013 (Budget 2013). It has been prepared by management as required by section 65.1 of the Financial Administration Act and in the form and manner prescribed by Treasury Board. This quarterly financial report has not been subject to an external audit or review.
1.1 Authority, Mandate and Programs
Natural Resources Canada (NRCan) seeks to enhance the responsible development and use of Canada’s natural resources and the competitiveness of Canada’s natural resource sectors. The department is an established leader in science and technology in the fields of energy, forests, and minerals and metals, and applies its expertise in earth sciences to build and maintain an up-to-date knowledge base of Canada’s landmass. NRCan develops policies and programs that enhance the contribution of the natural resource sectors to the economy and improve the quality of life of Canadians.Footnote 1
Further details on NRCan’s authority, mandate and programs can be found in Part II of the Main Estimates.
1.2 Basis of Presentation
This quarterly financial report has been prepared by management using an expenditure basis of accounting. The accompanying Statement of Authorities includes NRCan’s spending authorities granted by Parliament, and those used by NRCan are consistent with the Main Estimates and Supplementary Estimates (A) for the 2013-14 fiscal year. This quarterly report has been prepared using a special purpose financial reporting framework.
The authority of Parliament is required before monies can be spent by the Government. Approvals are given in the form of annually approved limits through appropriation acts or through legislation in the form of statutory spending authority for specific purposes.
As part of the Parliamentary business of supply, the Main Estimates must be tabled in Parliament on or before March 1 preceding the new fiscal year. Budget 2013 was tabled in Parliament on March 21, after the tabling of the Main Estimates on February 25, 2013, while Budget 2012 was tabled in Parliament on March 29, after the tabling of the Main Estimates on February 28, 2012. As a result, the measures in Budget 2013 could not be reflected in the 2013-14 Main Estimates and the measures in Budget 2012 were not reflected in the 2012-13 Main Estimates.
In fiscal year 2013-14, frozen allotments will be established by Treasury Board authority in departmental votes to prohibit the spending of funds identified as savings measures in Budget 2013. The changes to departmental authorities for future years will be implemented through the Annual Reference Level Update, as approved by Treasury Board, and reflected in the subsequent Main Estimates tabled in Parliament. The same approach was taken in 2012-13 for savings measures in Budget 2012.
NRCan uses the full accrual method of accounting to prepare and present its annual unaudited departmental financial statements, which are part of the Departmental Performance Report. However, the spending authorities voted by Parliament remain on an expenditure basis.
2. Highlights of Fiscal Quarter and Fiscal Year-to-Date Results
This Departmental Quarterly Financial Report reflects the results as at September 30, 2013, including Main Estimates and Supplementary Estimates (A) for which full supply was released. The details presented in this report focus on and compare the second quarter results of 2013-14 with those of 2012-13.
Authorities
As per Table 1, presented at the end of this document, and Graph 1 below, as at September 30, 2013, NRCan has authorities available for use of $2,779 million in 2013-14 compared to $2,852.3 million in 2012-13, for a net decrease of $73.3 million or 2.6%.
Graph 1
Text Version
| Fiscal year 2012-2013 | Fiscal year 2013-14 | |
|---|---|---|
| Total available for use for the year ended 31-Mar-13 |
Total available for use for the year ending 31-Mar-14 |
|
| Vote 1 - Operating | 827 | 799 |
| Vote 5 - Capital | 19 | 26 |
| Vote 10 - Grants and contributions | 752 | 639 |
| Statutory | 1,254 | 1,315 |
| Total budgetary authorities | 2,852 | 2,779 |
The decrease of $73.3 million in authorities in 2013-14 compared to 2012-13 is explained by the net effect of both decreases and increases within operating expenditures, capital expenditures, grants and contributions, and statutory authorities, as per the following.
For operating expenditures, a net decrease of $28 million in authorities is explained mainly by the following year-over-year changes:
Increases:
- $34.5 million for the Nuclear Legacy Liabilities Program as part of a planned adjustment to the program financial profile;
- $11.5 million for the Advertising Campaign Program as it was reflected in Supplementary Estimates (B) in 2012-13;
- $11.2 million for the Forest Innovation Program and Expanding Market Opportunities Program as it was reflected in Supplementary Estimates (B) in 2012-13; and
- $1.3 million for the Isotope Technology Acceleration Program as it was reflected in Supplementary Estimates (B) in 2012-13.
Decreases:
- $29.4 million for Operating Budget Carry Forward (OBCF) which was included in fiscal year 2012-13 Q2 authorities, while in fiscal year 2013-14, OBCF is not included in authorities yet;
- $20.7 million for the Geo-mapping for Energy and Minerals Program as it sunsetted on March 31, 2013;
- $18.9 million for the Budget 2012 Savings Measures that are not included in any specific programs mentioned in these operating expenditures as the amount was frozen after the first quarter of 2012-13;
- $16.1 million for the Port Hope Area Initiative as part of a planned adjustment to the program financial profile; and
- $2.6 million for the transfer to Capital Budget of existing NRCan funding for the Revitalization of NRCan’s Satellite Station Facilities across Canada.
For capital expenditures, a net increase of $6.6 million in authorities is explained mainly by the following year-over-year changes:
Increases:
- $15.1 million for the Revitalization of NRCan’s Satellite Station Facilities across Canada;
- $2.6 million for the transfer from Operating Budget of existing NRCan funding for the Revitalization of NRCan’s Satellite Station Facilities across Canada; and
- $0.4 million for the relocation of the CANMET Materials Technology Laboratory to Hamilton.
Decreases:
- $9.1 million for the construction of the Canadian Armed Forces Arctic Training Centre (CAFATC) in Resolute Bay, Nunavut, as the project was almost completed in 2012-13; and
- $2.3 million for Capital Budget Carry Forward (CBCF) which was included in fiscal year 2012-13 Q2 authorities, while in fiscal year 2013-14, CBCF is not included in authorities yet. The CBCF is mainly related to the relocation of the CANMET Materials Technology Laboratory to Hamilton and CAFATC.
For grants and contributions, a net decrease of $113 million in authorities is explained mainly by the following year-over-year changes:
Increases:
- $37.9 million for the Forest Innovation Program and Expanding Market Opportunities Program as it was reflected in Supplementary Estimates (B) in 2012-13;
- $8.6 million for the Isotope Technology Acceleration Program as it was reflected in Supplementary Estimates (B) in 2012-13; and
- $7.6 million for the Investments in Forest Industry Transformation Program due to the reprofiling of funds from 2011-12 to 2013-14.
Decreases:
- $81 million for Clean Energy Fund due to a planned adjustment to the program financial profile;
- $59.7 million for the ecoENERGY for Biofuels Producer Incentive due to a planned adjustment to the program financial profile;
- $12.5 million for the grant to Sustainable Development Technology Canada for the Next Generation Biofuels Fund due to a planned adjustment to the program financial profile;
- $6.4 million for the Budget 2012 Savings Measures that are not included in any specific programs mentioned in these grants and contributions as it was frozen after the second quarter of 2012-13; and
- $5.2 million for the Clean Energy Agenda - ecoENERGY Renewable Power Initiative related to the Budget 2012 Savings Measures.
For statutory items, a net increase of $61.1 million in authorities is explained mainly by:
Increases:
- $154.2 million in the Newfoundland Offshore Petroleum Resource Revenue Fund as expectations are that more revenue will be collected in 2013-14 than in 2012-13; and
- $22.5 million pertaining to the Crown Share Adjustment Payments for Nova Scotia Offshore Petroleum Resources as this is a new program for 2013-14.
Decreases:
- $59.3 million for the statutory grant to Sustainable Development Technology Canada (SDTC) for the Next Generation Biofuels Fund as SDTC’s cash flow does not require funding for 2013-14; and
- $56.5 million in the Nova Scotia Offshore Revenue Account caused by fluctuations in oil and gas prices and production levels.
In addition to the above detail, other minor increases and decreases occurred within the appropriated funding and in other statutory departmental programs.
Budgetary Expenditures by Standard Object
As at September 30, 2013, year-to-date spending amounts to $736.2 million or 26.5% of total funding available, compared to $841.8 million or 29.5% at the same time last year. The year-to-date decrease of $105.6 million in expenditures between 2013-14 and 2012-13 is represented in Graph 2 below and in Table 2 at the end of this document across significant standard objects.
The spending for the quarter ending September 30, 2013, amounts to $487 million or 17.5% of total funding available for the fiscal year, compared to $582.4 million or 20.4% for the same quarter last year. The decrease in expenditures for the quarter ending September 30, 2013, of $95.4 million between 2013-14 and 2012-13, is represented in Graph 2 below and in Table 2 at the end of this document across significant standard objects.
Graph 2
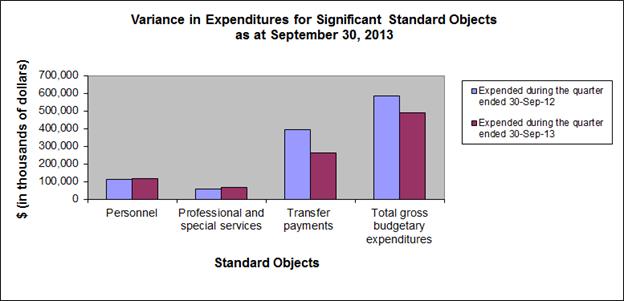
Text Version
| Fiscal year 2012-2013 | Fiscal year 2013-2014 | |
|---|---|---|
| Expended during the quarter ended 30-Sep-12 |
Expended during the quarter ended 30-Sep-13 |
|
| Personnel | 110,481 | 116,675 |
| Professional and special services | 57,531 | 68,037 |
| Transfer payments | 392,640 | 263,005 |
| Total gross budgetary expenditures | 582,422 | 487,044 |
The increase of $6.2 million in personnel expenditures between the second quarters of 2013-14 ($116.7 million) and 2012-13 ($110.5 million) is mainly explained by the following:
Increases:
- $5.5 million for personnel resulting from the timing of processing the funding advances to other government departments under the Program of Energy Research and Development and the ecoENERGY Innovation Initiative. These advances were processed in the second quarter of 2013-14 compared to the first quarter in 2012-13; and
- $3.2 million mainly attributed to increases in expenditures funded by Treasury Board (e.g. maternity/paternity leave, severance pay and vacation pay when leaving the public service) and payments related to recently signed collective bargaining agreements.
Decreases:
- $2.6 million for personnel resulting from the decrease in FTEs due to Strategic and Operating Review (SOR) and restructuring of some of the sectors.
The year-to-date expenditures for personnel expenditures decreased by $2.5 million mainly related to the decrease in FTEs due to SOR and restructuring of some of the sectors.
The increase of $10.5 million in expenditures for professional and special services between the second quarters of 2013-14 ($68 million) and 2012-13 ($57.5 million) is mainly explained by the following:
Increases:
- $7.9 million related to the Nuclear Legacy Liabilities Program (NLLP) mainly attributed to the increase in 2013-14 funding for NLLP compared to 2012-13;
- $4.1 million related to the timing of processing the operating funding advances to other government departments under the Program of Energy Research and Development and the ecoENERGY Innovation Initiative;
- $0.8 million related to the Cold Stream Well relief drilling contracting and planning which commenced in 2012-13 and for which the majority of the expenses occurred during the current fiscal year;
- $0.5 million related to the Single Window Initiative and upgrade of Ballistic Facility. These projects were started in the fourth quarter of 2012-13; and
- $0.5 million related to the advisory services for the restructuring of Atomic Energy of Canada Limited’s Nuclear Laboratories, which started in fiscal year 2013-14.
Decreases:
- $2.9 million related to the increased spending in first quarter of 2013-14 ($2.5 million) primarily as a result of activities related to IT services which occurred earlier in 2013-14 than in 2012-13. These increased expenditures in the first quarter resulted in decreased expenditure requirements in the second quarter compared to the previous year; and
- $0.3 million related to the decrease in temporary help for the Access to Information and Privacy Secretariat (ATIP) unit in 2013-14.
The year-to-date expenditures on professional and special services increased by $27.6 million and relate mainly to the same reasons as above in addition to the following:
- $11.6 million for contract work and payments under programs (e.g., the Port Hope Area Initiative, Forest Innovation Program and Expanding Market Opportunities Program) that are more advanced in 2013-14 than in the previous year.
The decrease of $129.6 million in expenditures for transfer payments between the second quarters of 2013-14 ($263 million) and 2012-13 ($392.6 million), primarily consists of:
Increases:
- $5 million for the ecoENERGY Renewable Power initiative due to increased production / increased incentives in the second quarter based on ideal incentivizing conditions; and
- $0.6 million for the Isotope Technology Acceleration Program as it was reflected in Supplementary Estimates (B) in 2012-13.
Decreases:
- $81.6 million for the payment to the Nova Scotia Crown Share Payments ($44.9 million) and for the payment to the Newfoundland Offshore Petroleum Resource Revenue Fund ($36.7 million). These statutory payments mirror royalty revenues collected in relation to offshore oil and gas activity and fluctuate based on oil and gas prices and production levels;
- $18.5 million for the Forest Innovation Program and Expanding Market Opportunities Program mainly due to the lower funding level in 2013-14 compared to 2012-13;
- $16.7 million for ecoENERGY for Biofuels Producer Incentives mainly due to lower biofuel incentives paid because of lower production for several facilities. Additionally, the incentive rate paid per litre of ethanol and biodiesel is reduced each year;
- $15 million for the payment to the Nova Scotia Offshore Revenue Account. This statutory payment mirrors royalty revenues collected in relation to offshore oil and gas activity and fluctuates based on oil and gas prices and production levels;
- $1.3 million for the Port Hope Grant in support of the Property Value Program and the Municipal Tax is a responsive program. Current trend predicts lower claim payout for 2013-14; and
- $1 million for the Wind Power Production Incentive as there was a decrease due to a gradual phasing out of this sunset initiative.
Year-to-date transfer payments decreased by a net $150.2 million between the fiscal years of 2013-14 and 2012-13, generally reflecting the changes in annual funding authorities previously explained such as:
- $71.1 million for the payment to the Newfoundland Offshore Petroleum Resource Revenue Fund;
- $44.9 million for the payment to the Nova Scotia Crown Share Payments;
- $21.5 million for the payment to the Nova Scotia Offshore Revenue Account;
- $8.4 million for the Forest Innovation Program and Expanding Market Opportunities Program; and
- $8.3 million for ecoENERGY for Biofuels Producer Incentives.
3. Risks and Uncertainties
NRCan manages a number of risks, the most prominent of which are identified in its Corporate Risk Profile. Some of these risks are financial, such as those arising from the delivery of large projects based on partnerships or grants and contributions programs. Risks associated with the implementation of Budget 2012 Savings Measures are discussed in the section ‘Budget 2012 Implementation’. These risks are being monitored and managed on an ongoing basis.
While Canada continues to outperform many of its peers in the G-7, the global economy remains volatile in the short run, impacting segments of Canada’s export-dependent resource sectors. Further, although the medium-term outlook for global demand for energy is soaring, Canada must confront structural shifts in natural resource demand and supply in both mature and emerging markets. It also faces challenges to maintaining Canada as an attractive climate for resource development which is in part driven by infrastructure limitations. These issues continue to create uncertainties which in turn affect the pace at which the department’s projects based on partnerships with external stakeholders and industry – including joint research, development and demonstration projects – can be implemented. NRCan has mitigated financial impacts by closely tracking program uptake, following best practices in accordance with the Financial Administration Act and requesting the reprofiling of funds, as required, to ensure program objectives continue to be met.
NRCan continues to manage some uncertainty, albeit less than in previous quarters, related to employee departures and the provision of transition support measures as part of the implementation of Budget 2012 Savings Measures. This issue is compounded by the annual sunsetting of specific time-limited NRCan programs and corresponding impact on staff as well as by the need to absorb costs related to collective bargaining increases following the announcement related to the operating budget freeze in the Speech from the Throne. NRCan mitigates the financial aspect of these risks through scenario planning, close tracking of workforce adjustment progress, and regular adjustments to its salary forecast. The Department continues to provide support to all of its employees affected by the Budget 2012 Savings Measures who have not yet secured an alternate position and wish to remain in the Public Service.
NRCan also continues to closely monitor its operating budget by conducting a monthly analysis of trends and forecasting in salary expenditures and non-salary expenditures, and comprehensive quarterly reviews, to ensure affordability and sustainability.
4. Significant Changes in Relation to Operations, Personnel, Programs
The second quarter of 2013-14 saw the departure of an Associate Deputy Minister and some changes at the Assistant Deputy Minister level, resulting from promotion and retirement.
No other significant changes in relation to operations, personnel or programs occurred during the second quarter of 2013-14.
5. Budget 2012 Implementation
This section provides an overview of the savings measures announced in Budget 2012 that are being implemented in order to refocus government and programs; make it easier for Canadians and businesses to deal with their government; and, modernize and reduce the back office.
NRCan’s budget was adjusted in 2012 to implement ongoing annual savings of $107 million by 2014-15, together with annual savings of $5 million associated with the horizontal review of the International Assistance Envelope. In achieving these savings, NRCan is streamlining corporate support to ensure sustainability and achieve internal efficiencies; focusing on core roles and alignment with Government priorities; focusing on work that provides clear economic benefits and adapts to changing industry circumstances; and scaling back programs to maintain affordability. In the first year of implementation, NRCan achieved savings of $67.8 million. Savings increased to $84.7 million in 2013-14 and will rise to $107 million in 2014-15 and future years. In addition, annual savings of $5 million, which began in 2012-13, were achieved through the horizontal review of the International Assistance Envelope. In implementing these changes, NRCan has made it a priority to treat its employees in an equitable, transparent and respectful manner. The transition to a smaller workforce is largely complete and the department is supporting its employees still engaged in the workforce adjustment process. A planning, monitoring and reporting framework for tracking implementation of Budget 2012 savings measures is in place. Progress on financial, HR and operational adjustments for specific savings initiatives is being tracked on a quarterly basis.
Other measures referenced in Budget 2012, which provided NRCan with renewed or new funding for a total of $162 million over two years, included:
- Supporting the Major Projects Management Office Initiative ($9 million to NRCan);
- Continuing the ongoing transformation of the forest sector through market development and innovation support ($105 million);
- Supporting the development of alternatives to existing medical isotope production technologies through the Isotope Technology Acceleration Program ($17 million);
- Revitalizing NRCan’s satellite station facilities across Canada ($23 million); and
- Supporting the Port Hope Area Initiative ($8 million).
Approved by:
Original Signed by
____________________________
Serge P. Dupont
Deputy Minister
Ottawa, Canada
Original Signed by
____________________________
Kami Ramcharan, CMA
Chief Financial Officer
November 22, 2013
Ottawa, Canada
Table 1: Statement of Authorities (unaudited)
(in thousands of dollars)
| Fiscal year 2013-14 | Fiscal year 2012-13 | |||||
|---|---|---|---|---|---|---|
| Total available for use for the year ending March 31, 2014* |
Used during the quarter ended September 30, 2013 |
Used year-to-date at quarter-end |
Total available for use for the year ending March 31, 2013** |
Used during the quarter ended September 30, 2012 |
Used year-to-date at quarter-end |
|
| Vote 1 - Net Operating Expenditures | 799,352 | 203,606 | 358,907 | 827,310 | 170,515 | 316,119 |
| Vote 5 - Capital Expenditures | 25,535 | 5,457 | 6,279 | 18,941 | 4,297 | 4,535 |
| Vote 10 - Grants and Contributions | 638,924 | 76,663 | 103,641 | 751,919 | 109,708 | 116,353 |
| Statutory Payments | ||||||
| Minister of Natural Resources – Salary and motor car allowance | 79 | 20 | 39 | 78 | 20 | 39 |
| Contributions to employee benefit plans | 59,957 | 14,927 | 29,853 | 59,716 | 14,929 | 29,858 |
| Collection agency fees under sec 17.1 of the Financial Administration Act | - | 1 | 2 | - | 19 | 19 |
| Spending of amounts equivalent to proceeds from disposal of surplus crown assets | - | 28 | 28 | - | 2 | 2 |
| Canada Foundation for Sustainable Development Technology Grant | - | - | - | 59,338 | - | - |
| Contribution to the Canada/Newfoundland Offshore Petroleum Board | 7,756 | 1,913 | 3,825 | 7,756 | 1,909 | 3,818 |
| Contribution to the Canada/Nova Scotia Offshore Petroleum Board | 3,550 | 938 | 1,875 | 3,450 | 887 | 1,775 |
| Payments to the Nova Scotia Offshore Revenue Account | 79,339 | 8,866 | 10,835 | 135,846 | 23,911 | 32,338 |
| Payments to the Newfoundland Offshore Petroleum Resource Revenue Fund | 1,142,062 | 161,770 | 208,010 | 987,902 | 198,450 | 279,137 |
| Crown Share Adjustment Payments for Nova Scotia Offshore Petroleum Resources | 22,460 | 12,856 | 12,856 | - | 57,775 | 57,775 |
| Total Statutory Payments | 1,315,203 | 201,318 | 267,323 | 1,254,086 | 297,901 | 404,761 |
| Total Budgetary Authorities | 2,779,014 | 487,044 | 736,150 | 2,852,256 | 582,422 | 841,768 |
* Total available for use includes only authorities available for use and granted by Parliament at quarter-end through the Main Estimates and Supplementary Estimates (A) and does not reflect measures announced in Budget 2013.
** Total available for use does not reflect measures announced in Budget 2012, except for the renewal of the Major Projects Management Office, which was included in Supplementary Estimates (A) and is included in the total available.
Table 2: Budgetary Expenditures by Standard Object (unaudited)
(in thousands of dollars)
| Fiscal year 2013-14 | Fiscal year 2012-13 | |||||
|---|---|---|---|---|---|---|
| Planned expenditures for the year ending March 31, 2014* |
Expended during the quarter ended September 30, 2013 |
Year-to-date used at Quarter- end |
Planned expenditures for the year ending March 31, 2013** |
Expended during the quarter ended September 30, 2012 |
Year-to-date used at Quarter-end |
|
| Budgetary Expenditures: | ||||||
| Personnel | 404,149 | 116,675 | 224,415 | 402,004 | 110,481 | 226,899 |
| Transportation and communication | 39,679 | 3,805 | 6,344 | 39,241 | 4,501 | 7,121 |
| Information | 10,792 | 8,819 | 12,267 | 7,861 | 2,486 | 3,024 |
| Professional and special services | 336,497 | 68,037 | 118,098 | 387,644 | 57,531 | 90,465 |
| Rentals | 20,352 | 6,683 | 9,903 | 15,771 | 6,851 | 10,769 |
| Repair and maintenance | 8,110 | 718 | 909 | 6,434 | 545 | 825 |
| Utilities, materials and supplies | 32,289 | 3,646 | 5,853 | 21,935 | 3,949 | 6,066 |
| Acquisition of land, buildings and works | 24,982 | 52 | 52 | 18,941 | 3,519 | 3,519 |
| Acquisition of machinery and equipment | 33,682 | 5,641 | 8,021 | 31,987 | 1,714 | 2,372 |
| Transfer payments | 1,894,091 | 263,005 | 341,042 | 1,946,211 | 392,640 | 491,196 |
| Other subsidies and payments | 10,160 | 14,504 | 20,596 | 7,560 | 4,145 | 10,035 |
| Total Budgetary Expenditures | 2,814,783 | 491,585 | 747,499 | 2,885,589 | 588,362 | 852,291 |
| Less: | ||||||
| Total Revenues Netted Against Expenditures | 35,768 | 4,541 | 11,349 | 33,333 | 5,940 | 10,523 |
| Total Net Budgetary Expenditures | 2,779,014 | 487,044 | 736,150 | 2,852,256 | 582,422 | 841,768 |
* Planned expenditures do not reflect measures announced in Budget 2013.
**Planned expenditures do not reflect measures announced in Budget 2012, except for the renewal of the Major Projects Management Office, which was included in Supplementary Estimates (A) and had started spending prior to June 30, 2012.
Page details
- Date modified: