
Canadian Energy Assets, 2018
The global presence of Canadian energy companies
Canadian energy companies significantly contribute to Canada’s economy – through the production of valuable commodities, job creation, and government revenue. Canadian energy assets (CEA) consist of long-term assets owned by Canadian-controlled energy companies listed on Canadian stock markets including energy properties, plant and equipment, and any other energy-related assets. Some of these assets are located in Canada while others are located abroad as a result of the international reach of the activities of many companies.
In 2018, there were 265 active Canadian energy companies, of which 49 had energy assets with a value in excess of $1 billion. The total value of CEA grew in 2018 to $685 billion, an increase of 5% from $654 billion in 2017. The increase was driven by new investments in the United States, Europe and Latin America. These increases more than offset the declines in value observed in Canada, Asia and Oceania.
Many Canadian energy companies are active internationally, which means they own assets outside of Canada. In 2018, 132 energy companies had interests outside of Canada, in 53 countries. Canadian energy assets abroad (CEAA) totaled $233 billion in 2018, representing 34% of total energy assets. By comparison, CEAA totaled $200 billion in 2017.
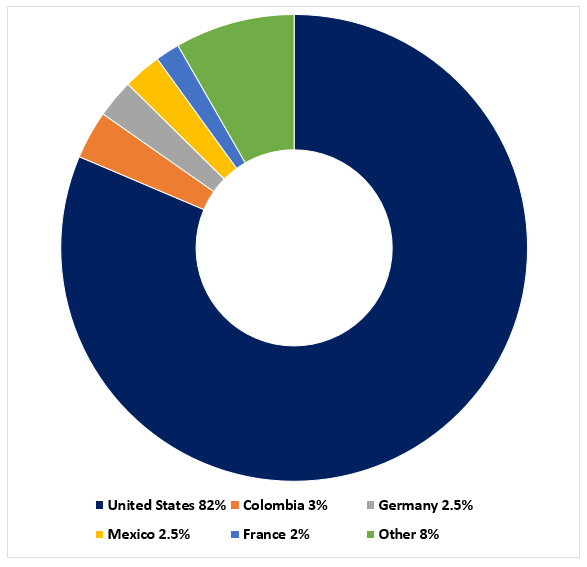
The large majority of CEAA value (82%) is located in the United States. The top five countries by CEAA value are the United States ($190 billion), Colombia ($8 billion), Germany ($6 billion), Mexico ($6 billion) and France ($4 billion).
Percentage of CEAA by country, 2018
Text summary
In 2018, 82% of the Canadian Energy Assets Abroad (CEAA) value was located in the United States. The second largest portion of the CEAA was located in Colombia with 3%, followed by Germany with 2.5%, Mexico with 2.5%, and France with 2%.
Regional highlights
At home in Canada (-$2.2 billion, -0.5%), the value of energy assets declined slightly due to important disposition of assets made by energy companies domestically because of discontinued operations in certain sectors. Among the largest decreases, Cenovus Energy (-$4.1 billion, -13%), which had increased its assets by $18 billion in the previous year, sold conventional assets, due to discontinued operations in this segment, including heavy oil assets at Pelikan Lake and natural gas assets in the Suffield area in Alberta. Similarly, Crescent Point Energy (-$2.8 billion, -22%) sold assets in Saskatchewan and in Alberta, while Enbridge Inc. (-$1.3 billion, -3%) sold gas installations, including the Enbridge Gas New-Brunswick and 50% of all their Canadian renewable assets.
It is important to note that some energy companies increased investments in Canada. However, these investments were not enough to offset the total divestments made in the sector. The largest investments were made by Baytex Energy (+$2.1 billion, 123%), which acquired the Canadian energy company Raging River Exploration Inc., whose energy assets totaled $1.5 billion in 2017. As both companies are registered in Canada, this transaction did not affect the total Canadian energy asset value. TC Energy (+$1.6 billion, 7.4%) significantly increased investments in natural gas infrastructure, particularly with the expansion of the NGTL System and the Canadian Mainline natural gas pipelines. Finally, Vermilion Energy Inc. (+$1.5 billion, 98%) acquired Spartan, a private Canadian oil and gas producer based in Saskatchewan.
In the United States (+$29 billion, 18%), significant growth in energy asset values can be attributed largely to four companies, including pipeline company TC Energy (+$6.7 billion, 22%), which heavily invested in the expansion of its distribution network. Natural gas distributor Enbridge Inc. (+5.1 billion, 11.5%) substantially invested in gas transmission and distribution network, while Altagas Ltd. (+$6.2 billion, 262%) increased its interests in the US market by acquiring the Washington-based natural gas company WGL Holdings.
In Mexico (+$1 billion, 20%), the growth can be attributed mainly to TC Energy (+$940 million, 19%), which invested in pipeline projects in the country.
Variation from 2017 to 2018
| Region | 2017 ($billions) | 2018 ($billions) | Variation in $ billion | Variation in % |
|---|---|---|---|---|
| Africa | 3.2 | 3.3 | 0.1 | 1.9% |
| Asia | 4.2 | 3.9 | -0.3 | -7.9% |
| Europe | 13.1 | 14.7 | 1.6 | 12.3% |
| Latin America and Caribbean | 10.8 | 12.2 | 1.5 | 13.6% |
| North America (US and Mexico) | 165.4 | 195.7 | 30.4 | 18.4% |
| Oceania | 3.2 | 3.1 | -0.1 | -3.3% |
| Total Canadian Energy Assets Abroad | 199.8 | 232.9 | 33.1 | 16.5% |
| Canada | 454.4 | 452.2 | -2.2 | -0.5% |
| Total Canadian Energy Assets | 654.3 | 685.1 | 30.8 | 4.7% |
REGIONAL HIGHLIGHTS
After three years of decline, energy asset values in Latin America and Caribbean (+$1.5 billion, 13.6%) substantially increased by 13.6%. The largest contribution came from AM Resources (+$672 million, 45%) and Gran Tierra Energy Inc. (+$323 million, 23%), whose primary operations are in Colombia. Investments in Peru and Argentina have decreased for a fourth consecutive year, while investments in Colombia have increased for a third consecutive year.
The value of energy assets in Asia (-$460 million, -11%) fell to its lowest level since 2015 as Niko Resources (-$417 million, -100%), was delisted from the Toronto Stock Exchange (TSX). Moreover, the value of Cameco Corporation’s aseets (-$120 million, -42%) decreased by 42%, mainly due to the reduction from 60% to 40% of its share in the joint venture Inkai.
The decline of energy assets in Asia was partly offset by a large increase in assets of Ensign Energy Corp. (+214 million, 131%). This increase is due to the acquisition of Trinidad Drilling Ltd. which provides greater opportunity for the company to establish itself in new Asian markets.
Energy assets in Europe increased (+$1.6 billion, 12%) in 2018. This increase can be attributed mainly to two companies: Innergex (+$815 million, 84%), which completed the acquisition of Alterra Power Corp. in February 2018 and invested in an expansion project in Iceland and Boralex Inc. (+$513 million, 37%) which acquired Kallista Energy SAS, a French wind power company. Northland Power Inc. (+$307 million, 5.5%) also increased its European assets, particularly in Germany where the company is adding offshore wind power to its portfolio. The largest decrease came from Canadian Natural Resources Limited (-$155 million, -8.3%) whose European energy assets decreased for the fourth year in a row.
The value of Canadian energy assets in Africa (+$61 million, 1.9%) remained relatively steady in 2018. The largest investments came from Africa Oil Corp. (+$51 million, 7.8%) and Suncor (+$47 million, 7%).
The value of energy assets in Oceania (-$105 million, -3%) slightly decreased. This decline can mostly be attributed to two companies: TransAlta Corp. (-$52 million, -9.4%) which sold one of its natural gas power stations in Australia and Tag Oil Ltd. (-$43 million, -61%) which sold oil and gas operations in New Zealand.
Annual variations
In comparing the value of assets over time, it is important to understand the causes of variations. Additions arise mostly from asset exploration, development and construction. Subtractions arise from asset changes in reserve economics, write-offs, impairments, depreciation and asset sales. Exchange rate movements, mergers and acquisitions, and spin-offs also contribute to annual variations.
The methodology used to compile CEA could also contribute to annual variations. Canadian energy assets (CEA) include energy assets held by publically traded companies headquartered in Canada and that are not foreign controlled at the end of each calendar year. Energy assets are non-current, fixed assets that cannot be easily moved or converted into cash and include energy properties, plant and equipment, deferred exploration expenditures, investments in non-Canadian energy companies, goodwill, and other non-current assets related to energy that can be reconciled geographically. The analysis covers Canadian energy companies with operations in upstream oil and gas (including services), oil and gas pipelines, petroleum and coal products manufacturing, uranium and coal mining, or electricity production. This methodology provides consistency and comparability from one year to another, but many variations could occur due to its nature. For instance, when a company is delisted from the Toronto Stock Exchange (TSX), their asset value is no longer reported even though they may continue to exist as a private energy company.
Use of CEAA statistics
Some care is required when determining the value of Canadian energy investment in a particular country. CEAA, as tracked by Natural Resources Canada (NRCan), differs from Canadian direct investment abroad (CDIA) figures estimated by Statistics Canada. CDIA is based on foreign direct investment (FDI) as defined by the International Monetary Fund (IMF) in the Balance of Payments and International Investment Position Manual. CEAA are based on financial accounting standards used by Canadian public companies. Table 2 outlines the principal differences between these approaches.
CDIA compared to CEAA
Canadian direct investment abroad (Statistics Canada)
- A Canadian company includes all companies incorporated in Canada with foreign affiliates, irrespective of the location of its headquarters and whether it is foreign-controlled.
- Examines all asset and liability positions of Canadian companies with their foreign affiliates.
- Financing must come from Canadian sources and only investments resulting in a minimum of 10% control of investee are included.
- Data is based on the first destination. For example, Canadian investment destined for Mexico through a U.S. subsidiary is allocated to the U.S.
- Country level data are not available by industry and no company data are available.
Canadian energy assets abroad (Natural Resources Canada)
- A Canadian company must have its headquarters in Canada and not be foreign-controlled.
- Examines only non-current energy asset values as reported in Canadian companies’ consolidated balance sheets.
- The source of the financing is immaterial.
- Data is based on the final destination. The example in the left column would be counted as CEAA in Mexico.
- Country and company level data are available.
Page details
- Date modified: